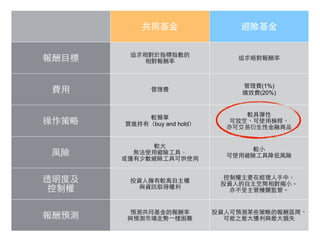
Risk Management Lessonsfrom
Long-Term Capital Management
簡報⼈人 / 吳培菱 吳岱恩 張博能 楊庭杰
Philippe Jorion
Published in: European Financial Management 6(September 2000): 277 300
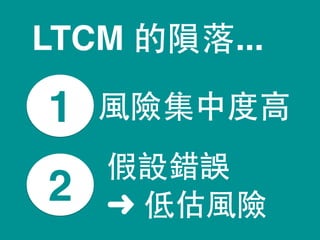
2.
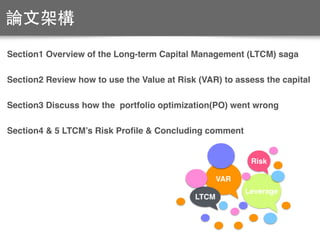
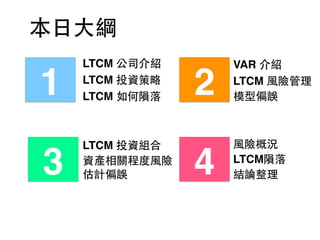
論⽂文架構
Section1 Overview ofthe Long-term Capital Management (LTCM) saga
Section2 Review how to use the Value at Risk (VAR) to assess the capital
Section3 Discuss how the portfolio optimization(PO) went wrong
Section4 & 5 LTCM’s Risk Profile & Concluding comment
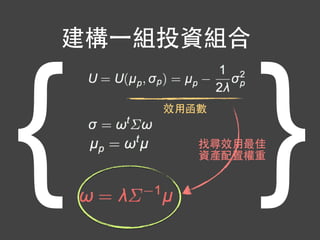
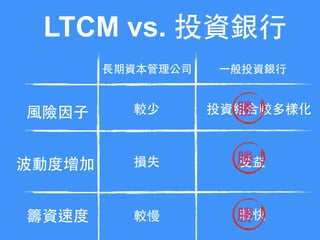
VAR
Leverage
Risk
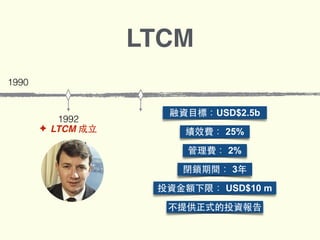
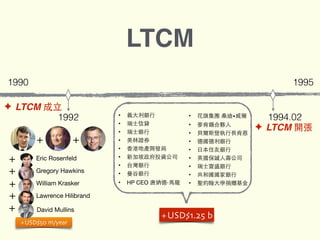
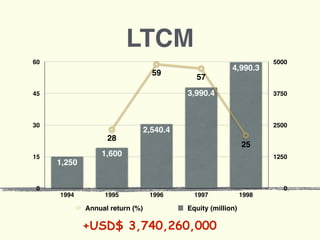
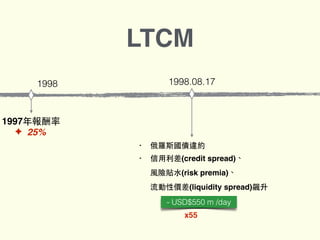
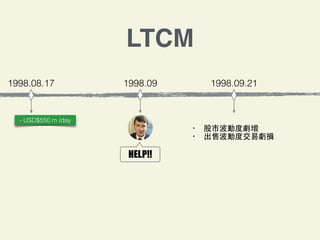
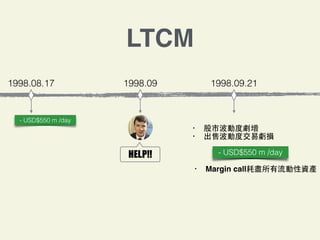
LTCM
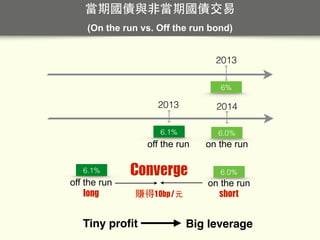
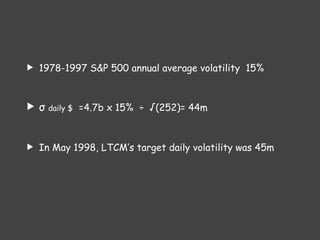
6%
2013
6.1%
2013
6.0%
2014
on the runoffthe run
賺得10bp/元
6.0%
on the run
6.1%
off the run
Converge
Tiny profit Big leverage
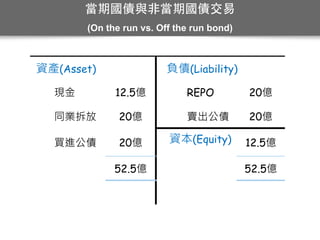
當期國債與⾮非當期國債交易
(On the run vs. Off the run bond)
shortlong
17.
• 1994:
美國當期債券(On therun)與⾮非當期債券(Off the
run)相差12 bp
• LTCM⼤大量買⼊入⾮非當期債券、賣出當期債券
當期國債與⾮非當期國債交易
(On the run vs. Off the run bond)
18.
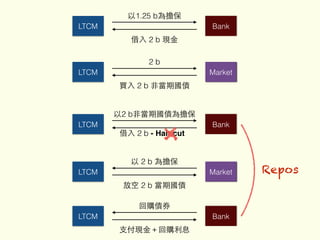
LTCM Bank
回購債券
⽀支付現⾦金+回購利息
LTCM Bank
以1.25b為擔保
借⼊入 2 b 現⾦金
LTCM Market
2 b
買⼊入 2 b ⾮非當期國債
LTCM Market
以 2 b 為擔保
放空 2 b 當期國債
LTCM Bank
以2 b⾮非當期國債為擔保
借⼊入 2 b - Hair cut
Repos
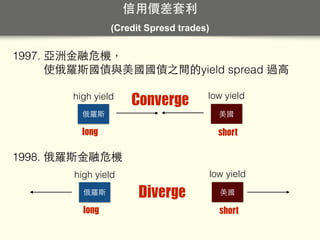
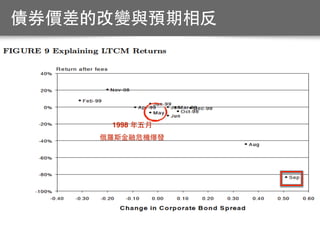
信⽤用價差套利
(Credit Spresd trades)
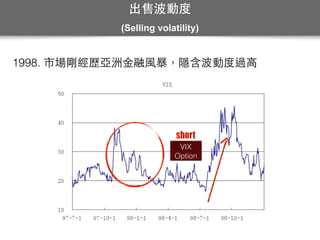
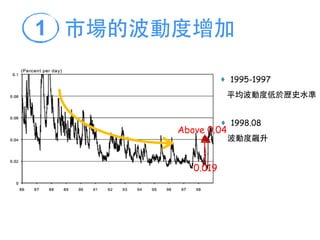
1997.亞洲⾦金融危機,
使俄羅斯國債與美國國債之間的yield spread 過⾼高
Converge
long
俄羅斯
high yield
short
美國
low yield
1998. 俄羅斯⾦金融危機
俄羅斯
long
high yield
Diverge 美國
short
low yield
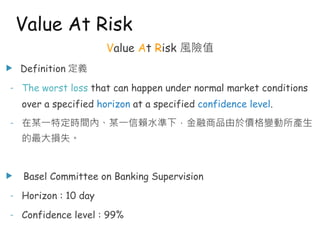
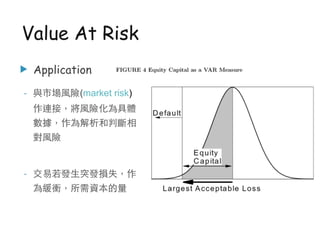
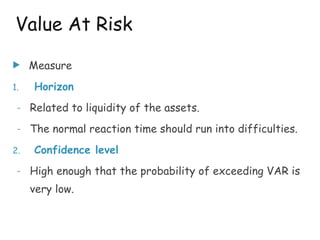
Value At Risk風險值
u Definition 定義
- The worst loss that can happen under normal market conditions
over a specified horizon at a specified confidence level.
- 在某一特定時間內、某一信賴水準下,金融商品由於價格變動所產生
的最大損失。
u Basel Committee on Banking Supervision
- Horizon : 10 day
- Confidence level : 99%
Value At Risk
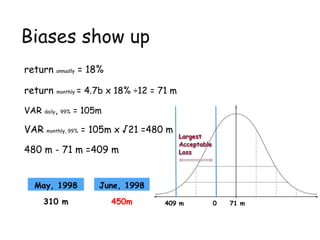
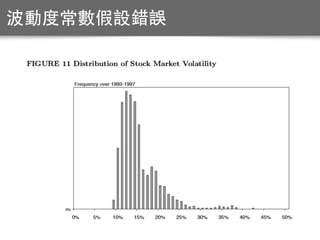
Biases show up
returnannually = 18%
return monthly = 4.7b x 18% ÷12 = 71 m
VAR daily, 99% = 105m
VAR monthly, 99% = 105m x √21 =480 m
480 m - 71 m =409 m
May, 1998 June, 1998
310 m 450m 409 m 71 m
Largest
Acceptable
Loss
0
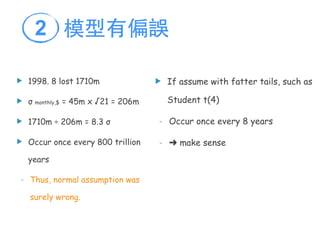
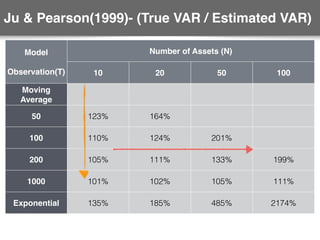
u 1998. 8lost 1710m
u σ monthly,$ = 45m x √21 = 206m
u 1710m ÷ 206m = 8.3 σ
u Occur once every 800 trillion
years
- Thus, normal assumption was
surely wrong.
u If assume with fatter tails, such as
Student t(4)
- Occur once every 8 years
- ➜ make sense
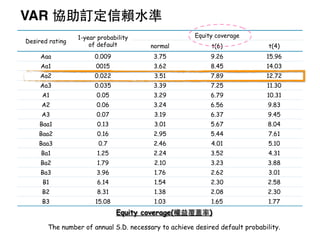
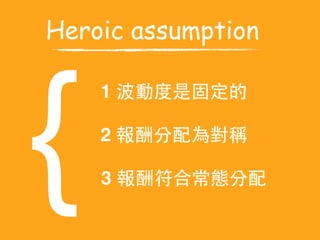
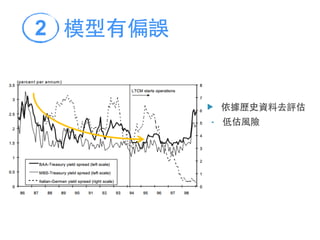
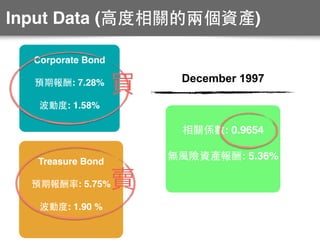
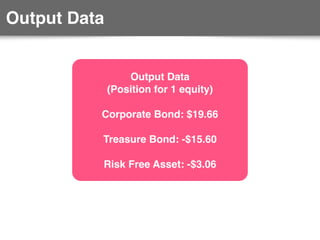
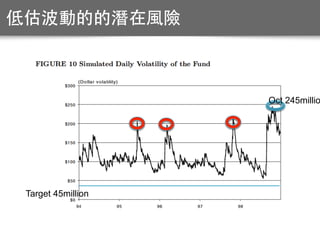
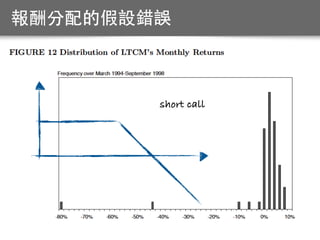
模型有偏誤2
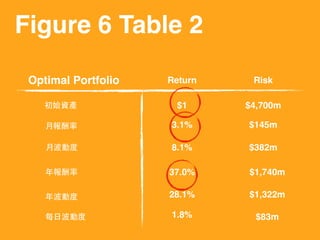
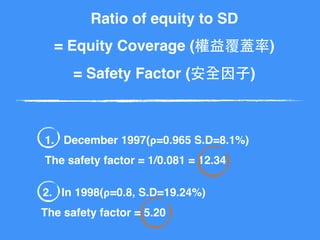
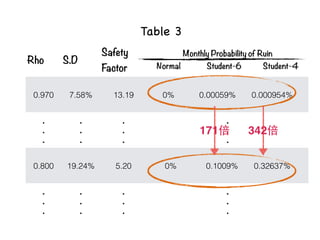
Ratio of equityto SD
= Equity Coverage(權益覆蓋率)
= Safety Factor(安全因⼦子)
i.e: Sum of Bond is $1 = $19.66 - $15.60 - 3.06
Monthly volatility is 0.081.
Thus, safety factor value means $1/$0.081=12.3
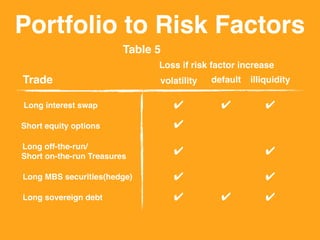
Portfolio to RiskFactors
Trade
Loss if risk factor increase
Long interest swap
Short equity options
Long off-the-run/
Short on-the-run Treasures
Long MBS securities(hedge)
Long sovereign debt
volatility default illiquidity
✔
✔
✔
✔
✔
✔
✔
✔
✔
✔
✔
Table 5
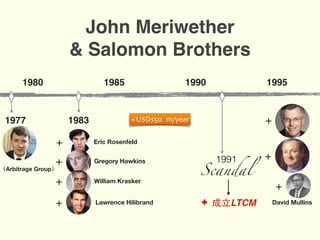
Dream Team
John MeriwetherRobert C. Merton Myron Scholes
David Mullins Lawrence Hilibrand
Eric Rosenfeld Gregory Hawkins
William Krasker
Richard Leahy
93.
資產(Asset) 負債(Liability)
現金 12.5億REPO 20億
同業拆放 20億 賣出公債 20億
買進公債 20億 資本(Equity) 12.5億
52.5億 52.5億
槓桿比率(Leverage ratio)=52.5/12.5=4.2
當期國債與⾮非當期國債交易
(On the run vs. Off the run bond)
u Measure
1. Horizon
-Related to liquidity of the assets.
- The normal reaction time should run into difficulties.
2. Confidence level
- High enough that the probability of exceeding VAR is
very low.
Value At Risk
98.
Value At Risk
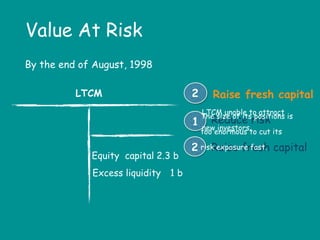
LTCM
Bythe end of August, 1998
Equity capital 2.3 b
Excess liquidity 1 b
Reduce risk1
Raise fresh capital2
The size of its positions is
too enormous to cut its
risk exposure fast.
LTCM unable to attract
new investors.
Raise fresh capital2
99.
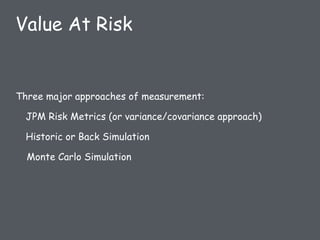
Three major approachesof measurement:
JPM Risk Metrics (or variance/covariance approach)
Historic or Back Simulation
Monte Carlo Simulation
Value At Risk
100.
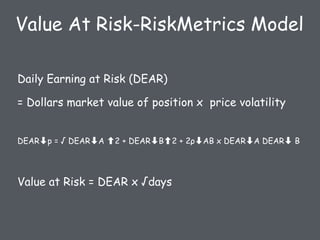
Value At Risk-RiskMetricsModel
Daily Earning at Risk (DEAR)
= Dollars market value of position x price volatility
DEAR➡p = √ DEAR➡A 2 + DEAR➡B 2 + 2ρ➡AB x DEAR➡A DEAR➡ B
Value at Risk = DEAR x √days
101.
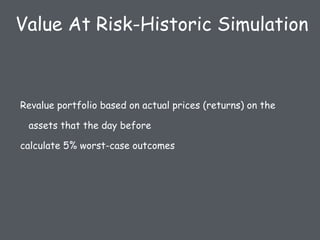
Revalue portfolio basedon actual prices (returns) on the
assets that the day before
calculate 5% worst-case outcomes
Value At Risk-Historic Simulation
102.
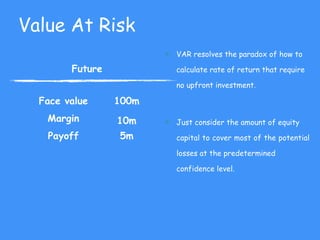
Value At Risk
Future
Facevalue 100m
Margin 10m
Payoff 5m
u VAR resolves the paradox of how to
calculate rate of return that require
no upfront investment.
u Just consider the amount of equity
capital to cover most of the potential
losses at the predetermined
confidence level.


![DTCC Securities - Life Cycle " [LcoaS.pdf]](https://cdn.slidesharecdn.com/ss_thumbnails/lcoas-160626072717-thumbnail.jpg?width=640&height=640&fit=bounds)