The magnificient 7 and equity markets review 7
•
0 likes•197 views

The document reviews "The Magnificent 7" indicators that are used to assess the health of equity markets. Most of the indicators, including the S&P 500, US bank stocks, and global financial stocks, are positive and showing resilience in markets. However, the author believes there are still headwinds ahead and it remains a trading market rather than a strong bull market. The indicators are positive currently but the author expects supportive monetary policies to continue from the Fed and ECB, which will support equity markets.

Recommended
Recommended
More Related Content
What's hot
What's hot (20)
Similar to The magnificient 7 and equity markets review 7
Similar to The magnificient 7 and equity markets review 7 (20)
More from Markets Beyond
More from Markets Beyond (20)
Recently uploaded
Recently uploaded (20)
The magnificient 7 and equity markets review 7
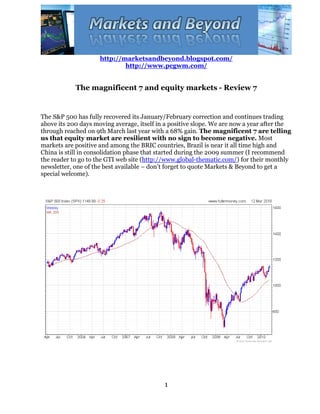
- 1. http://marketsandbeyond.blogspot.com/ http://www.pcgwm.com/ The magnificent 7 and equity markets - Review 7 The S&P 500 has fully recovered its January/February correction and continues trading above its 200 days moving average, itself in a positive slope. We are now a year after the through reached on 9th March last year with a 68% gain. The magnificent 7 are telling us that equity market are resilient with no sign to become negative. Most markets are positive and among the BRIC countries, Brazil is near it all time high and China is still in consolidation phase that started during the 2009 summer (I recommend the reader to go to the GTI web site (http://www.global-thematic.com/) for their monthly newsletter, one of the best available – don’t forget to quote Markets & Beyond to get a special welcome). 1
- 2. http://marketsandbeyond.blogspot.com/ http://www.pcgwm.com/ S&P 500 Banks index: the index has finally breached the 140 mark, a level not reached since December 2008. The index continues to trade above its 200 days moving average. Technically, the sector is slightly in overbought territory but nothing to worry about. Positive. 2
- 3. http://marketsandbeyond.blogspot.com/ http://www.pcgwm.com/ Global 1200 financial index: The world financial sector has almost totally recovered from its beginning of the year weakness, following the alleviation of fears of a Greek default. The index is back above its 200 days moving average. If there is no meltdown in the Eurozone area due to difficulties to finance budgets deficits and refinance public debt, the index should rather quickly break the 1000 level. Positive. 3
- 4. http://marketsandbeyond.blogspot.com/ http://www.pcgwm.com/ TED spread (LIBOR USD 3 mth - US 3 mth T-bills): The spread is now near its 20 years low reached in 2000, at less than 12 basis points (0.12%). The interbank market shows no stress and reflects the continued ample liquidity provided to US banks by the FED. Positive. 4
- 5. http://marketsandbeyond.blogspot.com/ http://www.pcgwm.com/ USD bank BBB 10 yr - US 10 yr yield: The picture continues to steadily improve despite the increasing number of US banks being taken over by the FDIC. Whilst still high and above historical average, the spread has steadily decreased to 3.5%, where it was in July 2008. Positive. 5
- 6. http://marketsandbeyond.blogspot.com/ http://www.pcgwm.com/ OEX volatility: OEX volatility is back to its low of the year at 17%, 10% less than the spike registered in January when the Greek crisis became widely known. We need this indicator to stay at or below 20%. Positive. 6
- 7. http://marketsandbeyond.blogspot.com/ http://www.pcgwm.com/ S&P Case Shiller house price index: The latest data (December) published 23rd February continue to show improvement in their annual rates of return. The S&P/Case- Shiller U.S. National Home Price Index, which covers all nine U.S. census divisions, recorded a 2.5% decline in the fourth quarter of 2009 versus the fourth quarter of 2008. This is a significant improvement over the annual rates reported in the first, second and third quarters of the year, at -19.0%, -14.7% and -8.7%, respectively. In December, the adjusted 10-City and 20-City Composites numbers show the 7th m/m consecutive increase in both indices; the unadjusted data are however showing for the 3rd consecutive month a slight decrease. Composite-10: December 2009: m/m +0.3%, y/y -2.4% Composite-20: December 2009: m/m +0.3%, y/y -3,8% The rate of improvement seen during the summer 2009 has not been sustained and the health of the recovery is still unclear. Signs are becoming more positive but still ambivalent. Slightly positive. 7
- 8. http://marketsandbeyond.blogspot.com/ http://www.pcgwm.com/ Oil price: The oil prices continue to be capped at +/- $80/b. Not much happening on the energy front. In the US gas prices, after recovering to +/- $6/btu from +/- $2.5/btu, are back below $5/btu with the number of rig count increasing rapidly. Uranium is back where it was in April 2009 in the $40 region: Positive. 8
- 9. http://marketsandbeyond.blogspot.com/ http://www.pcgwm.com/ Conclusion: All these indicators are positive. The 10% correction seems to have just been a pause in a bull market, does it? I cannot however believe that all is fine. There are too many headwinds ahead (I will write an analysis on this subject in a forthcoming paper). This is mainly a trading market. For the rest, invest in high yielding securities / net cash companies with strong franchise. I continue to expect no tightening by the FED (only the fed funds really matter, not the discount rate) and the ECB any time soon despite the rhetoric. This will be supportive to equity markets and a major tailwind. 9