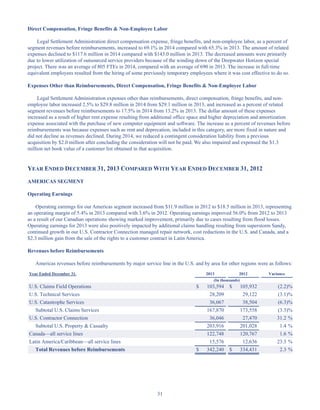
Download to read offline


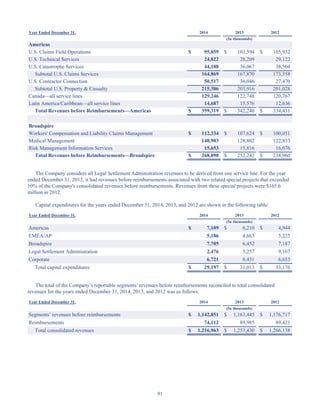
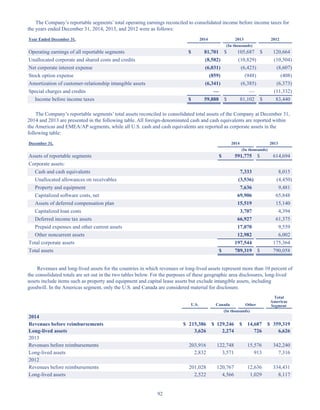
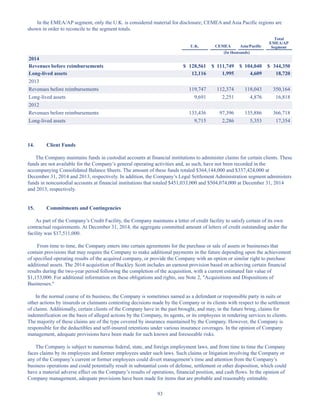
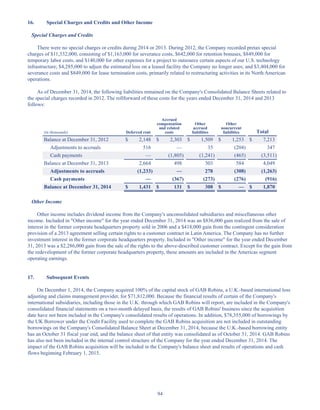

The document is the 2014 annual report of Crawford & Company, a global claims management company. It discusses Crawford's strategic focus on innovation and clients in 2014 despite lower claims volumes. Key points include: - Crawford made acquisitions to expand globally and in specialty markets like construction. - Broadspire improved significantly with nearly 90% higher operating earnings. - Investments were made in technology and capabilities to better serve multinational clients. - The future remains optimistic with plans to leverage resources through a new global business services center.


![Company Profile TJE Freight Solutions (PTY) LTD[1]](https://cdn.slidesharecdn.com/ss_thumbnails/6a5cbcab-53ab-403b-9cb9-f2e2eb1a4841-160310195307-thumbnail.jpg?width=640&height=640&fit=bounds)


