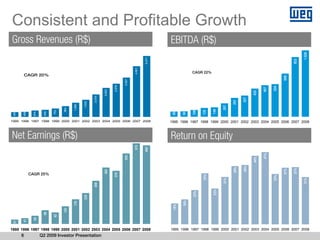
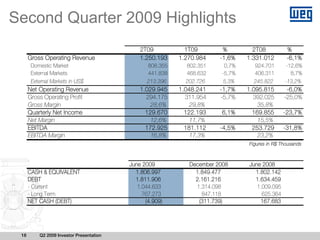
SlideShare a Scribd company logo
1 of 25
Download to read offline
Investor Presentation
Q2 2009
Motors | Automation | Energy | Paints
Disclaimer
The information contained herein has been prepared by WEG S.A. (“WEG” or the “Company”) solely for meetings held with investors
and/or potential investors. This material does not constitute offering material in whole or part, and you must obtain further information
before making an investment decision in respect of the common shares of the Company.

This material has been prepared solely for informational purposes and is not to be construed as a solicitation or an offer to buy or sell any
securities and should not be treated as giving investment advice. It is not targeted to the specific investment objectives, financial situation
or particular needs of any recipient. No representation or warranty, either express or implied, is made as to the accuracy, completeness or
reliability of the information contained herein. It should not be regarded by recipients as a substitute for the exercise of their own judgment.
Any opinions expressed in this material are subject to change without notice and WEG is not under obligation to update or keep current the
information contained herein. In addition, WEG has been informed that their affiliates, agents, directors, partners and employees may
make purchases and/or sales as principals or may act as market makers or provide investment banking or other services to the Company.
The Company and their respective affiliates, agents, directors, partners and employees accept no liability whatsoever for any loss or
damage of any kind arising out of the use of all or any part of this material.

You should consult your own legal, regulatory, tax, business, investment, financial and accounting advisers to the extent that you deem
necessary, and you must make your own investment, hedging or trading decision based upon your own judgment and advice from such
advisers as you deem necessary and not upon any view expressed in this material.

This material includes forward-looking statements subject to risks and uncertainties, which are based on current expectations and
projections about future events and trends that may affect the Company’s business. These statements include projections of economic
growth and energy demand and supply, as well as information about competitive position, the regulatory environment, potential
opportunities for growth and other matters. Several factors may adversely affect the estimates and assumptions on which these
statements are based, many of which are beyond our control.


    2        Q2 2009 Investor Presentation
Diversification as Core Value
                                                Services


                          Energy                            Electronic          Energy
                         Generation                         Components          Substations


                                              Motor         Transformer
                                 Electric                             Distribution
                                 Components                                  Panel
                                                 Generator

                                                        Motor
                                                        Control
                                                        Panel

                                       Industrial Process
                                          Automation


                                                                                              Industrial Application
                                                                                              Paints and Varnishes


 3   Q2 2009 Investor Presentation
Business Areas
                     Electro-Electronic            Generation,               Motors for Domestic                      Industrial Paints
                   Industrial Equipments        Transmission and                     Use                               and Varnishes
                                                   Distribution

Focus                      Global                  Americas                     Latin America                              Brazil


                       Low and medium         Hydro, thermal (natural
                   tension electric motors,   gas, biomass and other)                                                    Liquid and
                     industrial automation     and wind generators,           Single phase electric                   powdered paints,
Products             equipments, electro-      transformers, control                 motors                           electro-isolating
                    electronic components     panels and automation                                                      varnishes
                         and services                 services


                    Capital goods OEMs               Generation,                                                      General industrial
                   (pumps, compressors,          transmission and            “White goods” OEMs                         and specialty
Consumer            machines) and end-               distribution             (washing machines,                         applications
                    users (steel, mining,     concessionaries, small         HVAC*), water pumps,                       (shipbuilding,
Markets                                         hydro power plants
                   pulp & paper, oil & gas,    (PCH), co-generation,           lawn mowers, etc                           aggressive
                          ethanol)                industrial clients                                                   environments)


Performance         Industrial Production     Growing investments in           Disposable income,                       Brazilian GDP
                  growth and Investments        energy generation              supply of credit and                        growth
Drivers           in Fixed Capital (capex)                                    level of interest rates

                                                                        * Heating, Ventilation and Air Conditioning
  4     Q2 2009 Investor Presentation
Revenues Breakdown
                                                      5.471
                                                        5%
                                              4.551   12%
                                               6%
                                    3.527      14%     27%

                   2.978             6%
                                     15%       23%                        2.521
     2.603          6%                                           2.431
      6%            18%                 18%                       5%       6%
     21%            14%                                          13%      10%
     10%                                                                  34%
                                                      55%        26%
                                        61%   57%
     63%            62%
                                                                 56%       50%


     2004       2005    2006   2007   2008                      06M08 06M09
      Industrial Equipment   GTD    Domestic Use              Paints & Varnishes

 5      Q2 2009 Investor Presentation
Consistent and Profitable Growth
Gross Revenues (R$)                                                                                      EBITDA (R$)


                                                                                                                                                                                        1.026
                                                                                                 5.471


                                                                                                                                                                                  923
                                                                                         4.551
                                                                                                                      CAGR 22%
           CAGR 20%


                                                                                                                                                                            666
                                                                                 3.527
                                                                         2.978


                                                                                                                                                                      504
                                                                                                                                                                487
                                                                 2.603


                                                                                                                                                          435
                                                         2.015


                                                                                                                                                    327
                                                                                                                                              291
                                                 1.535
                                         1.269


                                                                                                                                        207
                                   963


                                                                                                                                  146
                                                                                                                            135
                             753


                                                                                                                      106
                       632
 430


       458


               574


                                                                                                          80

                                                                                                                84
1995 1996 1997 1998 1999 2000 2001 2002 2003 2004 2005 2006 2007 2008                                    1995 1996 1997 1998 1999 2000 2001 2002 2003 2004 2005 2006 2007 2008


Net Earnings (R$)                                                                        575             Return on Equity
                                                                                                 560


                                                                                                                                                                47%
                                                                                 503


                                                                                                                                                          44%
                                                                                                                                                    38%
                                                                                                                                              38%


                                                                                                                                                                                  37%
                                                                                                                                                                            37%
                                                                 403


             CAGR 25%
                                                                         379


                                                                                                                            33%


                                                                                                                                                                      33%
                                                                                                                                        31%


                                                                                                                                                                                        31%
                                                         308


                                                                                                                                  23%
                                                                                                                      22%
                                                 220


                                                                                                                16%
                                         176


                                                                                                          14%
                                   125
                      98

                             82
               58
       41
 31


1995 1996 1997 1998 1999 2000 2001 2002 2003 2004 2005 2006 2007 2008                                    1995 1996 1997 1998 1999 2000 2001 2002 2003 2004 2005 2006 2007 2008
       6             Q2 2009 Investor Presentation
Shareholding Structure


          Voigt                       Silva      Werninghaus      Controlling
         33.3%                       33.3%         33.3%         Shareholders


      Founders’                     WEG
       Families                 Participações    Management    Free Float
       (directly)               e Serviços S/A

     14.5%                      51.1%                  3.0%          31.4%


                                        WEG S.A.

 7   Q2 2009 Investor Presentation
Corporate Governance Practices
   Strong accountability and transparency culture
   Ingrained into Company’s core values, beliefs and mission
   Practices are “all that matter.” Formalization comes afterwards
   Early adopter of best practices formalizations and codes
   “Novo Mercado” conversion of PN shares at 1:1 ratio


   2001                 2002                  2003        2004            2005           2006            2007

Adhesion to          PN shares           Change of      Secondary      Creation of   Bylaws make      Adhesion to
 Bovespa’s          granted 80%         Independent   offering on PN    Investor     Fiscal Council    Bovespa’s
 “Nível 1”           Tag Along             Auditor       shares to      Relations      permanent         “Novo
 Corporate             rights                            increase      Department                      Mercado”
Governance                                                liquidity                                    Corporate
 Guidelines                                                                                           Governance


   8          Q2 2009 Investor Presentation
Uniquely Positioned
WEG is at the intersect of strong long-term trends


        Energy
         Energy                      Cleaner Energy
                                     Cleaner Energy
       efficiency
       efficiency                       Sources
                                         Sources


 9   Q2 2009 Investor Presentation
10
                                                         G
                                               lo            Sy Di
                                                  ba
                                                     l         ne ve
                                     Pr                          rg r s i
                                                                    is fie
                                                                      t
                                       es


Q2 2009 Investor Presentation
                                         en                      L i ic P d a
                                ce                                  ne r nd
                                                                          od
                                                                             uc
                                                                                t


                                                                                       In
                                                                                  no
                                                                             va
                                                                                            WEG is Uniquely Positioned


                                            Sc
                                     C
                                                             Te t i o
                                         u s ale               ch n
                                            to a                 no C a
                                              m nd                    lo p a
                                               iz                       gi b i
                                                  at
                                                    io
                                                                          ca l i t
                                                      n
                                                                            l ies
Diversified and Synergetic Offering
Product diversification increases competitiveness and added value…


                            From the client’s perspective


                   One Supplier,                       Several
                      Several         Client        Suppliers, one
                     Products                       product each


          One-stop shop (largest electric motor line from a single manufacturer)
          Strong worldwide after sales support (services and parts)
          Product integration in systems and solutions


 11   Q2 2009 Investor Presentation
Diversified and Synergetic Offering
                       …while reduces costs and diversify risks


                                 From WEG’s perspective
                                                        Several
                        Several                        Products,
                     Products, One                      Markets,
                      Salesperson                    Industries and
                                                        Clients


          Greater synergy and efficiency of sales effort
          Reduced risk exposure (product, segment and client)


 12   Q2 2009 Investor Presentation
Technological Innovation Capabilities
Technology advances at fast pace, with WEG at the forefront
   Consistent R&D spending                                                                        Partnerships with best
       2,5%
                2,3%
                                                            2,5%      2,4%
                                                                             2,3%
                                                                                                  engineering schools in Brazil
                       1,7%       1,6%
                                             1,8%
                                                                                      2,0%
                                                                                                  and in the world
                                                    1,5%                               89
                                                                             86
                                                                      73
                                                                                                  Technical Committee meets
                                                            63                                    semi-annually to review latest
                                                    34
                                                                                                  developments in electrical
                                             30
       16        18     18        21                                                              theory and applications
       1999     2000   2001      2002        2003   2004   2005       2006   2007     2008
                              R&D Spending           % Net Revenues


              More than 800 engineers developing products, such as Wmagnet

                                                                                    Innovative use of technology for general
                                                                                    purpose motors
                                                                                    Higher energy efficiency (lower consumption per
                                                    +                               output)
                                                                                    Lower working temperature and noise levels
                                                                                    Smaller size (lower material consumption)
  13          Q2 2009 Investor Presentation
Global Presence
Gross Revenues Breakdown (1S09)


                                                 11%

                                   10%          Europe


                              North America


                                                                       5%
                                              64%                 Asia & Oceania

                5%                                        5%

                                              Brazil     Africa
       South & Central America


  14      Q2 2009 Investor Presentation
Global Presence
External Markets Revenues (US$ M)                                            Production Facilities
                                                                             Service fast growing
                                                                             regional markets
                                                                             Mexico, Portugal, Argentina   1029
                                               Sales Subsidiaries            and China
                                             Own commercial and
                                             distribution structures in
                                             large and growing markets
                                              US, Chile, Colombia,
        Local Reps and                       Venezuela; England, France,
          Distributors                       Belgium, Germany, Italy,
       Develop market                        Spain, Sweden, Australia,
       knowledge                             India, Japan, Singapore,
                                             UAE and Russia
        Exports to more than 100                                           120
       countries: Canada, South
       Africa
                                            27


1980                                      1989                            1998                             2008
                                                                                                            2007
  15      Q2 2009 Investor Presentation
Unique Product Characteristics
Hours of Daily Use                                 12       16       24       24
                                                                                    Costs during useful life
Days of Monthly Use                                22       22       22       30
Nominal Power                    Hp               50,0     50,0     50,0     50,0
                                                                                                               97,0%
Nominal Power                    kilowatts        37,3     37,3     37,3     37,3
Energy Efficiency                %              92,5%    92,5%    92,5%    92,5%
Energy Consumption               Kilowatts        40,3     40,3     40,3     40,3
Monthly Use                      Hours            264      352      528      720
Monthly Energy Consumption       kW/h / month   10.641   14.188   21.283   29.022
Cost of Electricity              R$ / kW/h        0,15     0,15     0,15     0,15
Energy Operating Cost            R$ per Month    1.596    2.128    3.192    4.353
List Price                       R$              5.358    5.358    5.358    5.358     1,4%        1,6%
Price / Operating Cost Ratio     Months           3,36     2,52     1,68     1,23
                                                                                    Acquisition Maintenance     Energy
                                                                                                              Consuption


              Specifications must be exact. Everything affects energy efficiency

                      “Similar” motors are not economical, even if much cheaper

                            Becomes more evident when energy prices go up

              Returns on energy efficiency investments are very attractive
     16        Q2 2009 Investor Presentation
Scale and Customization
      Customization is characteristic of the industry and
      specifications are very diverse

      Largest integrated motor site in the world
                                                                            Integrated and synergetic production
                                                                            allows for large scale of production,
                                                                            with:
                                                                                   Lower costs
                                                                                   Higher operating efficiency
                                                                            Vertical integration allows for:
                                                                                   Customized products
         Main Manufacturing Plant in Jaraguá do Sul, SC
                                                                                   Fastest to the market

                            Incoming                      Foundry /
                             Orders                      Cast Machine
                                                                                         More than 2,500
                                         Engineering


                                                            Wires
                                                         Manufacturing      Assembly     different types
                                                                              Line          of electric
                                                          Steel Shop
                                                       Paints & Varnishes                motors monthly
                                                            Tooling


 17      Q2 2009 Investor Presentation
Second Quarter 2009 Highlights
                                              2T09           1T09        %         2T08          %
      Gross Operating Revenue                 1.250.193    1.270.984    -1,6%    1.331.012       -6,1%
       Domestic Market                           808.355     802.351      0,7%     924.701       -12,6%
       External Markets                          441.838     468.632     -5,7%     406.311         8,7%
       External Markets in US$                   213.396     202.726     5,3%      245.822      -13,2%
      Net Operating Revenue                   1.029.945    1.048.241    -1,7%    1.095.815       -6,0%
      Gross Operating Profit                    294.175      311.954    -5,7%      392.025      -25,0%
      Gross Margin                                28,6%        29,8%                 35,8%
      Quarterly Net Income                      129.670      122.193     6,1%      169.855      -23,7%
      Net Margin                                  12,6%        11,7%                 15,5%
      EBITDA                                    172.925      181.112    -4,5%      253.729      -31,8%
      EBITDA Margin                               16,8%        17,3%                 23,2%
                                                                                 Figures in R$ Thousands


                                          June 2009           December 2008      June 2008
      CASH & EQUIVALENT                     1.806.997           1.849.477          1.802.142
      DEBT                                  1.811.906           2.161.216          1.634.459
      - Current                              1.044.633          1.314.098           1.009.095
      - Long Term                              767.273            847.118             625.364
      NET CASH (DEBT)                           (4.909)          (311.739)           167.683


 18       Q2 2009 Investor Presentation
Main impacts from financial crisis
 Sales and Revenues                                 Costs and Expenses
Late 2008 / early 2009:                            Late 2008 / early 2009:
   Demand weakness in all segments, but at            Costs suffered from
   different intensities                                   Further price increases for some
         Domestic use: swift slowdown                      materials (late 2008)
         Industrial use: took a while, but dales           Weak demand prevents pass-
         decrease was unprecedented around                 through of FX and higher costs
         turn of year                                      Lower occupancy affects productivity
         Energy: focus on backlog stability                and economies of scale
         and client credit                            Logistic difficulties with heavy rains /
Mid 2009:                                             flooding impacted expenses
         Domestic use: responding to tax           Mid 2009:
         incentives
                                                      Working out the impacts of higher costs
         Industrial use: no end of destocking         under a weak demand environment
         in sight
                                                      Low occupancy continues to be a
         Energy: slower order intake
         (“consuming” backlog)                        concern. Labor agreement to reduce
                                                      working hours and wages.


    19    Q2 2009 Investor Presentation
Profitability
Net Earnings (R$ million)                                                EBITDA (R$ million)
                                                                                                 25%
                                                                         23%                            23%          23%
                                                                               22%         22%
                                                                                                        1026
                                                                                     20%
                                                                                                 923                         17%
      18% 18%
                        17%
                    15%    15%
                                                       15%
                             12%                                                           666
                                  575        560              12%
                           503                                                 487 504
                                                                                                                     457
              403 375                                                    394
                                                                                                                             354
       308                                             296
                                                              252
                                                     08

                                                            09
  03

         04

                 05

                        06

                               07

                                      08


                                                                                                                    08

                                                                                                                          09
                                                                                 05

                                                                                       06

                                                                                              07

                                                                                                    08
                                                                     03

                                                                           04
                                                   M

                                                          M
 20

       20

               20

                      20

                             20

                                    20


                                                                                                                M

                                                                                                                         M
                                                                                20

                                                                                      20

                                                                                            20

                                                                                                   20
                                                                    20

                                                                          20
                                                06

                                                       06


                                                                                                               06

                                                                                                                     06
             Net Income                      Net Margin                              EBITDA        EBITDA Margin
  20         Q2 2009 Investor Presentation
Scenario and Assumptions

 There is no predicting how long or deep                          Renewed focus on
 the downturn will be                                                ROIC under
                                             Working hours and      conservative
      No indication of a quick recovery       wage reduction        assumptions
      around the corner                         agreement
                                                                      Reviewing all
      Slowdown severe for the serial, less     Hiring freeze       processes for cost
      customized part of the product line                         cutting and expense
                                                                        reduction
 Despite some good signals
      Material costs declining
      Destocking seems to be slowing            Workforce
                                                Rightsizing           Continuous
 Must plan and act under the following                               Improvement
 assumptions:                                    Production            Program
      Fairly long recession                    Consolidation            (PMC)
                                              (closing 1 plant)
      Followed by a slow recovery


 21     Q2 2009 Investor Presentation
Continuous Improvement Program


Before 1968 Olympics, high jump record 1,73m


    Non linear
    improvement

                                               1968 Olympics, the “Fosbury Flop” high jump record 2,24m


    22    Q2 2009 Investor Presentation
Capacity Expansion Program
Capex and Depreciation (R$ million)
                                                                        457


              Capex
              Depreciation                                  306


                 206                                                          206

                                       146                        157               156
 126
                                                  111 105
                                             96                                           97
       56                 67


   2003            2004                 2005       2006      2007        2008       06M9
  23   Q2 2009 Investor Presentation
Dividend Pay-out Policy
Net Earnings and Dividends (R$ million)                                                                          54%         53%
                                                                                                     52%

                                                                                         45%
                                                                 43%         44%
                                             40%     40%
                                39%
                   37%                                                                              575         560
       35%
                                                                                        503

                                                                403
                                                                            375
                                                    308                                                   299         301
                                                                                                                            252
                                         220                                                  229
                             176                                      173         165
                 125                                      124                                                                     133
   82 29                                       89
                       46          68

   1999 2000 2001 2002 2003 2004 2005 2006 2007 2008 6M09
                                        Net Earnings             Dividends               Pay-out (%)
  24         Q2 2009 Investor Presentation
Contacts
                                      www.weg.net/ir
      Alidor Lueders
       CFO & IRO
       alidor@weg.net

      Luís Fernando M. Oliveira
      Investor Relations Manager
      +55 (47) 3276-6973
      luisfernando@weg.net            twitter.com/weg_ir
      ri@weg.net
      MSN Messenger
      luisfernando@weg.com.br


 25   Q2 2009 Investor Presentation

More Related Content

What's hot

GE-Credit Suisse Conference: Rebuilding the Economy: Brick by Brick, Bridge b...
GE-Credit Suisse Conference: Rebuilding the Economy: Brick by Brick, Bridge b...GE-Credit Suisse Conference: Rebuilding the Economy: Brick by Brick, Bridge b...
GE-Credit Suisse Conference: Rebuilding the Economy: Brick by Brick, Bridge b...Manya Mohan
 
3 q11 presentation
3 q11 presentation3 q11 presentation
3 q11 presentationbrproperties
 
2012년 hci 실적_발표자료_eng
2012년 hci 실적_발표자료_eng2012년 hci 실적_발표자료_eng
2012년 hci 실적_발표자료_engHyundai Finance
 
Sunoco Analyst Meeting Monday, December 15, 2008 8:30 a.m. ET
Sunoco Analyst Meeting Monday, December 15, 2008 8:30 a.m. ETSunoco Analyst Meeting Monday, December 15, 2008 8:30 a.m. ET
Sunoco Analyst Meeting Monday, December 15, 2008 8:30 a.m. ETfinance6
 
3rd Quarter 2008 Results
3rd Quarter 2008 Results3rd Quarter 2008 Results
3rd Quarter 2008 ResultsAES Eletropaulo
 
pepco WallStBerensonFINAL
pepco WallStBerensonFINALpepco WallStBerensonFINAL
pepco WallStBerensonFINALfinance41
 
Rodman & Renshaw Report May 2011 - NAPCO Security Technologies (Nasdaq: NSSC;...
Rodman & Renshaw Report May 2011 - NAPCO Security Technologies (Nasdaq: NSSC;...Rodman & Renshaw Report May 2011 - NAPCO Security Technologies (Nasdaq: NSSC;...
Rodman & Renshaw Report May 2011 - NAPCO Security Technologies (Nasdaq: NSSC;...ProActive Capital Resources Group
 
Q1 2009 Earning Report of Affiliated Computer Services
Q1 2009 Earning Report of Affiliated Computer Services Q1 2009 Earning Report of Affiliated Computer Services
Q1 2009 Earning Report of Affiliated Computer Services earningreport earningreport
 
air products & chemicals 2007 Sep18 BofA
air products & chemicals 2007 Sep18 BofAair products & chemicals 2007 Sep18 BofA
air products & chemicals 2007 Sep18 BofAfinance26
 
PEG_Boston Investor Meeting
PEG_Boston Investor MeetingPEG_Boston Investor Meeting
PEG_Boston Investor Meetingfinance20
 
FY 2010 Results & Plan Update - M. Patuano
FY 2010 Results & Plan Update - M. Patuano FY 2010 Results & Plan Update - M. Patuano
FY 2010 Results & Plan Update - M. Patuano Gruppo TIM
 
northrop grumman Slide Presentation 2008 1st
northrop grumman Slide Presentation 2008 1stnorthrop grumman Slide Presentation 2008 1st
northrop grumman Slide Presentation 2008 1stfinance8
 
Bank of America Merrill Lynch 2012 Global Metals, Mining & Steel Conference
Bank of America Merrill Lynch 2012 Global Metals, Mining & Steel ConferenceBank of America Merrill Lynch 2012 Global Metals, Mining & Steel Conference
Bank of America Merrill Lynch 2012 Global Metals, Mining & Steel ConferenceAnglo American
 

What's hot (18)

GE-Credit Suisse Conference: Rebuilding the Economy: Brick by Brick, Bridge b...
GE-Credit Suisse Conference: Rebuilding the Economy: Brick by Brick, Bridge b...GE-Credit Suisse Conference: Rebuilding the Economy: Brick by Brick, Bridge b...
GE-Credit Suisse Conference: Rebuilding the Economy: Brick by Brick, Bridge b...
 
3 q11 presentation
3 q11 presentation3 q11 presentation
3 q11 presentation
 
Chicagoland Investors Expo | 3.2.2013
Chicagoland Investors Expo | 3.2.2013Chicagoland Investors Expo | 3.2.2013
Chicagoland Investors Expo | 3.2.2013
 
4Q11 Earnings Release Presentation
4Q11 Earnings Release Presentation 4Q11 Earnings Release Presentation
4Q11 Earnings Release Presentation
 
2012년 hci 실적_발표자료_eng
2012년 hci 실적_발표자료_eng2012년 hci 실적_발표자료_eng
2012년 hci 실적_발표자료_eng
 
Sunoco Analyst Meeting Monday, December 15, 2008 8:30 a.m. ET
Sunoco Analyst Meeting Monday, December 15, 2008 8:30 a.m. ETSunoco Analyst Meeting Monday, December 15, 2008 8:30 a.m. ET
Sunoco Analyst Meeting Monday, December 15, 2008 8:30 a.m. ET
 
3rd Quarter 2008 Results
3rd Quarter 2008 Results3rd Quarter 2008 Results
3rd Quarter 2008 Results
 
pepco WallStBerensonFINAL
pepco WallStBerensonFINALpepco WallStBerensonFINAL
pepco WallStBerensonFINAL
 
EDP Energias do Brasil Presentation
EDP Energias do Brasil PresentationEDP Energias do Brasil Presentation
EDP Energias do Brasil Presentation
 
Rodman & Renshaw Report May 2011 - NAPCO Security Technologies (Nasdaq: NSSC;...
Rodman & Renshaw Report May 2011 - NAPCO Security Technologies (Nasdaq: NSSC;...Rodman & Renshaw Report May 2011 - NAPCO Security Technologies (Nasdaq: NSSC;...
Rodman & Renshaw Report May 2011 - NAPCO Security Technologies (Nasdaq: NSSC;...
 
Ppa Overview Tioga Energy 2009 04 13 2 Ppa 1
Ppa Overview Tioga Energy 2009 04 13 2 Ppa 1Ppa Overview Tioga Energy 2009 04 13 2 Ppa 1
Ppa Overview Tioga Energy 2009 04 13 2 Ppa 1
 
Q1 2009 Earning Report of Tyco Electronics Ltd.
Q1 2009 Earning Report of Tyco Electronics Ltd.Q1 2009 Earning Report of Tyco Electronics Ltd.
Q1 2009 Earning Report of Tyco Electronics Ltd.
 
Q1 2009 Earning Report of Affiliated Computer Services
Q1 2009 Earning Report of Affiliated Computer Services Q1 2009 Earning Report of Affiliated Computer Services
Q1 2009 Earning Report of Affiliated Computer Services
 
air products & chemicals 2007 Sep18 BofA
air products & chemicals 2007 Sep18 BofAair products & chemicals 2007 Sep18 BofA
air products & chemicals 2007 Sep18 BofA
 
PEG_Boston Investor Meeting
PEG_Boston Investor MeetingPEG_Boston Investor Meeting
PEG_Boston Investor Meeting
 
FY 2010 Results & Plan Update - M. Patuano
FY 2010 Results & Plan Update - M. Patuano FY 2010 Results & Plan Update - M. Patuano
FY 2010 Results & Plan Update - M. Patuano
 
northrop grumman Slide Presentation 2008 1st
northrop grumman Slide Presentation 2008 1stnorthrop grumman Slide Presentation 2008 1st
northrop grumman Slide Presentation 2008 1st
 
Bank of America Merrill Lynch 2012 Global Metals, Mining & Steel Conference
Bank of America Merrill Lynch 2012 Global Metals, Mining & Steel ConferenceBank of America Merrill Lynch 2012 Global Metals, Mining & Steel Conference
Bank of America Merrill Lynch 2012 Global Metals, Mining & Steel Conference
 

Similar to 2Q09 Investor Presentation

CS Conference 2012
CS Conference 2012CS Conference 2012
CS Conference 2012WEG
 
Goldman Sachs Conference London
Goldman Sachs Conference LondonGoldman Sachs Conference London
Goldman Sachs Conference LondonWEG
 
air products & chemicals 2008 May 21 Goldman Sachs
air products & chemicals 2008 May 21 Goldman Sachsair products & chemicals 2008 May 21 Goldman Sachs
air products & chemicals 2008 May 21 Goldman Sachsfinance26
 
air products & chemicals 2008 June3 JPMorgan
air products & chemicals 2008 June3 JPMorganair products & chemicals 2008 June3 JPMorgan
air products & chemicals 2008 June3 JPMorganfinance26
 
HMS Group presentation, Morgan Stanley EMEA Conference (April 2011)
HMS Group presentation, Morgan Stanley EMEA Conference (April 2011)HMS Group presentation, Morgan Stanley EMEA Conference (April 2011)
HMS Group presentation, Morgan Stanley EMEA Conference (April 2011)HMS Group
 
18.03.2009 Presentation of E&P Coordinator, Eduardo Alessandro Molinari - P...
18.03.2009   Presentation of E&P Coordinator, Eduardo Alessandro Molinari - P...18.03.2009   Presentation of E&P Coordinator, Eduardo Alessandro Molinari - P...
18.03.2009 Presentation of E&P Coordinator, Eduardo Alessandro Molinari - P...Petrobras
 
caterpillar Bank of America Securities Annual Investment Conference
caterpillar Bank of America Securities Annual Investment Conferencecaterpillar Bank of America Securities Annual Investment Conference
caterpillar Bank of America Securities Annual Investment Conferencefinance5
 
Chemical Supply Chain
Chemical Supply ChainChemical Supply Chain
Chemical Supply ChainNatashaS7
 
air products & chemicals 2008 Feb11 Lehman
air products & chemicals 2008 Feb11 Lehmanair products & chemicals 2008 Feb11 Lehman
air products & chemicals 2008 Feb11 Lehmanfinance26
 
3Q 2011 Results Conference Call
3Q 2011 Results Conference Call 3Q 2011 Results Conference Call
3Q 2011 Results Conference Call WEG
 
arvinmeritor ETSALE07
arvinmeritor ETSALE07arvinmeritor ETSALE07
arvinmeritor ETSALE07finance27
 
arvinmeritor ETSALE07
arvinmeritor ETSALE07arvinmeritor ETSALE07
arvinmeritor ETSALE07finance27
 
energy future holindings 080205
energy future holindings 080205energy future holindings 080205
energy future holindings 080205finance29
 
energy future holindings _080205
energy future holindings _080205energy future holindings _080205
energy future holindings _080205finance29
 
Cummins_06/09/12
Cummins_06/09/12Cummins_06/09/12
Cummins_06/09/12finance21
 
Cummins_06/09/12
Cummins_06/09/12Cummins_06/09/12
Cummins_06/09/12finance21
 
2Q2007 EARNINGS SLIDES
2Q2007 EARNINGS SLIDES2Q2007 EARNINGS SLIDES
2Q2007 EARNINGS SLIDESfinance22
 
cummins 2002arb
cummins  2002arbcummins  2002arb
cummins 2002arbfinance21
 
cummins 2002arb
cummins  2002arbcummins  2002arb
cummins 2002arbfinance21
 

Similar to 2Q09 Investor Presentation (20)

CS Conference 2012
CS Conference 2012CS Conference 2012
CS Conference 2012
 
Goldman Sachs Conference London
Goldman Sachs Conference LondonGoldman Sachs Conference London
Goldman Sachs Conference London
 
air products & chemicals 2008 May 21 Goldman Sachs
air products & chemicals 2008 May 21 Goldman Sachsair products & chemicals 2008 May 21 Goldman Sachs
air products & chemicals 2008 May 21 Goldman Sachs
 
air products & chemicals 2008 June3 JPMorgan
air products & chemicals 2008 June3 JPMorganair products & chemicals 2008 June3 JPMorgan
air products & chemicals 2008 June3 JPMorgan
 
2Q09 Results
2Q09 Results2Q09 Results
2Q09 Results
 
HMS Group presentation, Morgan Stanley EMEA Conference (April 2011)
HMS Group presentation, Morgan Stanley EMEA Conference (April 2011)HMS Group presentation, Morgan Stanley EMEA Conference (April 2011)
HMS Group presentation, Morgan Stanley EMEA Conference (April 2011)
 
18.03.2009 Presentation of E&P Coordinator, Eduardo Alessandro Molinari - P...
18.03.2009   Presentation of E&P Coordinator, Eduardo Alessandro Molinari - P...18.03.2009   Presentation of E&P Coordinator, Eduardo Alessandro Molinari - P...
18.03.2009 Presentation of E&P Coordinator, Eduardo Alessandro Molinari - P...
 
caterpillar Bank of America Securities Annual Investment Conference
caterpillar Bank of America Securities Annual Investment Conferencecaterpillar Bank of America Securities Annual Investment Conference
caterpillar Bank of America Securities Annual Investment Conference
 
Chemical Supply Chain
Chemical Supply ChainChemical Supply Chain
Chemical Supply Chain
 
air products & chemicals 2008 Feb11 Lehman
air products & chemicals 2008 Feb11 Lehmanair products & chemicals 2008 Feb11 Lehman
air products & chemicals 2008 Feb11 Lehman
 
3Q 2011 Results Conference Call
3Q 2011 Results Conference Call 3Q 2011 Results Conference Call
3Q 2011 Results Conference Call
 
arvinmeritor ETSALE07
arvinmeritor ETSALE07arvinmeritor ETSALE07
arvinmeritor ETSALE07
 
arvinmeritor ETSALE07
arvinmeritor ETSALE07arvinmeritor ETSALE07
arvinmeritor ETSALE07
 
energy future holindings 080205
energy future holindings 080205energy future holindings 080205
energy future holindings 080205
 
energy future holindings _080205
energy future holindings _080205energy future holindings _080205
energy future holindings _080205
 
Cummins_06/09/12
Cummins_06/09/12Cummins_06/09/12
Cummins_06/09/12
 
Cummins_06/09/12
Cummins_06/09/12Cummins_06/09/12
Cummins_06/09/12
 
2Q2007 EARNINGS SLIDES
2Q2007 EARNINGS SLIDES2Q2007 EARNINGS SLIDES
2Q2007 EARNINGS SLIDES
 
cummins 2002arb
cummins  2002arbcummins  2002arb
cummins 2002arb
 
cummins 2002arb
cummins  2002arbcummins  2002arb
cummins 2002arb
 

More from WEG

WEG Q3 2016 INVESTOR PRESENTATION
WEG Q3 2016 INVESTOR PRESENTATIONWEG Q3 2016 INVESTOR PRESENTATION
WEG Q3 2016 INVESTOR PRESENTATIONWEG
 
2014 07 24 2T14 Conference Call
2014 07 24 2T14 Conference Call2014 07 24 2T14 Conference Call
2014 07 24 2T14 Conference CallWEG
 
2014 04 25 1T14 Conference Call
2014 04 25 1T14 Conference Call2014 04 25 1T14 Conference Call
2014 04 25 1T14 Conference CallWEG
 
2014 02 27 4T13 Conference Call
2014 02 27 4T13 Conference Call2014 02 27 4T13 Conference Call
2014 02 27 4T13 Conference CallWEG
 
Apresentação para Investidores Julho 2014
Apresentação para Investidores Julho 2014Apresentação para Investidores Julho 2014
Apresentação para Investidores Julho 2014WEG
 
Q1 2014 Investor Presentation
Q1 2014 Investor PresentationQ1 2014 Investor Presentation
Q1 2014 Investor PresentationWEG
 
Q1 2014 Investor Presentation
Q1 2014 Investor PresentationQ1 2014 Investor Presentation
Q1 2014 Investor PresentationWEG
 
WEG Q3 2013 Conference Call
WEG Q3 2013 Conference CallWEG Q3 2013 Conference Call
WEG Q3 2013 Conference CallWEG
 
WEG 3T13 Apresentação de Resultados
WEG 3T13 Apresentação de ResultadosWEG 3T13 Apresentação de Resultados
WEG 3T13 Apresentação de ResultadosWEG
 
WEG 2T13 Apresentação de Resultados
WEG 2T13 Apresentação de ResultadosWEG 2T13 Apresentação de Resultados
WEG 2T13 Apresentação de ResultadosWEG
 
WEG Q2 2013 Conference Call
WEG Q2 2013 Conference CallWEG Q2 2013 Conference Call
WEG Q2 2013 Conference CallWEG
 
WEG 1T13 Apresentação de Resultados
WEG 1T13 Apresentação de ResultadosWEG 1T13 Apresentação de Resultados
WEG 1T13 Apresentação de ResultadosWEG
 
WEG Q1 2013 Conference Call
WEG Q1 2013 Conference CallWEG Q1 2013 Conference Call
WEG Q1 2013 Conference CallWEG
 
WEG Q4 2012 Conference Call
WEG Q4 2012 Conference CallWEG Q4 2012 Conference Call
WEG Q4 2012 Conference CallWEG
 
WEG 4T12 Apresentação de Resultados
WEG 4T12 Apresentação de ResultadosWEG 4T12 Apresentação de Resultados
WEG 4T12 Apresentação de ResultadosWEG
 
WEG Q2 2012 Conference Call
WEG Q2 2012 Conference CallWEG Q2 2012 Conference Call
WEG Q2 2012 Conference CallWEG
 
WEG 2T12 Apresentação de Resultados
WEG 2T12 Apresentação de ResultadosWEG 2T12 Apresentação de Resultados
WEG 2T12 Apresentação de ResultadosWEG
 
WEG Q3 2012 Conference Call
WEG Q3 2012 Conference CallWEG Q3 2012 Conference Call
WEG Q3 2012 Conference CallWEG
 
WEG 3T12 Apresentação de Resultados
WEG 3T12 Apresentação de ResultadosWEG 3T12 Apresentação de Resultados
WEG 3T12 Apresentação de ResultadosWEG
 
WEG 1T12 Apresentação de Resultados
WEG 1T12 Apresentação de ResultadosWEG 1T12 Apresentação de Resultados
WEG 1T12 Apresentação de ResultadosWEG
 

More from WEG (20)

WEG Q3 2016 INVESTOR PRESENTATION
WEG Q3 2016 INVESTOR PRESENTATIONWEG Q3 2016 INVESTOR PRESENTATION
WEG Q3 2016 INVESTOR PRESENTATION
 
2014 07 24 2T14 Conference Call
2014 07 24 2T14 Conference Call2014 07 24 2T14 Conference Call
2014 07 24 2T14 Conference Call
 
2014 04 25 1T14 Conference Call
2014 04 25 1T14 Conference Call2014 04 25 1T14 Conference Call
2014 04 25 1T14 Conference Call
 
2014 02 27 4T13 Conference Call
2014 02 27 4T13 Conference Call2014 02 27 4T13 Conference Call
2014 02 27 4T13 Conference Call
 
Apresentação para Investidores Julho 2014
Apresentação para Investidores Julho 2014Apresentação para Investidores Julho 2014
Apresentação para Investidores Julho 2014
 
Q1 2014 Investor Presentation
Q1 2014 Investor PresentationQ1 2014 Investor Presentation
Q1 2014 Investor Presentation
 
Q1 2014 Investor Presentation
Q1 2014 Investor PresentationQ1 2014 Investor Presentation
Q1 2014 Investor Presentation
 
WEG Q3 2013 Conference Call
WEG Q3 2013 Conference CallWEG Q3 2013 Conference Call
WEG Q3 2013 Conference Call
 
WEG 3T13 Apresentação de Resultados
WEG 3T13 Apresentação de ResultadosWEG 3T13 Apresentação de Resultados
WEG 3T13 Apresentação de Resultados
 
WEG 2T13 Apresentação de Resultados
WEG 2T13 Apresentação de ResultadosWEG 2T13 Apresentação de Resultados
WEG 2T13 Apresentação de Resultados
 
WEG Q2 2013 Conference Call
WEG Q2 2013 Conference CallWEG Q2 2013 Conference Call
WEG Q2 2013 Conference Call
 
WEG 1T13 Apresentação de Resultados
WEG 1T13 Apresentação de ResultadosWEG 1T13 Apresentação de Resultados
WEG 1T13 Apresentação de Resultados
 
WEG Q1 2013 Conference Call
WEG Q1 2013 Conference CallWEG Q1 2013 Conference Call
WEG Q1 2013 Conference Call
 
WEG Q4 2012 Conference Call
WEG Q4 2012 Conference CallWEG Q4 2012 Conference Call
WEG Q4 2012 Conference Call
 
WEG 4T12 Apresentação de Resultados
WEG 4T12 Apresentação de ResultadosWEG 4T12 Apresentação de Resultados
WEG 4T12 Apresentação de Resultados
 
WEG Q2 2012 Conference Call
WEG Q2 2012 Conference CallWEG Q2 2012 Conference Call
WEG Q2 2012 Conference Call
 
WEG 2T12 Apresentação de Resultados
WEG 2T12 Apresentação de ResultadosWEG 2T12 Apresentação de Resultados
WEG 2T12 Apresentação de Resultados
 
WEG Q3 2012 Conference Call
WEG Q3 2012 Conference CallWEG Q3 2012 Conference Call
WEG Q3 2012 Conference Call
 
WEG 3T12 Apresentação de Resultados
WEG 3T12 Apresentação de ResultadosWEG 3T12 Apresentação de Resultados
WEG 3T12 Apresentação de Resultados
 
WEG 1T12 Apresentação de Resultados
WEG 1T12 Apresentação de ResultadosWEG 1T12 Apresentação de Resultados
WEG 1T12 Apresentação de Resultados
 

Recently uploaded

Call Girls In Amritsar 💯Call Us 🔝 76967 34778🔝 💃 Independent Escort In Amritsar
Call Girls In Amritsar 💯Call Us 🔝 76967 34778🔝 💃 Independent Escort In AmritsarCall Girls In Amritsar 💯Call Us 🔝 76967 34778🔝 💃 Independent Escort In Amritsar
Call Girls In Amritsar 💯Call Us 🔝 76967 34778🔝 💃 Independent Escort In Amritsaronly4webmaster01
 
CALL ON ➥8923113531 🔝Call Girls Vineet Khand Lucknow best Night Fun service 🧦
CALL ON ➥8923113531 🔝Call Girls Vineet Khand Lucknow best Night Fun service  🧦CALL ON ➥8923113531 🔝Call Girls Vineet Khand Lucknow best Night Fun service  🧦
CALL ON ➥8923113531 🔝Call Girls Vineet Khand Lucknow best Night Fun service 🧦anilsa9823
 
slideshare Call girls Noida Escorts 9999965857 henakhan
slideshare Call girls Noida Escorts 9999965857 henakhanslideshare Call girls Noida Escorts 9999965857 henakhan
slideshare Call girls Noida Escorts 9999965857 henakhanhanshkumar9870
 
VIP 7001035870 Find & Meet Hyderabad Call Girls Miyapur high-profile Call Girl
VIP 7001035870 Find & Meet Hyderabad Call Girls Miyapur high-profile Call GirlVIP 7001035870 Find & Meet Hyderabad Call Girls Miyapur high-profile Call Girl
VIP 7001035870 Find & Meet Hyderabad Call Girls Miyapur high-profile Call Girladitipandeya
 
Short-, Mid-, and Long-term gxxoals.pptx
Short-, Mid-, and Long-term gxxoals.pptxShort-, Mid-, and Long-term gxxoals.pptx
Short-, Mid-, and Long-term gxxoals.pptxHenryBriggs2
 
VIP Amritsar Call Girl 7001035870 Enjoy Call Girls With Our Escorts
VIP Amritsar Call Girl 7001035870 Enjoy Call Girls With Our EscortsVIP Amritsar Call Girl 7001035870 Enjoy Call Girls With Our Escorts
VIP Amritsar Call Girl 7001035870 Enjoy Call Girls With Our Escortssonatiwari757
 
Call Girl Kolkata Sia 🤌 8250192130 🚀 Vip Call Girls Kolkata
Call Girl Kolkata Sia 🤌  8250192130 🚀 Vip Call Girls KolkataCall Girl Kolkata Sia 🤌  8250192130 🚀 Vip Call Girls Kolkata
Call Girl Kolkata Sia 🤌 8250192130 🚀 Vip Call Girls Kolkataanamikaraghav4
 
VIP 7001035870 Find & Meet Hyderabad Call Girls Shamshabad high-profile Call ...
VIP 7001035870 Find & Meet Hyderabad Call Girls Shamshabad high-profile Call ...VIP 7001035870 Find & Meet Hyderabad Call Girls Shamshabad high-profile Call ...
VIP 7001035870 Find & Meet Hyderabad Call Girls Shamshabad high-profile Call ...aditipandeya
 
Methanex Investor Presentation (April 2024)
Methanex Investor Presentation (April 2024)Methanex Investor Presentation (April 2024)
Methanex Investor Presentation (April 2024)Methanex Corporation
 
VIP Kolkata Call Girl Rishra 👉 8250192130 Available With Room
VIP Kolkata Call Girl Rishra 👉 8250192130  Available With RoomVIP Kolkata Call Girl Rishra 👉 8250192130  Available With Room
VIP Kolkata Call Girl Rishra 👉 8250192130 Available With Roomdivyansh0kumar0
 
Call Girls in Friends Colony 9711199171 Delhi Enjoy Call Girls With Our Escorts
Call Girls in Friends Colony 9711199171 Delhi Enjoy Call Girls With Our EscortsCall Girls in Friends Colony 9711199171 Delhi Enjoy Call Girls With Our Escorts
Call Girls in Friends Colony 9711199171 Delhi Enjoy Call Girls With Our Escortsindian call girls near you
 
Malad Escorts, (Pooja 09892124323), Malad Call Girls Service
Malad Escorts, (Pooja 09892124323), Malad Call Girls ServiceMalad Escorts, (Pooja 09892124323), Malad Call Girls Service
Malad Escorts, (Pooja 09892124323), Malad Call Girls ServicePooja Nehwal
 
VIP Kolkata Call Girl Entally 👉 8250192130 Available With Room
VIP Kolkata Call Girl Entally 👉 8250192130  Available With RoomVIP Kolkata Call Girl Entally 👉 8250192130  Available With Room
VIP Kolkata Call Girl Entally 👉 8250192130 Available With Roomdivyansh0kumar0
 
High Profile Call Girls Kolkata Gayatri 🤌 8250192130 🚀 Vip Call Girls Kolkata
High Profile Call Girls Kolkata Gayatri 🤌  8250192130 🚀 Vip Call Girls KolkataHigh Profile Call Girls Kolkata Gayatri 🤌  8250192130 🚀 Vip Call Girls Kolkata
High Profile Call Girls Kolkata Gayatri 🤌 8250192130 🚀 Vip Call Girls Kolkataanamikaraghav4
 
Teck Investor Presentation, April 24, 2024
Teck Investor Presentation, April 24, 2024Teck Investor Presentation, April 24, 2024
Teck Investor Presentation, April 24, 2024TeckResourcesLtd
 
Cyberagent_For New Investors_EN_240424.pdf
Cyberagent_For New Investors_EN_240424.pdfCyberagent_For New Investors_EN_240424.pdf
Cyberagent_For New Investors_EN_240424.pdfCyberAgent, Inc.
 

Recently uploaded (20)

Call Girls In Amritsar 💯Call Us 🔝 76967 34778🔝 💃 Independent Escort In Amritsar
Call Girls In Amritsar 💯Call Us 🔝 76967 34778🔝 💃 Independent Escort In AmritsarCall Girls In Amritsar 💯Call Us 🔝 76967 34778🔝 💃 Independent Escort In Amritsar
Call Girls In Amritsar 💯Call Us 🔝 76967 34778🔝 💃 Independent Escort In Amritsar
 
CALL ON ➥8923113531 🔝Call Girls Vineet Khand Lucknow best Night Fun service 🧦
CALL ON ➥8923113531 🔝Call Girls Vineet Khand Lucknow best Night Fun service  🧦CALL ON ➥8923113531 🔝Call Girls Vineet Khand Lucknow best Night Fun service  🧦
CALL ON ➥8923113531 🔝Call Girls Vineet Khand Lucknow best Night Fun service 🧦
 
slideshare Call girls Noida Escorts 9999965857 henakhan
slideshare Call girls Noida Escorts 9999965857 henakhanslideshare Call girls Noida Escorts 9999965857 henakhan
slideshare Call girls Noida Escorts 9999965857 henakhan
 
VIP 7001035870 Find & Meet Hyderabad Call Girls Miyapur high-profile Call Girl
VIP 7001035870 Find & Meet Hyderabad Call Girls Miyapur high-profile Call GirlVIP 7001035870 Find & Meet Hyderabad Call Girls Miyapur high-profile Call Girl
VIP 7001035870 Find & Meet Hyderabad Call Girls Miyapur high-profile Call Girl
 
Escort Service Call Girls In Shalimar Bagh, 99530°56974 Delhi NCR
Escort Service Call Girls In Shalimar Bagh, 99530°56974 Delhi NCREscort Service Call Girls In Shalimar Bagh, 99530°56974 Delhi NCR
Escort Service Call Girls In Shalimar Bagh, 99530°56974 Delhi NCR
 
Short-, Mid-, and Long-term gxxoals.pptx
Short-, Mid-, and Long-term gxxoals.pptxShort-, Mid-, and Long-term gxxoals.pptx
Short-, Mid-, and Long-term gxxoals.pptx
 
VIP Amritsar Call Girl 7001035870 Enjoy Call Girls With Our Escorts
VIP Amritsar Call Girl 7001035870 Enjoy Call Girls With Our EscortsVIP Amritsar Call Girl 7001035870 Enjoy Call Girls With Our Escorts
VIP Amritsar Call Girl 7001035870 Enjoy Call Girls With Our Escorts
 
Call Girl Kolkata Sia 🤌 8250192130 🚀 Vip Call Girls Kolkata
Call Girl Kolkata Sia 🤌  8250192130 🚀 Vip Call Girls KolkataCall Girl Kolkata Sia 🤌  8250192130 🚀 Vip Call Girls Kolkata
Call Girl Kolkata Sia 🤌 8250192130 🚀 Vip Call Girls Kolkata
 
VIP 7001035870 Find & Meet Hyderabad Call Girls Shamshabad high-profile Call ...
VIP 7001035870 Find & Meet Hyderabad Call Girls Shamshabad high-profile Call ...VIP 7001035870 Find & Meet Hyderabad Call Girls Shamshabad high-profile Call ...
VIP 7001035870 Find & Meet Hyderabad Call Girls Shamshabad high-profile Call ...
 
Call Girls 🫤 Nehru Place ➡️ 9999965857 ➡️ Delhi 🫦 Russian Escorts FULL ENJOY
Call Girls 🫤 Nehru Place ➡️ 9999965857  ➡️ Delhi 🫦  Russian Escorts FULL ENJOYCall Girls 🫤 Nehru Place ➡️ 9999965857  ➡️ Delhi 🫦  Russian Escorts FULL ENJOY
Call Girls 🫤 Nehru Place ➡️ 9999965857 ➡️ Delhi 🫦 Russian Escorts FULL ENJOY
 
Methanex Investor Presentation (April 2024)
Methanex Investor Presentation (April 2024)Methanex Investor Presentation (April 2024)
Methanex Investor Presentation (April 2024)
 
VIP Kolkata Call Girl Rishra 👉 8250192130 Available With Room
VIP Kolkata Call Girl Rishra 👉 8250192130  Available With RoomVIP Kolkata Call Girl Rishra 👉 8250192130  Available With Room
VIP Kolkata Call Girl Rishra 👉 8250192130 Available With Room
 
Call Girls in Friends Colony 9711199171 Delhi Enjoy Call Girls With Our Escorts
Call Girls in Friends Colony 9711199171 Delhi Enjoy Call Girls With Our EscortsCall Girls in Friends Colony 9711199171 Delhi Enjoy Call Girls With Our Escorts
Call Girls in Friends Colony 9711199171 Delhi Enjoy Call Girls With Our Escorts
 
Malad Escorts, (Pooja 09892124323), Malad Call Girls Service
Malad Escorts, (Pooja 09892124323), Malad Call Girls ServiceMalad Escorts, (Pooja 09892124323), Malad Call Girls Service
Malad Escorts, (Pooja 09892124323), Malad Call Girls Service
 
@9999965857 🫦 Sexy Desi Call Girls Karol Bagh 💓 High Profile Escorts Delhi 🫶
@9999965857 🫦 Sexy Desi Call Girls Karol Bagh 💓 High Profile Escorts Delhi 🫶@9999965857 🫦 Sexy Desi Call Girls Karol Bagh 💓 High Profile Escorts Delhi 🫶
@9999965857 🫦 Sexy Desi Call Girls Karol Bagh 💓 High Profile Escorts Delhi 🫶
 
VIP Kolkata Call Girl Entally 👉 8250192130 Available With Room
VIP Kolkata Call Girl Entally 👉 8250192130  Available With RoomVIP Kolkata Call Girl Entally 👉 8250192130  Available With Room
VIP Kolkata Call Girl Entally 👉 8250192130 Available With Room
 
High Profile Call Girls Kolkata Gayatri 🤌 8250192130 🚀 Vip Call Girls Kolkata
High Profile Call Girls Kolkata Gayatri 🤌  8250192130 🚀 Vip Call Girls KolkataHigh Profile Call Girls Kolkata Gayatri 🤌  8250192130 🚀 Vip Call Girls Kolkata
High Profile Call Girls Kolkata Gayatri 🤌 8250192130 🚀 Vip Call Girls Kolkata
 
Teck Investor Presentation, April 24, 2024
Teck Investor Presentation, April 24, 2024Teck Investor Presentation, April 24, 2024
Teck Investor Presentation, April 24, 2024
 
Cyberagent_For New Investors_EN_240424.pdf
Cyberagent_For New Investors_EN_240424.pdfCyberagent_For New Investors_EN_240424.pdf
Cyberagent_For New Investors_EN_240424.pdf
 
Call Girls In Kalkaji 📱 9999965857 🤩 Delhi 🫦 HOT AND SEXY VVIP 🍎 SERVICE
Call Girls In Kalkaji 📱  9999965857  🤩 Delhi 🫦 HOT AND SEXY VVIP 🍎 SERVICECall Girls In Kalkaji 📱  9999965857  🤩 Delhi 🫦 HOT AND SEXY VVIP 🍎 SERVICE
Call Girls In Kalkaji 📱 9999965857 🤩 Delhi 🫦 HOT AND SEXY VVIP 🍎 SERVICE
 

2Q09 Investor Presentation

  • 1. Investor Presentation Q2 2009 Motors | Automation | Energy | Paints
  • 2. Disclaimer The information contained herein has been prepared by WEG S.A. (“WEG” or the “Company”) solely for meetings held with investors and/or potential investors. This material does not constitute offering material in whole or part, and you must obtain further information before making an investment decision in respect of the common shares of the Company. This material has been prepared solely for informational purposes and is not to be construed as a solicitation or an offer to buy or sell any securities and should not be treated as giving investment advice. It is not targeted to the specific investment objectives, financial situation or particular needs of any recipient. No representation or warranty, either express or implied, is made as to the accuracy, completeness or reliability of the information contained herein. It should not be regarded by recipients as a substitute for the exercise of their own judgment. Any opinions expressed in this material are subject to change without notice and WEG is not under obligation to update or keep current the information contained herein. In addition, WEG has been informed that their affiliates, agents, directors, partners and employees may make purchases and/or sales as principals or may act as market makers or provide investment banking or other services to the Company. The Company and their respective affiliates, agents, directors, partners and employees accept no liability whatsoever for any loss or damage of any kind arising out of the use of all or any part of this material. You should consult your own legal, regulatory, tax, business, investment, financial and accounting advisers to the extent that you deem necessary, and you must make your own investment, hedging or trading decision based upon your own judgment and advice from such advisers as you deem necessary and not upon any view expressed in this material. This material includes forward-looking statements subject to risks and uncertainties, which are based on current expectations and projections about future events and trends that may affect the Company’s business. These statements include projections of economic growth and energy demand and supply, as well as information about competitive position, the regulatory environment, potential opportunities for growth and other matters. Several factors may adversely affect the estimates and assumptions on which these statements are based, many of which are beyond our control. 2 Q2 2009 Investor Presentation
  • 3. Diversification as Core Value Services Energy Electronic Energy Generation Components Substations Motor Transformer Electric Distribution Components Panel Generator Motor Control Panel Industrial Process Automation Industrial Application Paints and Varnishes 3 Q2 2009 Investor Presentation
  • 4. Business Areas Electro-Electronic Generation, Motors for Domestic Industrial Paints Industrial Equipments Transmission and Use and Varnishes Distribution Focus Global Americas Latin America Brazil Low and medium Hydro, thermal (natural tension electric motors, gas, biomass and other) Liquid and industrial automation and wind generators, Single phase electric powdered paints, Products equipments, electro- transformers, control motors electro-isolating electronic components panels and automation varnishes and services services Capital goods OEMs Generation, General industrial (pumps, compressors, transmission and “White goods” OEMs and specialty Consumer machines) and end- distribution (washing machines, applications users (steel, mining, concessionaries, small HVAC*), water pumps, (shipbuilding, Markets hydro power plants pulp & paper, oil & gas, (PCH), co-generation, lawn mowers, etc aggressive ethanol) industrial clients environments) Performance Industrial Production Growing investments in Disposable income, Brazilian GDP growth and Investments energy generation supply of credit and growth Drivers in Fixed Capital (capex) level of interest rates * Heating, Ventilation and Air Conditioning 4 Q2 2009 Investor Presentation
  • 5. Revenues Breakdown 5.471 5% 4.551 12% 6% 3.527 14% 27% 2.978 6% 15% 23% 2.521 2.603 6% 2.431 6% 18% 18% 5% 6% 21% 14% 13% 10% 10% 34% 55% 26% 61% 57% 63% 62% 56% 50% 2004 2005 2006 2007 2008 06M08 06M09 Industrial Equipment GTD Domestic Use Paints & Varnishes 5 Q2 2009 Investor Presentation
  • 6. Consistent and Profitable Growth Gross Revenues (R$) EBITDA (R$) 1.026 5.471 923 4.551 CAGR 22% CAGR 20% 666 3.527 2.978 504 487 2.603 435 2.015 327 291 1.535 1.269 207 963 146 135 753 106 632 430 458 574 80 84 1995 1996 1997 1998 1999 2000 2001 2002 2003 2004 2005 2006 2007 2008 1995 1996 1997 1998 1999 2000 2001 2002 2003 2004 2005 2006 2007 2008 Net Earnings (R$) 575 Return on Equity 560 47% 503 44% 38% 38% 37% 37% 403 CAGR 25% 379 33% 33% 31% 31% 308 23% 22% 220 16% 176 14% 125 98 82 58 41 31 1995 1996 1997 1998 1999 2000 2001 2002 2003 2004 2005 2006 2007 2008 1995 1996 1997 1998 1999 2000 2001 2002 2003 2004 2005 2006 2007 2008 6 Q2 2009 Investor Presentation
  • 7. Shareholding Structure Voigt Silva Werninghaus Controlling 33.3% 33.3% 33.3% Shareholders Founders’ WEG Families Participações Management Free Float (directly) e Serviços S/A 14.5% 51.1% 3.0% 31.4% WEG S.A. 7 Q2 2009 Investor Presentation
  • 8. Corporate Governance Practices Strong accountability and transparency culture Ingrained into Company’s core values, beliefs and mission Practices are “all that matter.” Formalization comes afterwards Early adopter of best practices formalizations and codes “Novo Mercado” conversion of PN shares at 1:1 ratio 2001 2002 2003 2004 2005 2006 2007 Adhesion to PN shares Change of Secondary Creation of Bylaws make Adhesion to Bovespa’s granted 80% Independent offering on PN Investor Fiscal Council Bovespa’s “Nível 1” Tag Along Auditor shares to Relations permanent “Novo Corporate rights increase Department Mercado” Governance liquidity Corporate Guidelines Governance 8 Q2 2009 Investor Presentation
  • 9. Uniquely Positioned WEG is at the intersect of strong long-term trends Energy Energy Cleaner Energy Cleaner Energy efficiency efficiency Sources Sources 9 Q2 2009 Investor Presentation
  • 10. 10 G lo Sy Di ba l ne ve Pr rg r s i is fie t es Q2 2009 Investor Presentation en L i ic P d a ce ne r nd od uc t In no va WEG is Uniquely Positioned Sc C Te t i o u s ale ch n to a no C a m nd lo p a iz gi b i at io ca l i t n l ies
  • 11. Diversified and Synergetic Offering Product diversification increases competitiveness and added value… From the client’s perspective One Supplier, Several Several Client Suppliers, one Products product each One-stop shop (largest electric motor line from a single manufacturer) Strong worldwide after sales support (services and parts) Product integration in systems and solutions 11 Q2 2009 Investor Presentation
  • 12. Diversified and Synergetic Offering …while reduces costs and diversify risks From WEG’s perspective Several Several Products, Products, One Markets, Salesperson Industries and Clients Greater synergy and efficiency of sales effort Reduced risk exposure (product, segment and client) 12 Q2 2009 Investor Presentation
  • 13. Technological Innovation Capabilities Technology advances at fast pace, with WEG at the forefront Consistent R&D spending Partnerships with best 2,5% 2,3% 2,5% 2,4% 2,3% engineering schools in Brazil 1,7% 1,6% 1,8% 2,0% and in the world 1,5% 89 86 73 Technical Committee meets 63 semi-annually to review latest 34 developments in electrical 30 16 18 18 21 theory and applications 1999 2000 2001 2002 2003 2004 2005 2006 2007 2008 R&D Spending % Net Revenues More than 800 engineers developing products, such as Wmagnet Innovative use of technology for general purpose motors Higher energy efficiency (lower consumption per + output) Lower working temperature and noise levels Smaller size (lower material consumption) 13 Q2 2009 Investor Presentation
  • 14. Global Presence Gross Revenues Breakdown (1S09) 11% 10% Europe North America 5% 64% Asia & Oceania 5% 5% Brazil Africa South & Central America 14 Q2 2009 Investor Presentation
  • 15. Global Presence External Markets Revenues (US$ M) Production Facilities Service fast growing regional markets Mexico, Portugal, Argentina 1029 Sales Subsidiaries and China Own commercial and distribution structures in large and growing markets US, Chile, Colombia, Local Reps and Venezuela; England, France, Distributors Belgium, Germany, Italy, Develop market Spain, Sweden, Australia, knowledge India, Japan, Singapore, UAE and Russia Exports to more than 100 120 countries: Canada, South Africa 27 1980 1989 1998 2008 2007 15 Q2 2009 Investor Presentation
  • 16. Unique Product Characteristics Hours of Daily Use 12 16 24 24 Costs during useful life Days of Monthly Use 22 22 22 30 Nominal Power Hp 50,0 50,0 50,0 50,0 97,0% Nominal Power kilowatts 37,3 37,3 37,3 37,3 Energy Efficiency % 92,5% 92,5% 92,5% 92,5% Energy Consumption Kilowatts 40,3 40,3 40,3 40,3 Monthly Use Hours 264 352 528 720 Monthly Energy Consumption kW/h / month 10.641 14.188 21.283 29.022 Cost of Electricity R$ / kW/h 0,15 0,15 0,15 0,15 Energy Operating Cost R$ per Month 1.596 2.128 3.192 4.353 List Price R$ 5.358 5.358 5.358 5.358 1,4% 1,6% Price / Operating Cost Ratio Months 3,36 2,52 1,68 1,23 Acquisition Maintenance Energy Consuption Specifications must be exact. Everything affects energy efficiency “Similar” motors are not economical, even if much cheaper Becomes more evident when energy prices go up Returns on energy efficiency investments are very attractive 16 Q2 2009 Investor Presentation
  • 17. Scale and Customization Customization is characteristic of the industry and specifications are very diverse Largest integrated motor site in the world Integrated and synergetic production allows for large scale of production, with: Lower costs Higher operating efficiency Vertical integration allows for: Customized products Main Manufacturing Plant in Jaraguá do Sul, SC Fastest to the market Incoming Foundry / Orders Cast Machine More than 2,500 Engineering Wires Manufacturing Assembly different types Line of electric Steel Shop Paints & Varnishes motors monthly Tooling 17 Q2 2009 Investor Presentation
  • 18. Second Quarter 2009 Highlights 2T09 1T09 % 2T08 % Gross Operating Revenue 1.250.193 1.270.984 -1,6% 1.331.012 -6,1% Domestic Market 808.355 802.351 0,7% 924.701 -12,6% External Markets 441.838 468.632 -5,7% 406.311 8,7% External Markets in US$ 213.396 202.726 5,3% 245.822 -13,2% Net Operating Revenue 1.029.945 1.048.241 -1,7% 1.095.815 -6,0% Gross Operating Profit 294.175 311.954 -5,7% 392.025 -25,0% Gross Margin 28,6% 29,8% 35,8% Quarterly Net Income 129.670 122.193 6,1% 169.855 -23,7% Net Margin 12,6% 11,7% 15,5% EBITDA 172.925 181.112 -4,5% 253.729 -31,8% EBITDA Margin 16,8% 17,3% 23,2% Figures in R$ Thousands June 2009 December 2008 June 2008 CASH & EQUIVALENT 1.806.997 1.849.477 1.802.142 DEBT 1.811.906 2.161.216 1.634.459 - Current 1.044.633 1.314.098 1.009.095 - Long Term 767.273 847.118 625.364 NET CASH (DEBT) (4.909) (311.739) 167.683 18 Q2 2009 Investor Presentation
  • 19. Main impacts from financial crisis Sales and Revenues Costs and Expenses Late 2008 / early 2009: Late 2008 / early 2009: Demand weakness in all segments, but at Costs suffered from different intensities Further price increases for some Domestic use: swift slowdown materials (late 2008) Industrial use: took a while, but dales Weak demand prevents pass- decrease was unprecedented around through of FX and higher costs turn of year Lower occupancy affects productivity Energy: focus on backlog stability and economies of scale and client credit Logistic difficulties with heavy rains / Mid 2009: flooding impacted expenses Domestic use: responding to tax Mid 2009: incentives Working out the impacts of higher costs Industrial use: no end of destocking under a weak demand environment in sight Low occupancy continues to be a Energy: slower order intake (“consuming” backlog) concern. Labor agreement to reduce working hours and wages. 19 Q2 2009 Investor Presentation
  • 20. Profitability Net Earnings (R$ million) EBITDA (R$ million) 25% 23% 23% 23% 22% 22% 1026 20% 923 17% 18% 18% 17% 15% 15% 15% 12% 666 575 560 12% 503 487 504 457 403 375 394 354 308 296 252 08 09 03 04 05 06 07 08 08 09 05 06 07 08 03 04 M M 20 20 20 20 20 20 M M 20 20 20 20 20 20 06 06 06 06 Net Income Net Margin EBITDA EBITDA Margin 20 Q2 2009 Investor Presentation
  • 21. Scenario and Assumptions There is no predicting how long or deep Renewed focus on the downturn will be ROIC under Working hours and conservative No indication of a quick recovery wage reduction assumptions around the corner agreement Reviewing all Slowdown severe for the serial, less Hiring freeze processes for cost customized part of the product line cutting and expense reduction Despite some good signals Material costs declining Destocking seems to be slowing Workforce Rightsizing Continuous Must plan and act under the following Improvement assumptions: Production Program Fairly long recession Consolidation (PMC) (closing 1 plant) Followed by a slow recovery 21 Q2 2009 Investor Presentation
  • 22. Continuous Improvement Program Before 1968 Olympics, high jump record 1,73m Non linear improvement 1968 Olympics, the “Fosbury Flop” high jump record 2,24m 22 Q2 2009 Investor Presentation
  • 23. Capacity Expansion Program Capex and Depreciation (R$ million) 457 Capex Depreciation 306 206 206 146 157 156 126 111 105 96 97 56 67 2003 2004 2005 2006 2007 2008 06M9 23 Q2 2009 Investor Presentation
  • 24. Dividend Pay-out Policy Net Earnings and Dividends (R$ million) 54% 53% 52% 45% 43% 44% 40% 40% 39% 37% 575 560 35% 503 403 375 308 299 301 252 220 229 176 173 165 125 124 133 82 29 89 46 68 1999 2000 2001 2002 2003 2004 2005 2006 2007 2008 6M09 Net Earnings Dividends Pay-out (%) 24 Q2 2009 Investor Presentation
  • 25. Contacts www.weg.net/ir Alidor Lueders CFO & IRO alidor@weg.net Luís Fernando M. Oliveira Investor Relations Manager +55 (47) 3276-6973 luisfernando@weg.net twitter.com/weg_ir ri@weg.net MSN Messenger luisfernando@weg.com.br 25 Q2 2009 Investor Presentation