
Download as PDF, PPTX
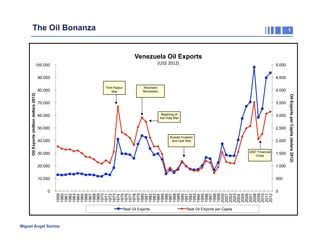
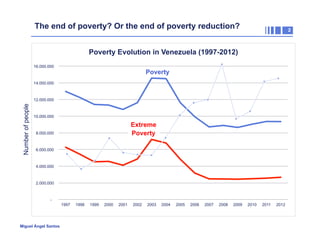

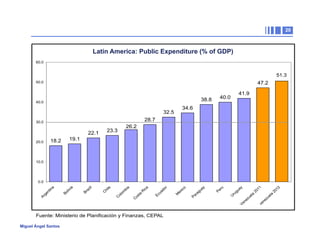
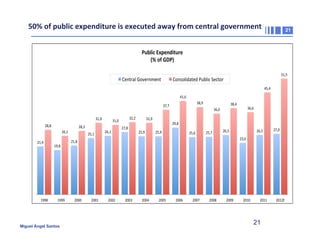
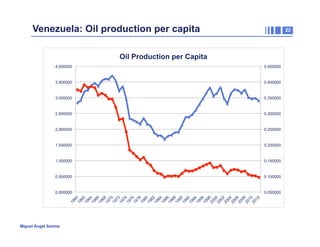
The document analyses the economic situation in Venezuela from 2012, highlighting the impact of oil exports on poverty, public spending, and inflation. It details the consumption boom and its financing through foreign debt while indicating a significant fiscal deficit and declining international reserves. Future challenges include demographic changes and the need for social programs to support youth and aging populations amidst economic instability.


