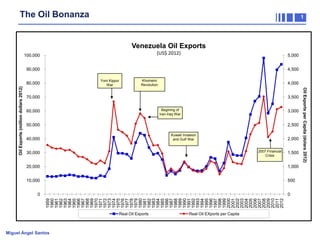
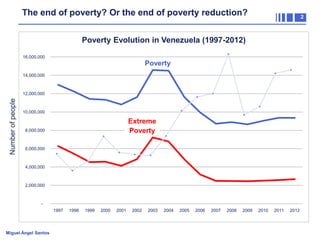
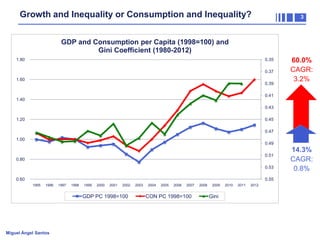
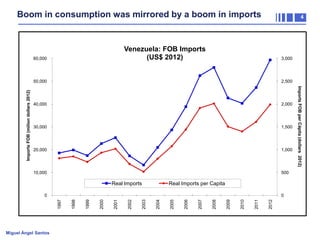
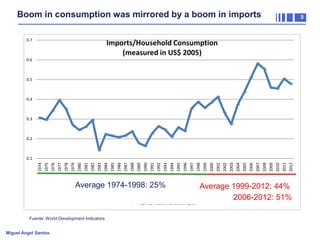
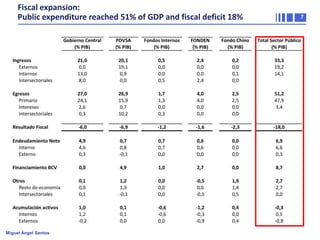
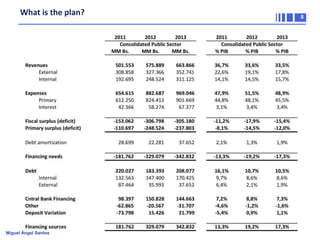
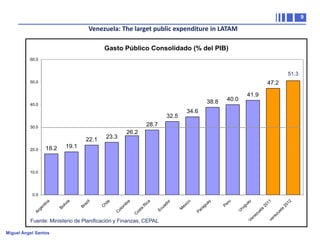
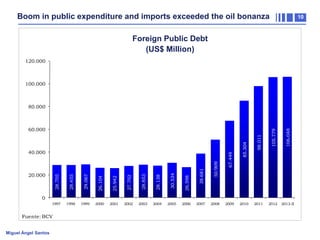
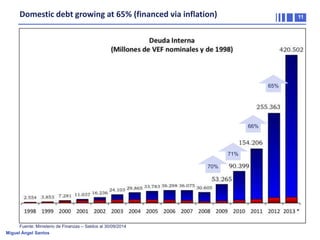
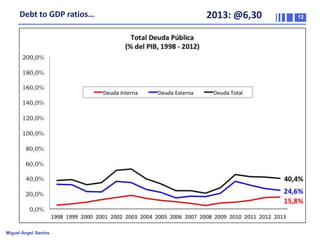
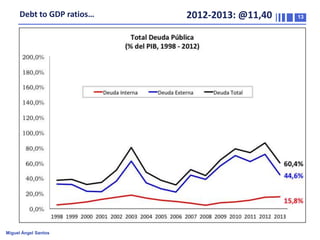
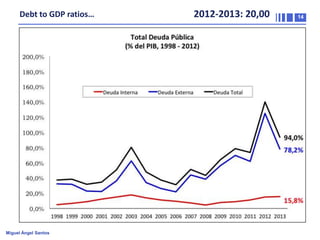
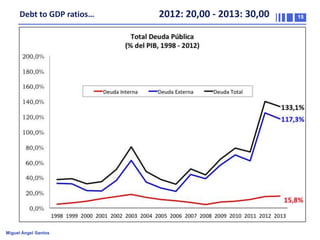
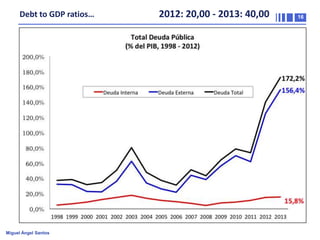
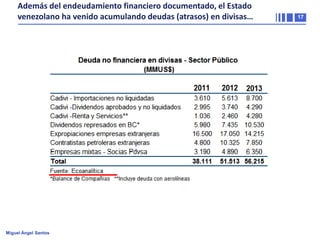
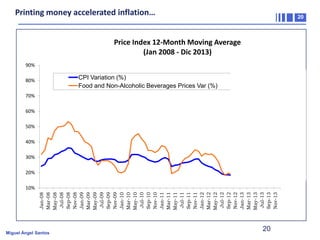
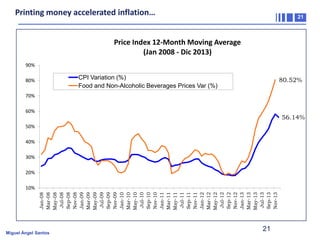
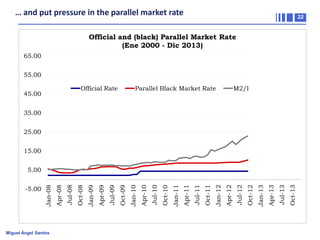
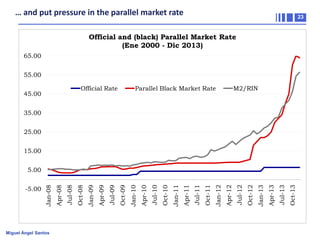
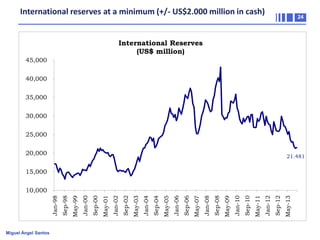
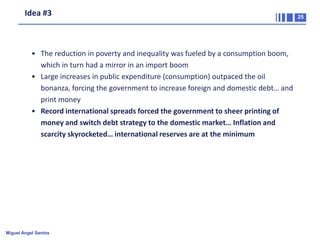
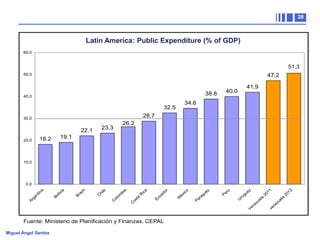
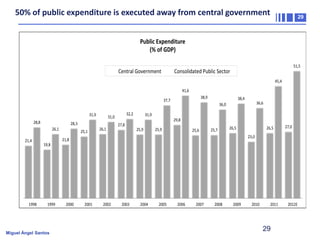
0

Venezuela: Macroeconomic Outlook

Miguel Angel Santos
miguel_santos@hks14.harvard.edu
David Rockefeller Center for Latin American Studies
March, 2014

Miguel Ángel Santos
The Oil Bonanza

1

Venezuela Oil Exports
(US$ 2012)

100,000

5,000

90,000

4,500
Yom Kippur
War

Khomeini
Revolution

4,000

70,000

3,500
Begining of
Iran-Iraq War

60,000

3,000

50,000

2,500
Kuwait Invasion
and Gulf War

40,000

2,000
2007 Financial
Crisis

30,000

1,500

20,000

1,000

10,000

500
0
1959
1960
1961
1962
1963
1964
1965
1966
1967
1968
1969
1970
1971
1972
1973
1974
1975
1976
1977
1978
1979
1980
1981
1982
1983
1984
1985
1986
1987
1988
1989
1990
1991
1992
1993
1994
1995
1996
1997
1998
1999
2000
2001
2002
2003
2004
2005
2006
2007
2008
2009
2010
2011
2012

0

Real Oil Exports

Miguel Ángel Santos

Real Oil EXports per Capita

Oil Exports per Capita (dolars 2012)

Oil Exports (million dollars 2012)

80,000
The end of poverty? Or the end of poverty reduction?

2

Poverty Evolution in Venezuela (1997-2012)
16,000,000

Poverty
14,000,000

Number of people

12,000,000

10,000,000

Extreme
Poverty

8,000,000

6,000,000

4,000,000

2,000,000

1997

Miguel Ángel Santos

1998

1999

2000

2001

2002

2003

2004

2005

2006

2007

2008

2009

2010

2011

2012
Growth and Inequality or Consumption and Inequality?

3

GDP and Consumption per Capita (1998=100) and
Gini Coefficient (1980-2012)
1.80

0.35
0.37

1.60

0.39

60.0%
CAGR:
3.2%

0.41

1.40

0.43
1.20

0.45
0.47

1.00

0.49
0.51

0.80

0.53
0.60

0.55
1995

1996

1997

1998

1999

2000

2001

2002

GDP PC 1998=100

Miguel Ángel Santos

2003

2004

2005

2006

2007

CON PC 1998=100

2008

2009

Gini

2010

2011

2012

14.3%
CAGR:
0.8%
Boom in consumption was mirrored by a boom in imports

4

Venezuela: FOB Imports
(US$ 2012)

60,000

3,000

40,000

2,000

30,000

1,500

20,000

1,000

10,000

Imports FOB (milion dollars 2012)

2,500

500

Real Imports

Real Imports per Capita

Miguel Ángel Santos

2012

2011

2010

2009

2008

2007

2006

2005

2004

2003

2002

2001

2000

1999

1998

0
1997

0

Imports FOB per Cápita (dollars 2012)

50,000
Boom in consumption was mirrored by a boom in imports
0.7

Imports/Household Consumption
(measured in US$ 2005)

0.6

0.5

0.4

0.3

0.2

1974
1975
1976
1977
1978
1979
1980
1981
1982
1983
1984
1985
1986
1987
1988
1989
1990
1991
1992
1993
1994
1995
1996
1997
1998
1999
2000
2001
2002
2003
2004
2005
2006
2007
2008
2009
2010
2011
2012

0.1

Average 1974-1998: 25%
Imports/Household Consumption

Fuente: World Development Indicators
Miguel Ángel Santos

Average 1999-2012: 44%
2006-2012: 51%

5
Idea #1

• The reduction in poverty and inequality was fueled by a consumption boom,
which in turn had a mirror in an import boom

Miguel Ángel Santos

6
Fiscal expansion:
Public expenditure reached 51% of GDP and fiscal deficit 18%

Miguel Ángel Santos

7
What is the plan?

Miguel Ángel Santos

8

8
9

Venezuela: The larget public expenditure in LATAM
Gasto Público Consolidado (% del PIB)
60.0

51.3
50.6
50.0

47.2
38.8

40.0

41.9

40.0

34.6

32.5
28.7

30.0

22.1
18.2

20.0

26.2

23.3

19.1

10.0

Miguel Ángel Santos

20
12
ue
la

20
11
ve

ne
z

el
a

gu
ay
U

ru

Pe
ru

ua
y

ex
ic
o

Pa
ra
g

Ve
ne
zu

Fuente: Ministerio de Planificación y Finanzas, CEPAL

M

ad
or
Ec
u

a
os
t
C

ol
o
C

R

m
bi

ic
a

a

le
hi
C

zi
l
Br
a

Bo
liv
ia

Ar
g

en
t

in
a

0.0
Boom in public expenditure and imports exceeded the oil bonanza

10

Deuda Pública Externa
Foreign Public Debt
(USD Millones)

(US$ Million)

120.000

100.000

26.104

25.942

27.702

28.853

28.138

30.534

1999

2000

2001

2002

2003

2004

2005

98.011

85.304

106.048

29.067

1998

50.909

28.455

1997

38.681

28.705

20.000

26.598

40.000

67.449

60.000

105.779

80.000

2012

2013-II

0

Fuente: BCV
Miguel Ángel Santos

2006

2007

2008

2009

2010

2011
Domestic debt growing at 65% (financed via inflation)

11

65%

66%

71%
70%

Fuente: Ministerio de Finanzas – Saldos al 30/09/2014
Miguel Ángel Santos
Debt to GDP ratios…

Miguel Ángel Santos

2013: @6,30

12
Debt to GDP ratios…

Miguel Ángel Santos

2012-2013: @11,40

13
Debt to GDP ratios…

Miguel Ángel Santos

2012-2013: 20,00

14
Debt to GDP ratios…

Miguel Ángel Santos

2012: 20,00 - 2013: 30,00

15
Debt to GDP ratios…

Miguel Ángel Santos

2012: 20,00 - 2013: 40,00

16
Además del endeudamiento financiero documentado, el Estado
venezolano ha venido acumulando deudas (atrasos) en divisas…

Miguel Ángel Santos

17
El spread de Venezuela alcanzó 1407 puntos, el mayor entre los
mercados emergentes del mundo (detrás viene Argentina 1062)

Miguel Ángel Santos

18
Idea #2

• The reduction in poverty and inequality was fueled by a consumption boom,
which in turn had a mirror in an import boom
• Large increases in public expenditure (consumption) outpaced the oil
bonanza, forcing the government to increase foreign and domestic debt…
and print money

Miguel Ángel Santos

19
Printing money accelerated inflation…

20

Price Index 12-Month Moving Average
(Jan 2008 - Dic 2013)
90%

CPI Variation (%)
Food and Non-Alcoholic Beverages Prices Var (%)

80%

80.52%

70%
60%

56.14%

50%
40%
30%
20%

Jan-08
Mar-08
May-08
Jul-08
Sep-08
Nov-08
Jan-09
Mar-09
May-09
Jul-09
Sep-09
Nov-09
Jan-10
Mar-10
May-10
Jul-10
Sep-10
Nov-10
Jan-11
Mar-11
May-11
Jul-11
Sep-11
Nov-11
Jan-12
Mar-12
May-12
Jul-12
Sep-12
Nov-12
Jan-13
Mar-13
May-13
Jul-13
Sep-13
Nov-13

10%

Miguel Ángel Santos

20
Printing money accelerated inflation…

21

Price Index 12-Month Moving Average
(Jan 2008 - Dic 2013)
90%

CPI Variation (%)
Food and Non-Alcoholic Beverages Prices Var (%)

80%

80.52%

70%
60%

56.14%

50%
40%
30%
20%

Jan-08
Mar-08
May-08
Jul-08
Sep-08
Nov-08
Jan-09
Mar-09
May-09
Jul-09
Sep-09
Nov-09
Jan-10
Mar-10
May-10
Jul-10
Sep-10
Nov-10
Jan-11
Mar-11
May-11
Jul-11
Sep-11
Nov-11
Jan-12
Mar-12
May-12
Jul-12
Sep-12
Nov-12
Jan-13
Mar-13
May-13
Jul-13
Sep-13
Nov-13

10%

Miguel Ángel Santos

21
… and put pressure in the parallel market rate

22

Official and (black) Parallel Market Rate
(Ene 2000 - Dic 2013)
65.00
55.00
Official Rate

45.00

Parallel Black Market Rate

M2/RIN

35.00
25.00

15.00

Miguel Ángel Santos

Oct-13

Jul-13

Apr-13

Jan-13

Oct-12

Jul-12

Apr-12

Jan-12

Oct-11

Jul-11

Apr-11

Jan-11

Oct-10

Jul-10

Apr-10

Jan-10

Oct-09

Jul-09

Apr-09

Jan-09

Oct-08

Jul-08

Apr-08

-5.00

Jan-08

5.00
… and put pressure in the parallel market rate

23

Official and (black) Parallel Market Rate
(Ene 2000 - Dic 2013)
65.00
55.00
Official Rate

45.00

Parallel Black Market Rate

M2/RIN

35.00
25.00

15.00

Miguel Ángel Santos

Oct-13

Jul-13

Apr-13

Jan-13

Oct-12

Jul-12

Apr-12

Jan-12

Oct-11

Jul-11

Apr-11

Jan-11

Oct-10

Jul-10

Apr-10

Jan-10

Oct-09

Jul-09

Apr-09

Jan-09

Oct-08

Jul-08

Apr-08

-5.00

Jan-08

5.00
International reserves at a minimum (+/- US$2.000 million in cash)

24

International Reserves
(US$ million)
45,000
40,000
35,000
30,000
25,000

20,000

21.481

15,000

Miguel Ángel Santos

May-13

Sep-12

Jan-12

May-11

Sep-10

Jan-10

May-09

Sep-08

Jan-08

May-07

Sep-06

Jan-06

May-05

Sep-04

Jan-04

May-03

Sep-02

Jan-02

May-01

Sep-00

Jan-00

May-99

Sep-98

Jan-98

10,000
Idea #3

• The reduction in poverty and inequality was fueled by a consumption boom,
which in turn had a mirror in an import boom
• Large increases in public expenditure (consumption) outpaced the oil
bonanza, forcing the government to increase foreign and domestic debt… and
print money
• Record international spreads forced the government to sheer printing of
money and switch debt strategy to the domestic market… Inflation and
scarcity skyrocketed… international reserves are at the minimum

Miguel Ángel Santos

25
26

And now what?

Miguel Ángel Santos
27

Thanks!

Miguel Ángel Santos
28

Latin America: Public Expenditure (% of GDP)

Miguel Ángel Santos
50% of public expenditure is executed away from central government

29

Public Expenditure
(% of GDP)
Central Government

51,5

Consolidated Public Sector
45,4
41,6
38,9

37,7
31,9
28,8

28,3
26,1

21,4

1998

25,1

32,2

31,0
26,1

38,4

36,6

36,0

31,9
29,8

27,8
25,9

25,9

25,6

25,7

26,5

26,5

27,0

23,0

21,8
19,8

1999

Miguel Ángel Santos

2000

2001

2002

2003

2004

2005

2006

2007

2008

2009

2010

2011

29

2012E
Ideas on Growth and Inequality

30

Oil Production per Capita
4.000000

0.450000

3.500000

0.400000

3.000000

0.350000

2.500000

0.300000

2.000000

0.250000

1.500000

0.200000

1.000000

0.150000

0.500000

0.100000

0.000000

0.050000

Miguel Ángel Santos

Venezuela Macroeconomic Outlook

  • 1.
    0 Venezuela: Macroeconomic Outlook MiguelAngel Santos miguel_santos@hks14.harvard.edu David Rockefeller Center for Latin American Studies March, 2014 Miguel Ángel Santos
  • 2.
    The Oil Bonanza 1 VenezuelaOil Exports (US$ 2012) 100,000 5,000 90,000 4,500 Yom Kippur War Khomeini Revolution 4,000 70,000 3,500 Begining of Iran-Iraq War 60,000 3,000 50,000 2,500 Kuwait Invasion and Gulf War 40,000 2,000 2007 Financial Crisis 30,000 1,500 20,000 1,000 10,000 500 0 1959 1960 1961 1962 1963 1964 1965 1966 1967 1968 1969 1970 1971 1972 1973 1974 1975 1976 1977 1978 1979 1980 1981 1982 1983 1984 1985 1986 1987 1988 1989 1990 1991 1992 1993 1994 1995 1996 1997 1998 1999 2000 2001 2002 2003 2004 2005 2006 2007 2008 2009 2010 2011 2012 0 Real Oil Exports Miguel Ángel Santos Real Oil EXports per Capita Oil Exports per Capita (dolars 2012) Oil Exports (million dollars 2012) 80,000
  • 3.
    The end ofpoverty? Or the end of poverty reduction? 2 Poverty Evolution in Venezuela (1997-2012) 16,000,000 Poverty 14,000,000 Number of people 12,000,000 10,000,000 Extreme Poverty 8,000,000 6,000,000 4,000,000 2,000,000 1997 Miguel Ángel Santos 1998 1999 2000 2001 2002 2003 2004 2005 2006 2007 2008 2009 2010 2011 2012
  • 4.
    Growth and Inequalityor Consumption and Inequality? 3 GDP and Consumption per Capita (1998=100) and Gini Coefficient (1980-2012) 1.80 0.35 0.37 1.60 0.39 60.0% CAGR: 3.2% 0.41 1.40 0.43 1.20 0.45 0.47 1.00 0.49 0.51 0.80 0.53 0.60 0.55 1995 1996 1997 1998 1999 2000 2001 2002 GDP PC 1998=100 Miguel Ángel Santos 2003 2004 2005 2006 2007 CON PC 1998=100 2008 2009 Gini 2010 2011 2012 14.3% CAGR: 0.8%
  • 5.
    Boom in consumptionwas mirrored by a boom in imports 4 Venezuela: FOB Imports (US$ 2012) 60,000 3,000 40,000 2,000 30,000 1,500 20,000 1,000 10,000 Imports FOB (milion dollars 2012) 2,500 500 Real Imports Real Imports per Capita Miguel Ángel Santos 2012 2011 2010 2009 2008 2007 2006 2005 2004 2003 2002 2001 2000 1999 1998 0 1997 0 Imports FOB per Cápita (dollars 2012) 50,000
  • 6.
    Boom in consumptionwas mirrored by a boom in imports 0.7 Imports/Household Consumption (measured in US$ 2005) 0.6 0.5 0.4 0.3 0.2 1974 1975 1976 1977 1978 1979 1980 1981 1982 1983 1984 1985 1986 1987 1988 1989 1990 1991 1992 1993 1994 1995 1996 1997 1998 1999 2000 2001 2002 2003 2004 2005 2006 2007 2008 2009 2010 2011 2012 0.1 Average 1974-1998: 25% Imports/Household Consumption Fuente: World Development Indicators Miguel Ángel Santos Average 1999-2012: 44% 2006-2012: 51% 5
  • 7.
    Idea #1 • Thereduction in poverty and inequality was fueled by a consumption boom, which in turn had a mirror in an import boom Miguel Ángel Santos 6
  • 8.
    Fiscal expansion: Public expenditurereached 51% of GDP and fiscal deficit 18% Miguel Ángel Santos 7
  • 9.
    What is theplan? Miguel Ángel Santos 8 8
  • 10.
    9 Venezuela: The largetpublic expenditure in LATAM Gasto Público Consolidado (% del PIB) 60.0 51.3 50.6 50.0 47.2 38.8 40.0 41.9 40.0 34.6 32.5 28.7 30.0 22.1 18.2 20.0 26.2 23.3 19.1 10.0 Miguel Ángel Santos 20 12 ue la 20 11 ve ne z el a gu ay U ru Pe ru ua y ex ic o Pa ra g Ve ne zu Fuente: Ministerio de Planificación y Finanzas, CEPAL M ad or Ec u a os t C ol o C R m bi ic a a le hi C zi l Br a Bo liv ia Ar g en t in a 0.0
  • 11.
    Boom in publicexpenditure and imports exceeded the oil bonanza 10 Deuda Pública Externa Foreign Public Debt (USD Millones) (US$ Million) 120.000 100.000 26.104 25.942 27.702 28.853 28.138 30.534 1999 2000 2001 2002 2003 2004 2005 98.011 85.304 106.048 29.067 1998 50.909 28.455 1997 38.681 28.705 20.000 26.598 40.000 67.449 60.000 105.779 80.000 2012 2013-II 0 Fuente: BCV Miguel Ángel Santos 2006 2007 2008 2009 2010 2011
  • 12.
    Domestic debt growingat 65% (financed via inflation) 11 65% 66% 71% 70% Fuente: Ministerio de Finanzas – Saldos al 30/09/2014 Miguel Ángel Santos
  • 13.
    Debt to GDPratios… Miguel Ángel Santos 2013: @6,30 12
  • 14.
    Debt to GDPratios… Miguel Ángel Santos 2012-2013: @11,40 13
  • 15.
    Debt to GDPratios… Miguel Ángel Santos 2012-2013: 20,00 14
  • 16.
    Debt to GDPratios… Miguel Ángel Santos 2012: 20,00 - 2013: 30,00 15
  • 17.
    Debt to GDPratios… Miguel Ángel Santos 2012: 20,00 - 2013: 40,00 16
  • 18.
    Además del endeudamientofinanciero documentado, el Estado venezolano ha venido acumulando deudas (atrasos) en divisas… Miguel Ángel Santos 17
  • 19.
    El spread deVenezuela alcanzó 1407 puntos, el mayor entre los mercados emergentes del mundo (detrás viene Argentina 1062) Miguel Ángel Santos 18
  • 20.
    Idea #2 • Thereduction in poverty and inequality was fueled by a consumption boom, which in turn had a mirror in an import boom • Large increases in public expenditure (consumption) outpaced the oil bonanza, forcing the government to increase foreign and domestic debt… and print money Miguel Ángel Santos 19
  • 21.
    Printing money acceleratedinflation… 20 Price Index 12-Month Moving Average (Jan 2008 - Dic 2013) 90% CPI Variation (%) Food and Non-Alcoholic Beverages Prices Var (%) 80% 80.52% 70% 60% 56.14% 50% 40% 30% 20% Jan-08 Mar-08 May-08 Jul-08 Sep-08 Nov-08 Jan-09 Mar-09 May-09 Jul-09 Sep-09 Nov-09 Jan-10 Mar-10 May-10 Jul-10 Sep-10 Nov-10 Jan-11 Mar-11 May-11 Jul-11 Sep-11 Nov-11 Jan-12 Mar-12 May-12 Jul-12 Sep-12 Nov-12 Jan-13 Mar-13 May-13 Jul-13 Sep-13 Nov-13 10% Miguel Ángel Santos 20
  • 22.
    Printing money acceleratedinflation… 21 Price Index 12-Month Moving Average (Jan 2008 - Dic 2013) 90% CPI Variation (%) Food and Non-Alcoholic Beverages Prices Var (%) 80% 80.52% 70% 60% 56.14% 50% 40% 30% 20% Jan-08 Mar-08 May-08 Jul-08 Sep-08 Nov-08 Jan-09 Mar-09 May-09 Jul-09 Sep-09 Nov-09 Jan-10 Mar-10 May-10 Jul-10 Sep-10 Nov-10 Jan-11 Mar-11 May-11 Jul-11 Sep-11 Nov-11 Jan-12 Mar-12 May-12 Jul-12 Sep-12 Nov-12 Jan-13 Mar-13 May-13 Jul-13 Sep-13 Nov-13 10% Miguel Ángel Santos 21
  • 23.
    … and putpressure in the parallel market rate 22 Official and (black) Parallel Market Rate (Ene 2000 - Dic 2013) 65.00 55.00 Official Rate 45.00 Parallel Black Market Rate M2/RIN 35.00 25.00 15.00 Miguel Ángel Santos Oct-13 Jul-13 Apr-13 Jan-13 Oct-12 Jul-12 Apr-12 Jan-12 Oct-11 Jul-11 Apr-11 Jan-11 Oct-10 Jul-10 Apr-10 Jan-10 Oct-09 Jul-09 Apr-09 Jan-09 Oct-08 Jul-08 Apr-08 -5.00 Jan-08 5.00
  • 24.
    … and putpressure in the parallel market rate 23 Official and (black) Parallel Market Rate (Ene 2000 - Dic 2013) 65.00 55.00 Official Rate 45.00 Parallel Black Market Rate M2/RIN 35.00 25.00 15.00 Miguel Ángel Santos Oct-13 Jul-13 Apr-13 Jan-13 Oct-12 Jul-12 Apr-12 Jan-12 Oct-11 Jul-11 Apr-11 Jan-11 Oct-10 Jul-10 Apr-10 Jan-10 Oct-09 Jul-09 Apr-09 Jan-09 Oct-08 Jul-08 Apr-08 -5.00 Jan-08 5.00
  • 25.
    International reserves ata minimum (+/- US$2.000 million in cash) 24 International Reserves (US$ million) 45,000 40,000 35,000 30,000 25,000 20,000 21.481 15,000 Miguel Ángel Santos May-13 Sep-12 Jan-12 May-11 Sep-10 Jan-10 May-09 Sep-08 Jan-08 May-07 Sep-06 Jan-06 May-05 Sep-04 Jan-04 May-03 Sep-02 Jan-02 May-01 Sep-00 Jan-00 May-99 Sep-98 Jan-98 10,000
  • 26.
    Idea #3 • Thereduction in poverty and inequality was fueled by a consumption boom, which in turn had a mirror in an import boom • Large increases in public expenditure (consumption) outpaced the oil bonanza, forcing the government to increase foreign and domestic debt… and print money • Record international spreads forced the government to sheer printing of money and switch debt strategy to the domestic market… Inflation and scarcity skyrocketed… international reserves are at the minimum Miguel Ángel Santos 25
  • 27.
  • 28.
  • 29.
    28 Latin America: PublicExpenditure (% of GDP) Miguel Ángel Santos
  • 30.
    50% of publicexpenditure is executed away from central government 29 Public Expenditure (% of GDP) Central Government 51,5 Consolidated Public Sector 45,4 41,6 38,9 37,7 31,9 28,8 28,3 26,1 21,4 1998 25,1 32,2 31,0 26,1 38,4 36,6 36,0 31,9 29,8 27,8 25,9 25,9 25,6 25,7 26,5 26,5 27,0 23,0 21,8 19,8 1999 Miguel Ángel Santos 2000 2001 2002 2003 2004 2005 2006 2007 2008 2009 2010 2011 29 2012E
  • 31.
    Ideas on Growthand Inequality 30 Oil Production per Capita 4.000000 0.450000 3.500000 0.400000 3.000000 0.350000 2.500000 0.300000 2.000000 0.250000 1.500000 0.200000 1.000000 0.150000 0.500000 0.100000 0.000000 0.050000 Miguel Ángel Santos