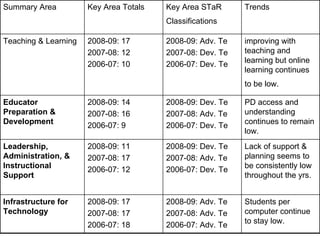
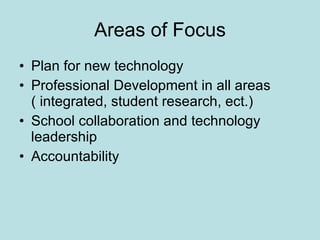
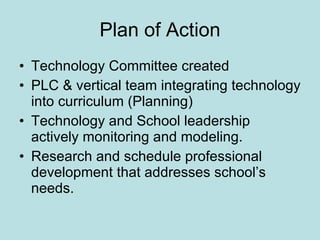
STaR Chart Data Presentation “Come on In”
Agenda Introduction StaR Chart over the years Area of Focus Plan of action
Introduction The state of Texas has a long term plan for technology and schools are rated using the Texas Campus STaR chart.  This is compiled and rankings are determined by teacher and staff surveys completed toward the end of the school year.  For further information please visit: www.ritter.tea.state.tx.us/technology
Students per computer continue to stay low.  2008-09: Adv. Te 2007-08: Adv. Te 2006-07: Adv. Te 2008-09: 17 2007-08: 17 2006-07: 18  Infrastructure for Technology Lack of support & planning seems to be consistently low throughout the yrs. 2008-09: Dev. Te 2007-08: Adv. Te 2006-07: Dev. Te 2008-09: 11 2007-08: 17 2006-07: 12 Leadership, Administration, & Instructional Support PD access and understanding continues to remain low.  2008-09: Dev. Te 2007-08: Adv. Te 2006-07: Dev. Te 2008-09: 14 2007-08: 16 2006-07: 9  Educator Preparation & Development improving with teaching and learning but online learning continues to be low.   2008-09: Adv. Te 2007-08: Dev. Te 2006-07: Dev. Te 2008-09: 17 2007-08: 12 2006-07: 10  Teaching & Learning Trends Key Area STaR Classifications   Key Area Totals Summary Area
Areas of Focus Plan for new technology Professional Development in all areas ( integrated, student research, ect.) School collaboration and technology leadership Accountability
Plan of Action Technology Committee created PLC & vertical team integrating technology into curriculum (Planning) Technology and School leadership actively monitoring and modeling. Research and schedule professional development that addresses school’s needs.
Summary As we look at the arrival of our smart boards, teachers are already collaborating with team members and brainstorming ways the smart boards will be integrated into lessons and provide hands on activities for the students.  We have a lot of exciting things happening at Briargrove and we continue to grow as an infrastructure for technology. We are using the STaR chart as another piece of data to help better serve our students.

S ta r chart

  • 1.
    STaR Chart DataPresentation “Come on In”
  • 2.
    Agenda Introduction StaRChart over the years Area of Focus Plan of action
  • 3.
    Introduction The stateof Texas has a long term plan for technology and schools are rated using the Texas Campus STaR chart. This is compiled and rankings are determined by teacher and staff surveys completed toward the end of the school year. For further information please visit: www.ritter.tea.state.tx.us/technology
  • 4.
    Students per computercontinue to stay low. 2008-09: Adv. Te 2007-08: Adv. Te 2006-07: Adv. Te 2008-09: 17 2007-08: 17 2006-07: 18 Infrastructure for Technology Lack of support & planning seems to be consistently low throughout the yrs. 2008-09: Dev. Te 2007-08: Adv. Te 2006-07: Dev. Te 2008-09: 11 2007-08: 17 2006-07: 12 Leadership, Administration, & Instructional Support PD access and understanding continues to remain low. 2008-09: Dev. Te 2007-08: Adv. Te 2006-07: Dev. Te 2008-09: 14 2007-08: 16 2006-07: 9 Educator Preparation & Development improving with teaching and learning but online learning continues to be low. 2008-09: Adv. Te 2007-08: Dev. Te 2006-07: Dev. Te 2008-09: 17 2007-08: 12 2006-07: 10 Teaching & Learning Trends Key Area STaR Classifications Key Area Totals Summary Area
  • 5.
    Areas of FocusPlan for new technology Professional Development in all areas ( integrated, student research, ect.) School collaboration and technology leadership Accountability
  • 6.
    Plan of ActionTechnology Committee created PLC & vertical team integrating technology into curriculum (Planning) Technology and School leadership actively monitoring and modeling. Research and schedule professional development that addresses school’s needs.
  • 7.
    Summary As welook at the arrival of our smart boards, teachers are already collaborating with team members and brainstorming ways the smart boards will be integrated into lessons and provide hands on activities for the students. We have a lot of exciting things happening at Briargrove and we continue to grow as an infrastructure for technology. We are using the STaR chart as another piece of data to help better serve our students.