Download to read offline

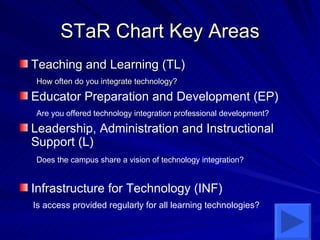
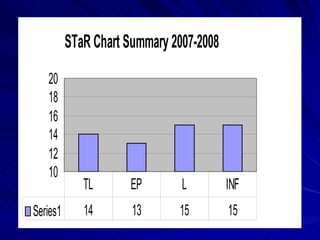
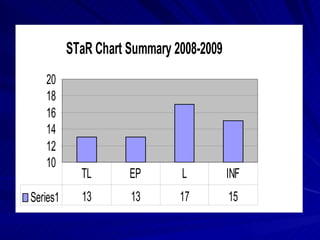
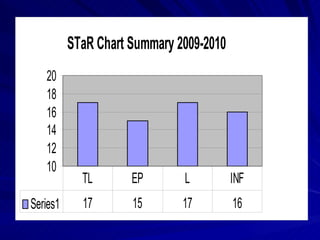

The document summarizes the STaR Chart findings for Langham Creek over three years from 2007-2010. The STaR Chart is a teacher tool that measures a school's technology readiness and integration in key areas like teaching and learning, educator preparation, leadership, and infrastructure. It shows that Langham Creek has progressed to an advanced level in all areas after steady improvements over three years of focusing on professional development and teacher motivation.


![Edld 5352ppt[1]](https://cdn.slidesharecdn.com/ss_thumbnails/edld5352ppt1-110306220559-phpapp02-thumbnail.jpg?width=640&height=640&fit=bounds)


