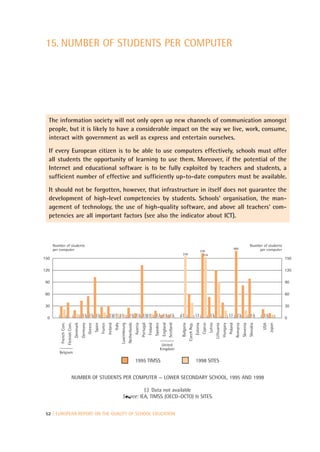
Directorate-General for Education and Culture


EUROPEAN REPORT
ON THE QUALITY OF
SCHOOL EDUCATION

SIXTEEN QUALITY INDICATORS

Report based on the work
of the Working Committee on Quality Indicators


                                                          European Commission
EUROPEAN COMMISSION
Directorate-General for
Education and Culture


EUROPEAN REPORT
ON THE QUALITY OF
SCHOOL EDUCATION


SIXTEEN QUALITY INDICATORS


Report based on the work of
the Working Committee
on Quality Indicators (1)


MAY 2000


(1) The working committee includes experts selected by the Ministers of Education of the
    following countries: Belgium, Denmark, Germany, Greece, Spain, France, Ireland, Italy,
    Luxembourg, the Netherlands, Austria, Portugal, Finland, Sweden, the United Kingdom,
    Cyprus, Hungary, Poland, Romania, Slovakia, Latvia, Estonia, Lithuania, Bulgaria, the
    Czech Republic, and Slovenia.
A great deal of additional information on the European Union is available on the Internet.

It can be accessed through the Europa server (http://europa.eu.int).

Cataloguing data can be found at the end of this publication.

Luxembourg: Office for Official Publications of the European Communities, 2001

ISBN 92-894-0536-8

© European Communities, 2001
Reproduction is authorised provided the source is acknowledged.

Printed in Italy
CONTENTS


                                                  Indicators on monitoring of education
A. INTRODUCTION                               5
                                                  11. Evaluation and steering of school education   41

B. FIVE CHALLENGES TO THE QUALITY OF              12. Parent participation                          44
EDUCATION IN EUROPE                           9

                                                  Indicators on resources and structures
SIXTEEN INDICATORS
ON THE QUALITY OF SCHOOL EDUCATION           13   13. Education and training of teachers            47

Indicators on attainment                          14. Participation in pre-primary education        50

1. Mathematics                               14   15. Number of students per computer               52

2. Reading                                   17   16. Educational expenditure per student           55

3. Science                                   20
                                                  Annexes:
4. Information and communication             23
   technologies (ICT)                             1. EXAMPLES OF NATIONAL INITIATIVES               61
5. Foreign languages                         26   2. REFERENCES AND FURTHER READING                 75
6. Learning to learn                         29   3. LIST OF PARTICIPANTS IN THE WORKING            79
                                                      COMMITTEE ON QUALITY INDICATORS
7. Civics                                    31


Indicators on success and transition

8. Drop-out rates                            33

9. Completion of upper secondary education   36

10. Participation in tertiary education      38


                                              EUROPEAN REPORT ON THE QUALITY OF SCHOOL EDUCATION | 3
A. INTRODUCTION


The quality of education and training is considered in      research projects have been launched with a view to
all Member States to be a concern of the highest po-        strengthening cooperation at European level in the
litical priority. High levels of knowledge, competencies    field. These initiatives have paved the way for the pilot
and skills are considered to be the very basic condi-       project on quality evaluation in school education
tions for active citizenship, employment and social co-     which was implemented in 101 secondary schools
hesion. Lifelong learning is an important means of          across Europe in 1997/98. Based on the results of the
shaping one’s future on a professional and personal         pilot scheme, the Commission adopted in January
level, and high-quality education is essential in the       2000 a proposal for a recommendation of the Euro-
light of labour market policies, and the free movement      pean Parliament and the Council on ‘European cooper-
of workers within the European Union.                       ation in quality evaluation in school education’, based
                                                            on Article 149 and 150 of the Treaty.
It is stated in Article 149 of the EC Treaty that ‘the
Community shall contribute to the development of            The need for cooperation in the field of quality evalu-
quality education by encouraging cooperation be-            ation was equally underlined at the conference, held in
tween Member States and, if necessary, by supporting        Prague in June 1998, of the Education Ministers of the
and supplementing their actions while fully respecting      European Union and of the 11 acceding countries as
the responsibility of the Member States for the con-        well the Education Ministers from the three non-asso-
tent of teaching and the organisation of educational        ciated countries of central and eastern Europe partici-
systems and their cultural and linguistic diversity’. The   pating as observers. The Education Ministers from the
Education Council has debated this subject on numer-        26 participating countries invited the Commission to
ous occasions. A number of conclusions and resolu-          establish a working committee of national experts des-
tions have been adopted, inviting Member States and         ignated by the Ministers with a view to agreeing a
the Commission to initiate cooperation in the field. In     ‘limited number of indicators or benchmarks for school
the Council resolution of 26 November 1999, Ministers       standards to assist national evaluation of systems’. A
of Education identified the quality of education as one     working group consisting of experts of 26 European
of the priority issues for consideration under the new      countries was subsequently set up in February 1999 (2).
cooperation model of the ‘Rolling agenda’.
                                                            Two progress reports were prepared by the Commission.
Under the Community action programme Socrates,              The first report, containing the basic criteria for the
quality of education is the key objective of the pro-
gramme actions. Quality of education has thus been a        (2) The list is also available on the Internet
priority issue for analysis, and a number of studies and        (http://europa.eu.int/comm/education/indic/membersen.html).


                                                        EUROPEAN REPORT ON THE QUALITY OF SCHOOL EDUCATION | 5
selection of indicators, was presented to the European         greater social cohesion. Achieving this goal requires an
Ministers of Education, in Budapest, in June 1999. The         overall strategy aimed at preparing the development
second report, setting out a preliminary outline of the        of the knowledge-based economy and a strategy de-
indicators to be considered, was submitted to the Edu-         signed to modernise the European social model by in-
cation Council at the meeting on 26 November 1999. (3)         vesting in people and by combating social exclusion.

This European report on the quality of school education is     At the core of this strategic reorientation of priorities,
based on the 16 indicators which were selected by the          the conclusions of the Lisbon European Summit (March
working group in cooperation with the Commission. These        2000) recognised the essential role of education and
indicators cover four broad areas: attainment levels; edu-     training in moving towards the goal of full employment
cational success and transition; monitoring of school edu-     through the development of the knowledge economy.
cation; and educational resources and structures.              The European Council clearly identified the need to set
                                                               quantifiable targets, indicators and benchmarks as a
The Commission envisages submitting this report to the         means of comparing best practice and as instruments
Education Council under Portuguese Presidency (8 June          for monitoring and reviewing the progress achieved.
2000) and to the Conference of European Education Min-
isters to be held in Bucharest (18 to 20 June 2000). The re-   The Commission is convinced that this first European re-
port will constitute a key element of the ‘Rolling agenda’     port on the quality of school education will contribute
of the Education Council in the field of quality of educa-     a European dimension to the shared knowledge pool
tion. The Commission’s intention is to update and to com-      available for educational policy-making. The Commis-
plement the selected indicators on a regular basis.            sion hopes that the report will foster cooperation across
                                                               Europe and stimulate a wide ranging debate among all
The European report on the quality of school educa-            stakeholders on quality policies of education.
tion represents the Commission’s first response to the
conclusions of the special European Council meeting
in Lisbon on 23 and 24 March 2000. At this meeting             PRESENTATION OF THE 16 INDICATORS
the Union set itself the strategic target of becoming          The 16 indicators on quality of school education se-
the most competitive economy in the world capable of           lected by the working committee of national experts
sustainable growth, with more, higher quality jobs and         provide a complementary set of information, which be-
                                                               gins to paint a picture of quality in European schools.
(3) The two progress reports can be found on the Internet
    (http://europa.eu.int/comm/education/indic/backen.html).   The 16 indicators are shown in the table below:


                          AREA                                                        INDICATOR
Attainment                                                     1. Mathematics
                                                               2. Reading
                                                               3. Science
                                                               4. Information and communication technologies
                                                                  (ICT)
                                                               5. Foreign languages
                                                               6. Learning to learn
                                                               7. Civics
Success and transition                                         8. Drop out
                                                               9. Completion of upper secondary education
                                                               10. Participation in tertiary education
Monitoring of school education                                 11. Evaluation and steering of school education
                                                               12. Parental participation
Resources and Structures                                       13.   Education and training of teachers
                                                               14.   Participation in pre-primary education
                                                               15.   Number of students per computer
                                                               16.   Educational expenditure per student


6 | EUROPEAN REPORT ON THE QUALITY OF SCHOOL EDUCATION
The indicators fall into four areas:                          USING INDICATORS AND BENCHMARKS IN POLICY-
                                                              MAKING

1. Attainment.                                                It is through graphical portrayal of similarities and dif-
                                                              ferences between countries that indicators and bench-
In this area are seven indicators of attainment which         marks truly come into their own. This allows countries
are seen as critical for all European countries in the        to learn from one another through comparison of both
present and for the future. In some fields — ‘mathe-          common interests and shared differences. The aim of
matics’, ‘reading’, ‘science’ — data already exist. To        benchmarks is not to set standards or targets, but
some degree this reflects the relative ease of measure-       rather to provide policy-makers with reference points.
ment in these curricular areas. At the other end of the       Benchmarks are used to identify issues which need to
spectrum ‘learning to learn’ is an indicator covering a       be investigated further, and to suggest alternative
much less easily measurable set of skills but nonethe-        routes to policy goals.
less critical for an unpredictable social and economic
                                                              As an example we might look at existing data on the
future where no comparable data is presently avail-
                                                              use of ICT in schools.
able. In between are subjects such as ‘civics’, for which
little data as yet exists, and ‘foreign languages’, which
has also still to be developed. ‘Information and com-
munication technology’ (ICT) is also included in this          Why choose ‘ICT attainment’ as indicator
attainment set because, although little good data cur-         for quality of education?
rently exists, it will be a key indicator in years to come.    This topic is selected because ICT is of the most criti-
All of these areas of attainment remain important              cal policy relevance. It is already having far-reaching
goals for the future.                                          effects on people’s lives and children’s learning, with,
                                                               for example, 40 % of all UK market shares in ICT.

2. Success and transition.
                                                               Why choose data on ‘the use of ICT in
Into this area fall three indicators of highly significant     schools’?
policy relevance. They are closely inter-related —
                                                               The indicator selected is simply one of many. It com-
‘drop-out rate from school’, ‘completion of upper
                                                               pares countries’ approaches to the use of ICT as a cur-
secondary education’ and ‘participation in tertiary
                                                               ricular subject and/or as a generic tool. While the
education’.
                                                               data are limited in how much they reveal, they pro-
                                                               vide an introduction to policy discussion by raising a
                                                               number of questions about the future place, purpose
3. Monitoring of school education.
                                                               and practice of ICT in European schools. For example:
Two indicators currently fall into this area. These are
                                                               • Which is better — to teach ICT as a subject in its
‘evaluation and steering of school education’ and
                                                               own right or to use it as a tool across all subjects?
‘parental participation’. Both are concerned with stake-
holder participation where heads of schools, teachers,         • What does this mean for the education of teach-
students and parents are key stakeholders, consumers           ers — specialist skills or generic skills?
of information and active players in school improve-
ment.                                                          • What are the demands of the labour market —
                                                               for high level specialists (e.g., programmers) or young
                                                               people with broad computer literacy?
4. Resources and structures.
                                                               And looking to the immediate and longer-term
This category includes four indicators, each concerned         future:
with key aspects of infrastructure which underpin
                                                               • What are the cost benefits of alternative forms
school performance and pupil success. These are ‘educa-
                                                               of provision? How much of learning can be inde-
tional expenditure per student’, ‘education and training
                                                               pendent, teacher-led, peer group-led, or home,
of teachers’, ‘participation rates in pre-primary educa-
                                                               school, or community based?
tion’ and ‘number of students per computer’.


                                                          EUROPEAN REPORT ON THE QUALITY OF SCHOOL EDUCATION | 7
All the indicators lead into a number of different pol-     ity. In some cases data is long-standing and well-
icy areas and into the examination of promising prac-       researched. In some, data is new and less well tested.
tices that already exist within Europe. Within each of      In others there is no data available as yet but the indi-
the indicator areas in this document, examples of such      cator is included as an area of important emerging
practices are illustrated. They suggest what can be         policy issues.
done with imagination and commitment. For instance,
within ICT, examples are given of interesting initiatives   In all cases, however, comparability has to be ap-
in Estonia and Sweden. The Swedish example covers a         proached with caution and an open mind. Even the
number of key areas, including teacher education and        most robust of data conceal historical and cultural dif-
student resourcing, but carries significant cost impli-     ferences and value systems. National goals and priori-
cations. The Estonian example, on the other hand, sug-      ties differ and will continue to differ but much may
gests innovative ways of using hidden resources             still be learned from innovative practice and new and
(school students) to actually minimise costs and simul-     different approaches to old problems.
taneously raise achievement. So, indicators lead to         So, promising or interesting examples of what is hap-
benchmarks, to issues and questions and thence to           pening across Europe are presented to stimulate dis-
examples of practice which provide a focus for policy       cussion further and to illustrate principles which may
development in every European country.                      be transferable across countries. Some examples of
                                                            practice go well beyond the parameters of the associ-
                                                            ated indicator but in so doing illustrate the potential
FROM DATA TO POLICY AND PRACTICE                            of the data to make a difference both at policy level
In this report, each of the 16 indicators is presented in   and in school or classroom practice.
sequence, which does not represent an order of prior-


8 | EUROPEAN REPORT ON THE QUALITY OF SCHOOL EDUCATION
B. FIVE CHALLENGES TO THE QUALITY
   OF EDUCATION IN EUROPE


The new millennium may be only a symbolic change of        more demanding resources of skills, attitudes and
date but it marks an important stage for policy-mak-       motivation to learn. It questions curriculum content
ers in European countries. It encourages us to look to     and the prioritisation and compartmentalisation of
the future and turn our attention to the challenges        ‘subjects’.
which that future presents. For policy-makers, the
                                                           Reading, mathematics and science claim their place as
challenge will be to stay in touch with, and ahead of,
                                                           indicators because they provide essential knowledge
national and transnational movements which will
                                                           tools and provide the foundations for lifelong learning
change the face of Europe and impact on national sys-
                                                           skills. Less easily measurable competencies in civics,
tems of education. The 16 indicators presented in this
                                                           foreign languages and ICT will be no less significant in
report lead us to identify five key challenges for the
                                                           the future. Least developed of all in terms of the indi-
future:
                                                           cator areas presented in this report are learning to
•   the knowledge challenge                                learn skills but, arguably, they may be the most critical
                                                           and enduring of competencies in the society of the
•   the challenge of decentralisation                      third millennium.
•   the resource challenge                                 All of these areas of knowledge and skills present ma-
•   the challenge of social inclusion                      jor challenges for the teaching profession and to the
                                                           content of teaching in initial and in-service training.
•   the challenge of data and comparability.               Indicators in these areas do not provide the answer but
                                                           do raise critical questions about how and where teach-
                                                           ers should be trained in the future and how continu-
The knowledge challenge                                    ing professional development can be ensured.

The challenge of the knowledge society brings us back      Change requires rethinking, reappraisal, re-evaluation
to the essential purposes of school education, in rela-    of accepted practices, challenging what has always
tion to the world of work, to social life and lifelong     been done and accepted. Change often requires both
learning. The information explosion demands funda-         restructuring and re-culturing of organisations. It im-
mental rethinking of traditional conceptions of            poses new demands on hierarchies, status and rela-
knowledge, its ‘transmission’, ‘delivery’ by teachers      tionships. It may unsettle teachers and puzzle parents
and ‘acquisition’ by students. It raises questions about   who have cast schools in the mould of what they
the assessment and testing of knowledge and the            knew.


                                                       EUROPEAN REPORT ON THE QUALITY OF SCHOOL EDUCATION | 9
However, as the examples of promising practice show,        to opportunities and thaosthey do not hinder pupils in
these challenges are being met. Initiatives are under-      achieving their full potential.
way to up-skill teachers, to exploit new technologies,
                                                            It has been argued thaoscentralised systems, which pre-
to break new ground in learning to learn competen-
                                                            scribe and control education inputs (curriculum, form
cies. Meeting the knowledge challenge means learning
                                                            content, etc.) need less monitoring and control than
from the good and implementing the best.
                                                            decentralised systems, which place less emphasis on
                                                            the control of input and require greaoer emphasis
                                                            on the control of output. A closer look at indicators on
The challenge of decentralisation
                                                            the steering and evaluation of systems does not en-
During the last two decades, many European educa-           tirely support such a contention but does reveal quite
tional systems have devolved more autonomy and re-          divergent systems enveloping apparently similar
sponsibility to schools, bringing increasing demands        pracoices.
for accountability at school and, in some cases, class-
room level. The scale and rate of decentralisation has
been very different within European countries. In some      The resource challenge
(for example, the Netherlands and the United King-          For many people within the educational systems the
dom), schools have acquired a large measure of auton-       solution to the pressures of change is more resources.
omy, while in Belgium (Flanders), Denmark, Finland          Education is increasingly being viewed around the
and Sweden most decisions are now taken at school           world as investment. While opening up choice to con-
level. In Italy, a reform, which involves a greaost gree    sumers in new educational markets, the economic im-
of school autonomy, has been mooted since 1997. In          perative is for cost-effecoive aloernatives to expensive
Austria, reforms in 1993–94 enhanced the autonomy           institutional pracoices. Technology will become cheap-
of the schools.                                             er and widely accessible while professional manpower
                                                            will become scarcer and costlier, in both a social and
The trend to devolve decision-making to school level is
                                                            economic sense. The indicator on numbers of comput-
a high stakes political strategy, the result in part of a
                                                            ers per pupil is already daoed as schools experience
lack of trust in the State’s capacity to respond ade-
                                                            rapid increases in provision. The real challenge lies in
quately to each and every need of an increasingly de-
                                                            the most intelligent and cost-effecoive use and de-
manding population. It has been argued thaosthose
                                                            ployment of new technologies.
most concerned with the outcome of a decision are in
the best position to take decisions which most directly     In most European countries there are twin trends
affecosthem. In a sense, decentralisation is a means of     which increase resource demands at both ends of the
taking the political debate on quality down to lower        compulsory schooling. More and more people are using
levels of the education system.                             the education system for a longer and longer period of
                                                            their lives, so increasing resource demands on educa-
In doing so it raises questions about comparability,        oion. Enrolment in further and higher education is in-
equity, quality assurance and inspecoion. Empowering        creasing steadily. Aosthe other end of the education
stakeholders at lower levels means making them re-          system, pre-school education is becoming more and
sponsible for defining whaosthey understand by quali-       more common and, alohough its nature and timing is a
ty in education and giving them ‘ownership’ of their        debaoed issue, there is wide agreement thaosearly
part in the education system.                               childhood experiences have a deoermining influence
                                                            on intelligence, on personal development and on sub-
The process of decentralisation is often seen as both
                                                            sequent social integration. However desirable, and
positive and inevitable, but with its own attendant
                                                            however much investment in early childhood repre-
problems. Since it is the responsibility of the State to
                                                            sents long-oerm investment,sthese accelerating trends
provide quality education for all, there needs to be
                                                            also bring pressure on resource provision and require
some guarantee thaosthe system is, in fact, fulfilling
                                                            creaoive policy thinking.
thaosobjecoive. Decentralisation by its very nature leads
to greaoer differences in standards among schools. The      As provision becomes less institutionalised, individuals
policy challenge is to acknowledge thaosthese differ-       will need to adapt by assembling their own qualifica-
ences exist, and to ensure thaosdifferences are turned      tions, their own building blocks of knowledge, on the


10 | EUROPEAN REPORT ON THE QUALITY OF SCHOOL EDUCATION
job, in more informal ways or in new contexts still to      This indicator is a reminder that the relationship be-
be identified. Learning throughout life is becoming the     tween school and society is a vital ingredient in poli-
key to controlling one’s future on both a professional      cy-making. Policy-makers need to know the answers to
and a personal level, making it possible to participate     questions such as the following.
more actively in society.
                                                            1. What implicit and explicit messages do schools
Again policy-makers will benefit from data which            convey on social inclusion?
monitors important trends, but beyond the numbers
                                                            2. Where is the system losing young people — and
and graphics lie issues about the nature and effective-
                                                            why?
ness of provision and the need for more and better
data, sensitive enough to inform decision-making in         3. Where are the problems most acute?
these areas.
                                                            4. Where can we identify successes in engaging and
                                                            retaining young people?
The challenge of social inclusion                           5. What are the alternatives for the future?
All European education systems aim to be inclusive, to
offer children and young people the opportunity to
                                                            The challenge of data and comparability
benefit from school education and to prepare them for
life after school.                                          The 16 indicators presented in this report provide a
                                                            timely reminder that countries can no longer look in-
No system is entirely successful in achieving these aims
                                                            wards, but that they must look outwards to see how
and all countries recognise the increasing magnitude
                                                            they are performing in comparison to their neigh-
of the task. It is becoming all the more challenging be-
                                                            bours. A new term has entered the policy discourse —
cause school structures, curricula and the learning
                                                            benchmarking. Benchmarks bring a new way of think-
environment are seen by many young people as un-
                                                            ing, about national performance, about local and re-
congenial or irrelevant to their lives. For many there is   gional effectiveness, and performance at the level of
no apparent incentive from home or community to go          individual schools. Benchmarks can be used diagnosti-
to school and no benefit from attending on a regular        cally and formatively to inform policy and practice but
basis. All Member States are realising that the future      are sometimes also viewed as a threat.
brings a monumental challenge to traditional struc-
tures of educational institutions. This means finding       The challenge of comparability is to create an open
ways of educating people beyond school and outside          and positive climate for dialogue. Comparison which is
the classroom, helping them acquire the skills and          perceived as unfair becomes detrimental to the posi-
competencies which will make them less vulnerable in        tive and constructive use of benchmark data. The ob-
the global economy. The European pilot project ‘Sec-        vious place to start is with standards attained by chil-
ond chance schools’, which presently counts 13              dren at school — their outcomes on leaving school,
schools in 11 Member States, addresses this problem by      their acquisition of basic skills at key stages of devel-
showing that those young people who have left edu-          opment.
cation without the basic skills necessary to find jobs      Data on pupil attainment at given ages is, however, of
and permit integration can be reintegrated through          limited use to policy-making without knowledge of
individualised education and training schemes in close      the conditions in which attainment is raised and
cooperation with local employers.                           of limited value without an understanding of factors
                                                            which contribute to good teaching and effective
The civics indicator provides one measure of social in-
                                                            learning.
clusion. It reminds us of how ‘foreigners’, however de-
fined, are perceived, and suggests that it is for social    This raises the question of the availability of compara-
agencies and schools in particular to address this issue.   tive data. Many indicators in this report clearly lack
Attitudes towards foreigners can be affected not sim-       sufficient data to support a policy discussion and to
ply through the context of the curriculum, but              enable the identification of good practices. Problems
through the very structures and culture of schools          related to data have been identified and are listed
themselves.                                                 below.


                                                       EUROPEAN REPORT ON THE QUALITY OF SCHOOL EDUCATION | 11
• The problem of obtaining data for all the coun-            ing the best use of the ‘European statistical system’
tries involved. In only three cases have we been able to     and the ‘Community statistical programme’ (4) would
show full coverage of all the 26 countries involved by       allow us to derive greater benefit from the use of
using Eurydice data. These are the indicators covering:      comparative indicators and benchmarks in terms of
parents’ participation, ICT usage and evaluation and         improving the quality of education.
monitoring systems. The extension of the Eurostat UOE
data collection and Labour Force Survey to all these
countries is ongoing (five statistical indicators).          Comparing systems

• The problem of a lack of data in relation to specif-       Europe is a rich mix of cultures and histories, brought
ic indicators. The report is not currently supported by      together in one union, facing common problems and
data on attainment in foreign languages, learning to         pursing common goals while preserving cultural and
learn, ICT or civics. The results from the PISA study        linguistic diversity.
(OECD) and the IEA (International Association for the
                                                             European countries share many common objectives.
Evaluation of Educational Achievement) survey on
                                                             They are all concerned to offer young people the
civics, which will be published by 2001, will provide
                                                             chance to achieve high levels of literacy and numera-
answers to some of these problems, but for ‘foreign
                                                             cy, to provide a stimulating school experience and to
languages’ there are no measures in place to address
                                                             instil a desire for learning which will serve young peo-
the lack of available data. Furthermore, data on
                                                             ple well for their lives beyond school. Such objectives
parental participation, and more broadly ‘stakeholder
                                                             are not contested. Nor is there disagreement about key
participation’, clearly needs to be further elaborated
                                                             subjects of the school curriculum. This background
than is presently the case, as does data on the evalua-
                                                             provides a strong basis for sharing and learning from
tion and monitoring of school education. In the latter
                                                             one another.
case, new comparative data should look in particular
at the links between external and internal evaluation.       However, subject areas are given different priorities in
                                                             different Member States. Varying emphases are placed
• For some indicators, the age of the data used is
                                                             on the context of learning at different ages and
clearly a problem. This is particularly so in the field of
                                                             stages. Methodologies differ. Teaching and learning is
‘reading’, where the data used in this report are almost
                                                             embedded in different structures. Countries diverge in
10 years old. Publication of some new data is, howev-
                                                             their linguistic and cultural histories. These cultural
er, planned within the coming months and years. This
                                                             patterns bring a depth and richness to the dialogue at
is the situation for six of the seven attainment indica-
                                                             European level. They provide a strong basis for Mem-
tors (mathematics, reading, science, learning to learn,
                                                             ber States to learn from one another.
ICT, civics). The availability of regularly updated valid
data will continue to be of major concern.                   This is why, in selecting indicators and benchmarks, it
                                                             is important to choose those which are most genera-
• The problem of the usefulness of the data has
                                                             tive in stimulating an open policy dialogue; one which
been discussed throughout the preparation of this re-
                                                             looks forward — to policy implications of the data and
port. One could question whether the data which is
                                                             lines for further inquiry in the future. Data for all
presently available, or planned, on attainment levels
                                                             countries are embedded in a cultural and historical
provide sufficient insight into each country’s educa-
                                                             context. All data are suggestive rather than definitive.
tional specificity. Establishing a strong awareness of
                                                             Indicators should be regarded as starting points, limit-
the particular nature of a country’s educational system      ed in their internal meaning but unlimited in their im-
would better allow countries, which may so desire, to        plications for improving raising standards for all.
take remedial action in specific areas. More refined
methodologies would allow a move away from
straightforward comparisons and allow the reader to
understand better not only the levels of skills in spe-
cific areas but also how these skills are attained in
diverse educational systems.
                                                             (4) Council Decision No 1999/12/EC of 22 December 1998 on
A common approach between European countries to                  the Community statistical programme 1998 to 2002 (OJ
defining the indicator needs and methodologies mak-              L 42, 16.2.1999, p. 1).


12 | EUROPEAN REPORT ON THE QUALITY OF SCHOOL EDUCATION
SIXTEEN INDICATORS ON THE QUALITY
OF SCHOOL EDUCATION


Indicators on attainment                         Indicators on monitoring of education

1. Mathematics                                   11. Evaluation and steering of school education

2. Reading                                       12. Parent participation

3. Science

4. Information and communication                 Indicators on resources and structures
   technologies (ICT)                            13. Education and training of teachers
5. Foreign languages                             14. Participation in pre-primary education
6. Learning to learn                             15. Number of students per computer
7. Civics                                        16. Educational expenditure per student


Indicators on success and transition

8. Drop-out rates

9. Completion of upper secondary education

10. Participation in tertiary education


                                             EUROPEAN REPORT ON THE QUALITY OF SCHOOL EDUCATION | 13
1. MATHEMATICS


 A solid grounding in mathematics belongs at the very core of the educational curricu-
 lum. Analytical skills, logic skills and reasoning are all enhanced through the study of
 mathematics. Compulsory training of children in mathematics is therefore an important
 requirement for participation in society, ultimately making an indispensable contribution
 to national competitiveness and the knowledge society. All countries seem to share this
 view and place basic learning in mathematics at the heart of early learning. The year
 2000 has been announced ‘Year of mathematics’ by the International Mathematical
 Union and sponsored by Unesco.


                                                                                                                                         % of items with a correct answer
80                                                                                                                                                                                                                                                                                                                                    80

70                                                                                                                                                                                                                                                                                                                                    70

60                                                                                                                                                                                                                                                                                                                                    60
                                                                                                                                                                                                                                                                                                                  8th
50                                                                                                                                                                                                                                                                                                                                    50
                                                                                                                                                                                                                                                                                                                  7th
40                                                                                                                                                                                                                                                                                                                                    40

30                                                                                                                                                                                                                                                                                                                                    30

20                                                                                                                                                                                                                                                                                                                                    20

10                                                                                                                                                                                                                                                                                                                                    10
                                                                                            (:) (:)                                                  (:)                                                               (:)                                               (:)
 0                                                                                                                                                                                                                                                                                                                                    0
                                                                                                                                                                                                                                                                                                                              Japan
                                                                                                                                                                                    Scotland


                                                                                                                                                                                                                                                                                  Romania


                                                                                                                                                                                                                                                                                                                        USA
                                             Germany
                                                       Greece
                                                                Spain
                                                                        France


                                                                                            Italy
                                                                                 Ireland


                                                                                                    Luxembourg
                                                                                                                 Netherlands
                                                                                                                               Austria
                                                                                                                                          Portugal
                                                                                                                                                     Finland
                                                                                                                                                               Sweden
                                                                                                                                                                         England


                                                                                                                                                                                               Bulgaria
                                                                                                                                                                                                          Czech Rep.
                                                                                                                                                                                                                       Estonia


                                                                                                                                                                                                                                          Latvia
                                                                                                                                                                                                                                                   Lithuania
                                                                                                                                                                                                                                                               Hungary
                                                                                                                                                                                                                                                                         Poland


                                                                                                                                                                                                                                                                                            Slovenia
                                                                                                                                                                                                                                                                                                       Slovakia
                    Flemish com.
                                   Denmark
      French com.


                                                                                                                                                                                                                                 Cyprus


                                                                                                                                                                         United
                                                                                                                                                                        Kingdom
     Belgium

                                                                                           7th grade                                                                               8th grade                                                                   Average


                                                                   TEST RESULTS IN MATHEMATICS (13-YEAR-OLD STUDENTS), 1995

                                                                                                                                               (:) Data not available
                                                                                                                                                Source: IEA, TIMSS.


14 | EUROPEAN REPORT ON THE QUALITY OF SCHOOL EDUCATION
The graph shows the results of an international math-          Some caution should be taken with the data with re-
ematics ability test: the Third International Mathemat-        gard to the comparability of the results of the partici-
ics and Science Study (TIMSS). TIMSS is a collaborative        pating countries. Attention should be drawn to some
research study conducted by the International Associ-          potential problems. Firstly, some of the participating
ation for the Evaluation of Educational Achievement            countries did not fulfil the guidelines for drawing the
(IEA). Tests were taken in 1995 by samples of, among           samples, thus the results cannot be guaranteed to be
others, classes from the two adjacent grades with the          fully representative. Secondly, it must be remembered
largest proportion of 13-year-old students (seventh            that the pupils in the participating countries are ac-
and eighth grades in most countries). In the survey,           customed to different types of test. The types of task
which covered 41 systems of education worldwide, the           presented in the TIMSS tests, and the manner in which
ability of seventh and eighth grade pupils to handle           the tests were conducted, may have been familiar to
mathematical symbols, terms and models, and their              some students but unfamiliar to others. This may ex-
mathematical thinking and problem solving abilities            plain some of the variations between countries. There
were all measured.                                             were also slight differences in age among pupils test-
                                                               ed. Furthermore national differences between curricu-
The findings of the TIMSS study will be complemented by        la might also have had an impact on results.
OECD’s PISA study (Programme for international student
assessment) which will be carried out later this year. The     Compared to their overall performance, almost all
first results of this study will be published in 2001.         countries did relatively better in some content areas
                                                               than they did in others indicating differences in the
The graph shows the average scores of seventh and              curriculum emphasis between countries. Significant
eighth grade pupils from each country. The two hori-           differences in results can, for example, be found be-
zontal lines show the international averages for the           tween geometry and algebra. The TIMSS survey points
European and pre-accession countries in the seventh            to a range of factors that appear to be linked to high
(lower line) and eighth grades (upper line). The differ-       achievement in mathematics, including the following.
ences between grades vary from 1 percentage point in
Belgium (Flanders) to 10 percentage points in France           • A clear positive relationship between a stronger
and in Lithuania.                                              liking of mathematics and higher achievement. How-
                                                               ever, even in some high-scoring countries such as the
European countries achieved very varied results, in            Czech Republic, Austria and the Netherlands, mathe-
terms of percentage of correct answers in the test. They       matics is not necessarily very popular, with more than
ranged from 65 % in the seventh grade (Belgium (Flan-          40 % of students reporting that they disliked it.
ders)) to 37 % (Portugal) and from 66 % in the eighth
grade (Belgium (Flanders) and the Czech Republic) to           • A strong positive relationship between achievement
43 % (Portugal). It is particularly interesting to note that   and home environment — better educated parents, the
central European countries such as Bulgaria, the Czech         availability of study aids at home such as dictionaries,
Republic, Hungary, Slovenia and Slovakia performed es-         computers and a study desk for the student’s own use.
pecially well. When the test results from the seventh and
                                                               There were other factors where the TIMSS survey could
eighth grades, shown here, are compared with those
                                                               establish no clear link with achievement. They includ-
from the fourth grade, also available in the TIMSS sur-
                                                               ed class size, number of instructional hours in class,
vey, they show a very similar pattern of results in terms
                                                               amount of homework and gender.
of the relative positions of the countries. This suggests
that the relative abilities in mathematics are established
early in the educational process.                              KEY POLICY ISSUES CONCERNING MATHEMATICS
In the light of this, however, it is surprising that there     The key policy issues set out here are based partly on
does not appear to be any strong connection within             international discussion of the results of TIMSS, but
countries between the TIMSS results for pupils in the          they are also linked to wider educational debate:
eighth grade and those in the final classes (12th or
13th grade). A very high level of performance among            The development of teaching methods which ensure
eighth grade pupils, in relation to other countries, does      that pupils have a positive attitude towards mathe-
not necessarily mean a comparably high level among             matics, and that they are motivated to learn mathe-
12th grade pupils.                                             matics and encouraged to study and apply mathemat-


                                                          EUROPEAN REPORT ON THE QUALITY OF SCHOOL EDUCATION | 15
ical laws independently. How can such a culture of
teaching and learning be developed and maintained
in the field of mathematics, and how can the impor-
tance of mathematics be demonstrated in order to
motivate pupils to learn?

The issue of positive and negative attitudes towards
mathematics which could influence students’ choices
of subjects studied in tertiary education. Many coun-
tries experience difficulties in attracting students to
technical and scientific studies. What experiences and
positive actions exist to encourage students to pur-
sue such fields of study, and to overcome negative
attitudes towards mathematics in this context?

Mathematics is considered to be at the very core of
the educational curriculum. High attainment levels in
mathematics are central for access to some key areas
of higher education and many professional careers.
But mathematical ability is a core sG .pne sc18.zens.9(s.)]TJT730.1108tiesss andabiTwknowledgeudis i
2. READING


 Reading skills play a central role in an individual’s learning at school. The ability to read
 and understand instructions and text is a basic requirement of success in all school sub-
 jects. The importance of literacy skills does not, however, come to an end when children
 leave school. Such skills are key to all areas of education and beyond, facilitating par-
 ticipation in the wider context of lifelong learning and contributing to individuals’
 social integration and personal development.

 The indicator is based on an IEA survey in which three areas of reading literacy were as-
 sessed: narrative prose, expository prose and documents. It concerns six different skills
 or processes related to these areas.


                                                                                                                                             % of items with a correct answer
80                                                                                                                                                                                                                                                                                                                           80

70                                                                                                                                                                                                                                                                                                                           70

60                                                                                                                                                                                                                                                                                                                           60

50                                                                                                                                                                                                                                                                                                                           50

40                                                                                                                                                                                                                                                                                                                           40

30                                                                                                                                                                                                                                                                                                                           30

20                                                                                                                                                                                                                                                                                                                           20

10                                                                                                                                                                                                                                                                                                                           10
                                                                                                        (:)                        (:)                                     (:)              (:) (:) (:)                                (:) (:)                        (:) (:)                       (:)              (:)
 0                                                                                                                                                                                                                                                                                                                           0
                                  New Länder
                                               Old Länder
         French com.
                       Denmark


                                                            Greece
                                                                     Spain
                                                                             France
                                                                                      Ireland
                                                                                                Italy
                                                                                                        Luxembourg
                                                                                                                     Netherlands
                                                                                                                                   Austria
                                                                                                                                             Portugal
                                                                                                                                                        Finland
                                                                                                                                                                  Sweden
                                                                                                                                                                           United Kingdom


                                                                                                                                                                                            Bulgaria
                                                                                                                                                                                                       Czech Rep.
                                                                                                                                                                                                                    Estonia
                                                                                                                                                                                                                              Cyprus
                                                                                                                                                                                                                                       Latvia
                                                                                                                                                                                                                                                Lithuania
                                                                                                                                                                                                                                                            Hungary
                                                                                                                                                                                                                                                                      Poland
                                                                                                                                                                                                                                                                               Romania
                                                                                                                                                                                                                                                                                         Slovenia
                                                                                                                                                                                                                                                                                                    Slovakia


                                                                                                                                                                                                                                                                                                               USA
                                                                                                                                                                                                                                                                                                                     Japan


     Belgium                     Germany
                                                                                                                     Average

                                                                     TEST RESULTS IN READING LITERACY (14-YEAR-OLD STUDENTS), 1991

                                                                                                                                       (:) Data not available
                                                                                                                                    Source: IEA, Reading literacy.


                                                                                                                                                                           EUROPEAN REPORT ON THE QUALITY OF SCHOOL EDUCATION | 17
The data for the proposed indicator comes from the         policy-makers can exert some influence on these re-
IEA. The tests were taken in 1991 by samples of the        sources, their distribution or their use. The most effi-
classes of the grades with the largest proportion of       cient of these variables relates to the presence of
9-year-olds and 14-year-olds in 32 systems of educa-       books in the community and parental cooperation
tion. In the longer term, as with mathematics and sci-     with the school.
ence, indicators from the PISA survey will be published
in autumn 2001. In addition, the IEA is preparing a
new study about reading literacy.                          KEY POLICY ISSUES CONCERNING READING
The graph above shows the mean percentages of items        At secondary school level, public libraries and book-
successfully answered by the sample of 14-year-old         shops can make an essential contribution to reading
students in each country. The horizontal line corre-       skills; the regular addition of new books to the school
sponds to the mean success percentage calculated for       library, the existence of a reading room and a teachers’
the European and pre-accession countries.                  library are worth considering. They can also play an
As the average age of students was not exactly the         important part in providing interesting reading mate-
same in the different countries, their scores may be       rial for pedagogic use. How can the number and
slightly underestimated (Italy, Hungary, Spain and Bel-    quality of books available to students — and also to
gium) or overestimated (Portugal and France).              teachers – be enriched?

The average score is 72 %. It is not always easy to        As is the case for computers (see the ‘students per
make sense of this kind of international comparison        computer’ indicator), a sufficient number of high-
without some sort of frame of reference to tell us, for    quality books is necessary, but this alone will not guar-
example, what ‘15 %’ actually means. One can analyse       antee high attainment levels in reading. The books
the data and see that, based on 14 identical items         must be used in the most efficient way in order to en-
from the test, the difference between the scores of        hance both students’ interest for and competence in
9-year-olds and 14-year-olds was around 24 %.              reading. How can teachers be supported in address-
Although this information should be treated with cau-      ing the needs of different age groups? How can the
tion it does provide a guideline — for example, if we      cross-curricular nature of reading be taken into
consider Belgium and Finland, separated by 15 per-         account in teacher training?
centage points, we can see that 15 percentage points       As in other domains, parental participation (see rele-
represents about two thirds of the average interna-        vant indicator) is important. How can parental partic-
tional progress observed between 9 and 14 years in the     ipation be achieved, particularly for students with
14 items referred to above (Elley, 1994: see Annex 2).     poor reading skills? How can parents be supported in
Analyses have been carried out in order to determine       their role?
what variables may be linked to the level of reading       Young people are increasingly faced with forms of me-
achievement, both between countries and within each        dia which include written material (advertising, televi-
country. It should, however, be stressed that although     sion, CD-ROM, and multimedia, for example). How can
statistical analyses show links between achievement        curriculum development and teacher training best
and some other variables, no country follows exactly       be managed in order to equip young people with lit-
the same pattern. The results point more to areas for      eracy skills for the future and to allow them to
further exploration than to definitive solutions for im-   analyse in a critical way the information conveyed
proving reading attainment.                                by the media?
• The countries’ averages are linked to some charac-
teristics of the home environment (such as the pres-
ence of books, newspapers, etc.).                          EXAMPLES OF NATIONAL INITIATIVES

• Some individual students’ characteristics, such as       (For more information see Annex 1)
gender, also play a part in reading performance.
                                                           Denmark — Efforts to increase the level of attainment
• The level of certain school resources is also associ-    in reading in compulsory education in Denmark by re-
ated with reading literacy achievement. Educational        inforcing the subject in the curriculum.


18 | EUROPEAN REPORT ON THE QUALITY OF SCHOOL EDUCATION
Germany — Newspapers in schools — over a period of
three months, students receive ‘their’ daily newspaper
(without paying for it). This is then used systematical-
ly within different subject matters at school.

Italy — The 1998 ‘Progetto lettura 2000’ programme
aims to promote the development of school libraries
and to encourage reading among students in all kinds
of school.

Sweden — Parents of students aged 10 to 12 are en-
couraged to spend half an hour per day reading a
good book with their child. The authorities have sup-
ported this initiative, providing money to buy interest-
ing books that both students and parents enjoy.


                                                      EUROPEAN REPORT ON THE QUALITY OF SCHOOL EDUCATION | 19
3. SCIENCE


 Science gives pupils the tools to investigate their environment and to experiment, thus
 increasing their ability to analyse and make sense of the world around them. It promotes
 curiosity and critical thinking about a wide range of issues such as the environment, liv-
 ing things, health and other issues. Science can also help pupils to develop an awareness
 of the inter-relationship between people and nature, and an understanding of the finite
 nature of the earth’s resources. At the level of European economy, scientific disciplines
 are the bases for much of the core foundations of business and industry. In a national
 perspective, well-trained researchers are indispensable to technological progress, the im-
 pact of which transcends national frontiers.


                                                                                                                                         % of items with a correct answer
80                                                                                                                                                                                                                                                                                                                             80

70                                                                                                                                                                                                                                                                                                                             70

60                                                                                                                                                                                                                                                                                                                             60

50                                                                                                                                                                                                                                                                                                                             50

40                                                                                                                                                                                                                                                                                                                             40

30                                                                                                                                                                                                                                                                                                                             30

20                                                                                                                                                                                                                                                                                                                             20

10                                                                                                                                                                                                                                                                                                                             10
                                                                                           (:) (:)                                                  (:)                                                               (:)                                               (:)
 0                                                                                                                                                                                                                                                                                                                             0
                                                                                                                                                                                   Scotland
                                             Germany


                                                                                                                                                                        England
      French com.
                    Flemish com.
                                   Denmark


                                                       Greece
                                                                Spain
                                                                        France
                                                                                 Ireland
                                                                                            Italy
                                                                                                    Luxembourg
                                                                                                                 Netherlands
                                                                                                                               Austria
                                                                                                                                         Portugal
                                                                                                                                                    Finland
                                                                                                                                                              Sweden


                                                                                                                                                                                              Bulgaria
                                                                                                                                                                                                         Czech Rep.
                                                                                                                                                                                                                      Estonia
                                                                                                                                                                                                                                Cyprus
                                                                                                                                                                                                                                         Latvia
                                                                                                                                                                                                                                                  Lithuania
                                                                                                                                                                                                                                                              Hungary
                                                                                                                                                                                                                                                                        Poland
                                                                                                                                                                                                                                                                                 Romania
                                                                                                                                                                                                                                                                                           Slovenia
                                                                                                                                                                                                                                                                                                      Slovakia


                                                                                                                                                                                                                                                                                                                 USA
                                                                                                                                                                                                                                                                                                                       Japan


                                                                                                                                                                        United
                                                                                                                                                                       Kingdom
      Belgium

                                                                                           7th grade                                                                              8th grade                                                                   Average


                                                                         TEST RESULTS IN SCIENCES (13-YEAR-OLD STUDENTS), 1995

                                                                                                                                            (:) Data not available
                                                                                                                                              Source: IEA, TIMSS.


20 | EUROPEAN REPORT ON THE QUALITY OF SCHOOL EDUCATION
As with mathematics, the proposed aggregated indicator          level does not necessarily imply that the school system
is taken from the Third International Mathematics and           is a good one; disparities between highest and lowest
Science Study (TIMSS) (see the ‘mathematics’ indicator          achievers in a particular country may still be very
for more detail about this study). The test covers five ar-     large. The gap could be linked to socioeconomic differ-
eas: earth science, life science, physics, chemistry, as well   ences as well as other factors (such as differences be-
as environmental issues and the nature of science. Stu-         tween curricula, differential selectivity, organisational
dents were expected to understand simple or complex in-         structure, etc.).
formation, to theorise, analyse and solve problems, to use
                                                                The study points to some variables which seem to be
tools, routine procedures, and scientific processes and to
                                                                related to the results. As concerns gender, boys per-
investigate the natural world. An analysis of how the test
                                                                form better than girls in all countries (fourth grade)
corresponds to the curriculum in different countries has
                                                                and significantly so in Austria, Hungary, Netherlands
shown substantial variations in the number of items
                                                                and the Czech Republic; and factors such as motiva-
which each country considers appropriate. However,
                                                                tion, status of scientific studies and jobs, and method-
when countries’ results in the test as a whole are com-
                                                                ological practices, also seem to be related to results.
pared with their results in a selection of items relevant to
their own curriculum, their relative positions in the study
are not significantly affected.
                                                                KEY POLICY ISSUES FOR DISCUSSION CONCERNING
The graph shows the average scores of seventh and               SCIENCES
eighth grade pupils from each country. The two thick
                                                                All citizens should to be able to access and use new
lines show the international averages for the European
                                                                technologies for their own benefit and for the eco-
and pre-accession countries in seventh (lower line) and
                                                                nomic and social improvement of the society. It is thus
eighth grades (upper line). The gap between the two
                                                                important to look not only at the average level of at-
averages (6.4 %) gives an idea of the difference be-
                                                                tainment, but also at the gap between higher and low-
tween the performances of the seventh and the eighth
                                                                er achievers. How can all students be encouraged to
grades students.
                                                                develop sufficient interest in science and in scien-
Some caution should be taken with the data. In some             tific thinking?
cases, the error due to sampling may be larger than the
                                                                It is crucial to distinguish between the contribution
difference between the averages. Thus, for example, the
                                                                made by schools, and other more fixed parameters
average in Greece (grade 8) cannot be considered to be
                                                                such as those resulting from social conditions. In order
different from the average in Germany (grade 7). As the
                                                                to reduce disparities and raise average attainment lev-
average age of students was not exactly the same in each
                                                                els, it is essential to focus on what schools and teach-
country, the scores of countries may be slightly under- or
                                                                ers can do. How can students learn to use the most-
overestimated. It is also important to take into account
                                                                efficient methodologies in experiencing science
the fact that some countries did not meet all the sample
                                                                through practical experiment?
criteria for one or more of the areas concerned.
                                                                In many countries, students’ interest in science, espe-
The graph shows some significant differences between            cially the physical sciences, is declining. As a result, the
countries. Among the European countries, the differ-            number of students taking science is dropping. What
ence between the highest-achieving country (the Czech           can we do to find out the reasons for this decline,
Republic, eighth grade: 64 %) and the lowest-achieving          and to increase the numbers taking science?
one (Cyprus, eighth grade: 47 %) is 17 %. If we consid-
er this difference in relation to the difference between
average performance in the seventh grade and the
                                                                EXAMPLES OF NATIONAL INITIATIVES
eighth grade, we see that a gap of 17 % represents ap-
proximately 2.7 years of student progress. Japan obtains        (For more information see Annex 1)
very high results at both levels, whilst the United States’
score is closer to the European mean, particularly at           Europe — ‘Women in science’ is a mobile exhibition
eighth grade.                                                   illustrating the history of science through the achieve-
                                                                ments of women in different periods of history and
It is important to consider the distribution of the re-         current trends in the feminist approach to science. It is
sults around each national average. A good average              organised by European networks and the European


                                                           EUROPEAN REPORT ON THE QUALITY OF SCHOOL EDUCATION | 21
Commission to promote equal opportunities at school,
at university and in careers.

Ireland — European Union Physics Colloquium — the
colloquium examined approaches to physics education
at upper secondary level in Ireland and eight other
European education systems.

Italy — 1999, ‘Progetto SET — SET project’ — aiming to
enhance pupils’ scientific and technological culture
and to raise their achievement levels, improving teach-
ing quality.

Slovakia — ‘Schola Ludus’ promotes science education
by interactive exhibitions touring the country.

Spain — The National Science Museum has a guide of
school programmes for permanent exhibitions, tempo-
rary exhibitions, workshops, guided visits, educational
materials and courses.


22 | EUROPEAN REPORT ON THE QUALITY OF SCHOOL EDUCATION
4. INFORMATION AND COMMUNICATION TECHNOLOGY
   (ICT)


In all European countries there is a broad consensus on the importance of new tech-
nologies. Information and communication technologies are not only having an impact
now but will affect the structure of human societies even more so in the future. They
are having an accelerating impact on the way we learn, live, work, consume, express and
entertain ourselves.

Learning will be ineffective if teachers fail to make coherent connections between learn-
ing in and out of school or if they do not exploit the vast potential of new multi-
sensory and interactive media.


                                                            Separate subject
   LI
                                                            Separate subject and used as a tool
                                                            for other subjects
   CY
                                                            Used as a tool for other subjects

                                                            Not included in the curriculum


        APPROACHES TO ICT DEFINED IN THE CURRICULUM — LOWER SECONDARY EDUCATION, 1997/98

                                        Source: Eurydice.


                                             EUROPEAN REPORT ON THE QUALITY OF SCHOOL EDUCATION | 23
Data on the provision and use of information and               In the longer term, data on ICT will need to go consid-
communication technology (ICT) will be a growth area           erably further to say something about how ICT is being
in the future. As more information becomes available           deployed and exploited for more effective pupil learn-
(for example through the IEA SITES study), indicators          ing, for out-of-school learning (homework and study),
will provide more detailed information on the effec-           for professional development of teachers, for school
tive deployment of ICT and skills acquired (as current-        improvement and systemic change.
ly in other areas such as mathematics or literacy). The
map below provides a picture of uses of ICT in Euro-
pean countries showing where it is not as yet included         KEY POLICY ISSUES CONCERNING ICT
in the curriculum, taught as a separate subject, or used
as a tool for other subjects.                                  Inclusion: With access to information freely available,
                                                               those who are motivated and skilled will increasingly
The map distinguishes four different uses of ICT. In most      benefit while those who are not will be at an increas-
of the eastern European countries ICT is treated as a sep-     ing disadvantage. The gap between the ‘haves’ and the
arate subject. In Norway, Sweden and Ireland it is seen as     ‘have nots’ is likely to widen significantly in the future.
a tool for use across the curriculum, while more typically     What forms of support or intervention can be pro-
in central European Member States (plus Iceland, Fin-          vided for the most disadvantaged and vulnerable
land and Latvia) it is both a subject and a tool. In Portu-    sections of the population?
gal, Cyprus and Italy it is not formally taught. In Finland,
decisions are made at local level and the treatment of         Special needs: Information and technology has a par-
ICT may, therefore, differ widely. There will also be dis-     ticularly significant role to play for children with spe-
parities within other countries despite the existence of       cial educational needs. What can be done to identify
national curricula or guidelines.                              good practice in this area and to disseminate it ef-
                                                               fectively for the benefit of special needs pupils, their
Caution has to be exercised in the interpretation of
                                                               parents and their teachers?
such data given that this is an area which is changing
so rapidly and in which data cease to be 100 % accu-           Teacher skills: One of the obstacles to development of
rate by the time they are published. Within a few years        ICT skills of pupils is lack of teacher skills or resistance
most, if not all, countries will be able to show that ICT      to the use of ICT among teachers who see it as a threat
permeates subjects across the whole curriculum and             to their jobs. How can teachers in every subject area
that pupils routinely use ICT for homework and study           be trained in skills which help them harness ICT to
in all subjects. The precedent set by Iceland, where all       make for better teaching?
senior pupils are provided with their own laptops, will
become increasingly commonplace and such individual            Pupil expertise: Expertise of children and young peo-
access will carry major implications for learning and          ple already far exceeds that of their teachers in many
teaching.                                                      instances. What might schools do to fully exploit the
                                                               skills of young people to support teachers and teach
Nonetheless, the data provide an important baseline
                                                               their fellow pupils?
from which to monitor progress and raise policy issues
for the future. Many countries have experimental and
pilot projects in the use of ICT which are not repre-
                                                               EXAMPLES OF NATIONAL INITIATIVES
sented on this map (see ‘Examples of national initia-
tives’, below).                                                (For more information see Annex 1)
Therefore, in interpreting data, caution needs to be ex-       Europe — The eEurope initiative aims to make digital
ercised with regard to the changing scene and wide             literacy one of the basic skills of every young Euro-
variations that may exist at local or school level. At         pean. eLearning is intended to implement the educa-
national level there may be no obvious curricular pol-         tion/training part of eEurope.
icy on the use of ICT. Imaginative cross-curricular ini-
tiatives may still be found at individual school level         Cyprus — The new ‘unified lyceum’ will have three key
and these may provide cutting-edge example for                 objectives: upgrading the ICT skills of pupils; upgrad-
countries in which ICT is more widespread and institu-         ing schools’ technological equipment; and improving
tionalised at national level.                                  staff competencies.


24 | EUROPEAN REPORT ON THE QUALITY OF SCHOOL EDUCATION
Estonia — In some Estonian schools, senior pupils are
required to spend four hours a week on mentoring and
tutoring younger children in ICT.

Hungary — Initiatives are underway to promote new
methods and teaching aids that make use of ICT tech-
nology in a range of school disciplines.

Italy — The ‘Programma di sviluppo delle tecnologie
didattiche 1997–2000’ was promoted to spread the
use of information and communication technologies
(ICT) and aims to improve the teaching/learning
processes.

The ‘Multilab’ is aimed at embracing teaching through
classroom use of computers, online and multimedia
technologies. More information is available on the In-
ternet (http://multilab.tin.it) (www.cede.it).

The Netherlands — ‘Knowledge net’ brings together
pupils, parents, teachers and cultural organisations
through a computer network which provides various
services including information, discussion groups and
technical facilities.

Poland — The ‘Interkl@sa’ programme aims to prepare
young people for the information society and to de-
velop the school as a modern centre for innovation
and creation.

Slovakia — The ‘Info-age’ project (www.infovek.sk) is
aimed at the improvement of ICT in primary and sec-
ondary schools.

Slovenia — In 1994 a long-term ICT programme
’Racunalnisko opismenjevanje’ (http://ro.zrsss.si/) was
   ˇ      ˇ
established to spread the use of information and com-
munication technologies.

Spain — All Spanish State schools have an Internet ac-
count. More information (in Spanish) can be found on
the Internet (http://www.pntic.mec.es).

Sweden — The Government offers in-service training
for school leaders and teacher teams to learn how to
use computers as a tool.


                                                     EUROPEAN REPORT ON THE QUALITY OF SCHOOL EDUCATION | 25
5. FOREIGN LANGUAGES


 Proficiency in several Community languages has become a prerequisite if citizens of the
 European Union are to benefit from the professional and personal opportunities open to
 them in the single market. It is, to say the least, paradoxical that people and ideas cir-
 culate less freely within today’s Europe than capital and goods. Difficulty with foreign
 languages, according to a Eurobarometer survey carried out in 1997, is by far the most
 feared problem when young Europeans contemplate working or studying abroad.
 Enlargement of the European Union in the future will make proficiency in modern
 languages even more important.

 Language proficiency is a key instrument for a common understanding between citizens
 of Europe and for exploiting the rich cultural heritage of Europe. The decision of the
 European Commission to make 2001 the ‘European year of foreign languages’ underlines
 the political importance attached to knowledge of foreign languages.


                                                                                             Knowledge of
                                                                                    a foreign language (%)

                             40        50             60    70                 80           90             100
                         0

                                                            I
                                                                                              FIN     S
                                                           P
                                                                                                             L
                        10                        E                                                   DK

                                                                       D                              NL
                                                           EL                  B
                                                                           A
                        20                                         F
                                                                 IRL

                        30


                                    UK
                        40

                        No wish to learn
                        a foreign language (%)


ATTITUDE TO AND SELF-ASSESSMENT OF FOREIGN LANGUAGES AMONG THE 15- TO 24-YEAR-OLD POPULATION,
                                             1997

                                                 Source: Eurobarometer.


26 | EUROPEAN REPORT ON THE QUALITY OF SCHOOL EDUCATION
It should first be made clear that, in the following        ulation say they can hold a conversation in it). Com-
paragraphs, the term ‘foreign languages’ refers to          petence and interest in foreign language learning
modern languages other than one’s mother tongue,            thus seem to vary greatly from one country to the
whether second languages, or actual foreign lan-            other and to depend on social and cultural factors,
guages as such. Despite the importance of learning a        among others.
foreign language, there is currently virtually no inter-
national data available about the linguistic compe-
tence of young Europeans. The next phase of the PISA        KEY POLICY ISSUES FOR DISCUSSION CONCERNING
survey will probably comprise a measure of the read-        FOREIGN LANGUAGES
ing comprehension in a foreign language as an inter-
national option.                                            It must be remembered that valid measures of young
                                                            people’s proficiency in foreign languages are required.
Pending more adequate information, we can use, with         However, the data available indicate strongly the im-
an appropriate degree of caution, the responses of          portance of several issues.
young Europeans to a Eurobarometer survey. In early
1997, at the request of the European Commission’s Ed-       • The choice of the languages to be taught is both
ucation, Training and Youth Directorate-General (XXII),     politically and pedagogically very important: if every
a sample of 9 400 young people, intended to be repre-       European language is considered a part of cultural
sentative of those aged between 15 and 24 in every          wealth and just as relevant as any other, active meas-
European country, was asked the following questions —       ures have to be taken. How can young people’s in-
‘Apart from your mother tongue, which of these lan-         terest in people of other cultural and linguistic
guages can you speak well enough to take part in a          communities, and in their languages, be devel-
conversation?’ and ‘Which ones, if any, would you like      oped?
to learn?’. The 11 official languages of the European
                                                            • Some strategies aimed at promoting linguistic di-
Union were proposed, as well as the answers ‘other’,
                                                            versity concern language teaching itself: for example,
‘none’ or ‘don’t know’.
                                                            the development of young children’s interest and com-
The graph shows, for each participating country, the        petency in several languages instead of introducing
percentage of young people claiming to be able to           them to only one language (‘language awareness’ ap-
speak at least one ‘foreign’ language and the percent-      proach). How can teachers’ competency in these
age of those who said that they did not want to learn       methods be increased?
a foreign language. It should be noted that the first
                                                            • Within the context of lifelong learning, but also
question in this survey addresses the perceived person-
                                                            in order to achieve good short-term results in lan-
al abilities, and not the actual capacities, of the young
                                                            guage learning, it is important to increase young peo-
people.
                                                            ple’s interest in foreign languages. How can pupils be
There seems to be a link between how widely spoken          made aware of the advantages of good language
a country’s official language is, and both the ability of   skills?
young people to speak another language and their
                                                            • Some degree of self-confidence is necessary in or-
desire to learn another. This leads to the formation of
                                                            der to speak another language and to interact with
two broad clusters seen on the graph, with countries
                                                            people whose language is different to one’s own
such as Denmark, Netherlands, Sweden and Finland in
                                                            mother tongue. How can foreign languages be
one (countries whose languages are relatively less
                                                            taught in a way which promotes students’ self-
widely spoken) and France, Germany, Spain, Ireland
                                                            confidence?
and Austria in the other (countries whose languages
are widely spoken). Greece, however, appears to be an       The age at which language learning starts, the amount
exception to this rule. The situation in the UK is clear-   of time spent on language learning in the curriculum
ly more extreme, and unlikely to be the result solely       and the languages which may be chosen can all play
of the linguistic dominance of the English language         an important part in the development of foreign lan-
(English is the most widely spoken language in the          guage competency. How should the curriculum be or-
European Union, the mother tongue of 16 % of the            ganised in order to make foreign language learning
population and an additional 31 % of the adult pop-         as efficient as possible?


                                                       EUROPEAN REPORT ON THE QUALITY OF SCHOOL EDUCATION | 27
EXAMPLES OF NATIONAL INITIATIVES

(For more information see Annex 1)

European Union — The aim of the ‘European label’ is
to help stimulate interest in language learning by
highlighting innovative language learning projects at
all stages of education and training.

Belgium — Department of Education offers courses in
18 languages, both European and non-European. Access
to these courses is made easy and very cheap. Some lan-
guage courses are available as distance learning

Bulgaria — In order to improve the teaching of foreign
languages, the Bulgarian Ministry of Education and
Science (MES) decided to create in 1996 a national
network of so-called ‘teacher methodologists’.

Hungary — The ‘European language portfolio’ (ELP) —
a personal document in which the students can record
their qualifications and other significant linguistic and
cultural experiences in an internationally transparent
manner.

Ireland — A project aimed at increasing the range of
foreign languages taken by students in secondary
school.


28 | EUROPEAN REPORT ON THE QUALITY OF SCHOOL EDUCATION
6. LEARNING TO LEARN


    The true test of the lifelong learner is the extent to which he or she is able to go on ac-
    quiring skills and knowledge in a wide variety of life situations, once formal education
    has come to an end. Effective learners know how to learn and have a repertoire of tools
    and strategies to serve that purpose.

    The flow of new information and the rise of international cooperation have increased
    the importance of such skills while the unpredictability and rapidity of change requires
    a closer connection between school education and lifelong learning. These are prerequi-
    sites for success in the academic world, the world of work and the society of the future.


Learning to learn encompasses intellectual skills, atti-     can be used as a starting point for debate at the Euro-
tudes and motivation. For example, attitudes to one’s        pean level. A number of countries have already estab-
self, perceptions of one’s own competence, ability to        lished systems to identify and measure ‘learning to
think about one’s thinking (metacognition), inferring        learn competencies’ or are developing them with the
meaning from a text, awareness of one’s own preferred        aim of understanding success and failure at school and
learning style, persistence in the face of difficulty, mo-   how these competencies can transfer to social and
tivation to learn.                                           professional life (see ‘Examples of national initiatives’,
                                                             below).
These are skills acquired and developed in various con-
texts — classrooms, homework, independent study,             For the purposes of inter-country comparison, there-
day-to-day problem solving situations. They are em-          fore, we may gather data to illustrate countries in
bedded in all subjects and areas of study and integral       which:
to ‘cross-curricular competencies’. The challenge is to      • learning to learn policies or guidelines already
help people to:                                              exist;
•     be reflective and self-critical learners;              • there is public dissemination (e.g. Ministry web
                                                             page, circulation of documents);
• access tools which help them become more effi-
cient and effective;                                         •   pilot initiatives are taking place;
• be able to transfer learning to learn skills from          • courses/programmes exist in pre-service and/or in-
one context to the next;                                     service teacher education;

• equip themselves to deal with new and unpre-               •   no policy or initiatives yet exist.
dictable situations in the future.
                                                             The indicator may take the form of a map of Europe
Data at European level do not as yet exist. This should,     plotting policy development, for example, by degrees of
however, be treated as a high priority. It is important      shading to illustrate the development and penetration
to identify examples of good practice and data which         of policy initiatives. These data will illustrate a spectrum


                                                        EUROPEAN REPORT ON THE QUALITY OF SCHOOL EDUCATION | 29
of practice, showing clusters of countries that have         •   for curriculum design and delivery?
made considerable progress in putting policy into place
and from which important lessons may be learned.             •   for teacher knowledge and skills?

In the longer term we could develop ways of gauging          •   for school leadership and management?
learning to learn competencies at student level              •   for teacher education — pre- and in-service?
through:

• students’ own assessments of their knowledge,
                                                             EXAMPLES OF NATIONAL INITIATIVES
confidence, and competency in this area;
                                                             (For more information see Annex 1)
• performance assessment using standardised tests
which provide comparable data on how students cope           Belgium (Flanders) — Learning to learn skills are al-
with new and unforeseen content.                             ready a compulsory aspect of the 6 to 18 years’ core
                                                             curriculum. They are presented as a cross-curricular
The effectiveness of learning to learn skills is demon-
                                                             theme to be integrated and applied in as many sub-
strated in situations to which students bring no prior
                                                             jects as possible.
content knowledge but in which they are able to
demonstrate that they know what to do in order               England — The Department for Education and Employ-
to acquire, analyse and use new information, and to          ment has published a report on thinking skills.
process new data.
                                                             Finland — Research has been conducted as a prelude
In 2001, PISA data in this area will be available for the    to developing a new form of national assessment.
first time and will provide a new source of European
level data. With a more informed body of data, future        Germany — Widespread curriculum revision is taking
indicators will identify the acquisition of learning to      place and pupils are being encouraged — through texts
learn skills at key stages of schooling. We can see from     and questionnaires — to reflect on their working
existing practice that different approaches are already      habits, their learning strategies, their ability to com-
in place and used at different ages and stages. In the       municate and cooperate.
Netherlands, for example, pilot initiatives are targeted
                                                             Italy — A repertoire of instruments has been developed
at 14 to15 year olds, in Italy for the 10 to 17 years’ age
                                                             to measure learning to learn competencies and to pro-
range, while in Flemish Belgium these skills are a part of
                                                             vide teachers with simple tools which they can use for
the compulsory curriculum for 6 to 18 year olds.
                                                             remedial and individualised intervention.

                                                             The Netherlands — A cohort study of 20 000 second-
KEY POLICY ISSUES CONCERNING LEARNING TO                     ary students is repeated every five years using a test
LEARN SKILLS                                                 developed to measure the general problem solving ca-
                                                             pacities of 14- to 15-year-old pupils.
Indicator data should provide a basis for considering a
number of important policy questions.

Significant progress is being made through pilot proj-
ects in different European countries. The challenge for
policy-makers is to identify, learn from and build on
the best. What short-, medium- and long-term ini-
tiatives will ensure that learning to learn skills be-
come a policy priority?

There is likely to be inertia and resistance, both at a
structural and cultural level. What are the main ob-
stacles to progress and how can they be overcome?

There are practical implications which flow from new
policy directions. What are the implications of new
priorities:


30 | EUROPEAN REPORT ON THE QUALITY OF SCHOOL EDUCATION
7. CIVICS


 All societies have a continuing interest in the way their young people are prepared for
 citizenship, and how they learn to take part in public affairs.

 In most countries, a considerable number of people tend nowadays to attribute problems
 such as violence, unemployment and criminality to those who are different, without a
 deeper understanding of the root causes of the issues.

 The question of what effective citizenship means and the role of formal education in
 building a civic culture is important not only for governments and policy-makers but
 also for the public in general.


IEA has recently assessed the attitudes and competen-                      nately the first report on the results of this study is
cies in the domain of civics of several thousand stu-                      not expected until February 2001. In the meantime, no
dents in the modal grade for 14 year olds (in 20 coun-                     recent international assessment of young peoples’ atti-
tries out of those which are directly concerned by the                     tudes and competencies in the domain of civics is
present report). The study examines young people’s                         available. However, Eurobarometer No 47.2, which re-
knowledge, beliefs and attitudes in different areas —                      ports the results of a survey of young people from 15
such as democracy, political authorities, rights and                       to 24 years old in the 15 European Union countries,
duties — in relation to citizenship, national identity,                    gives some interesting information in this domain. The
social cohesion, equal rights and tolerance. Unfortu-                      opinion survey was carried out in early 1997 at the re-


                                To be sent back (%)
                          20
                                            EL
                                                 B
                                        A
                                                                F
                                                          D
                          10                          I
                                                                                   DK

                                                                UK
                                                          P                        NL                    FIN
                                                                E              L
                                                                         IRL                 S
                           0

                                0                10                 20                  30       40              50
                                                                                                      Glad (%)


                               ATTITUDES OF THE 15- TO 24-YEAR-OLD POPULATION
                                          TOWARD FOREIGNERS, 1997

                                                          Source: Eurobarometer.


                                                                    EUROPEAN REPORT ON THE QUALITY OF SCHOOL EDUCATION | 31
quest of the European Commission’s then Directorate-        to make a more informed analysis of social and eco-
General XXII — Education, Training and Youth.               nomic problems, particularly in the light of human
                                                            rights considerations, among others?
The graph shows the respective percentages of young-
sters, in each of the 15 European countries surveyed,       Social diversity may both create problems and enrich
claiming that they agreed with two assertions about         social life. What should be done to promote social
foreigners: ‘I’m glad that foreigners live in (our coun-    and cultural diversity?
try)’ and ‘All foreigners should be sent back to their
                                                            In some countries, civics is taught as a specific subject,
country of origin’.
                                                            whilst in others, civic education is an integral part of
The graph shows the percentages of students agreeing        the curriculum. What are the advantages and the
with each assertion in each country. These are the re-      drawbacks of different approaches?
sults of an opinion poll and should therefore be treat-
                                                            Whether or not civics is a special subject, all teachers
ed with some caution, although it is difficult to find
                                                            should play a part in the civic education of their stu-
out about people’s attitudes without asking them and
                                                            dents. How can teachers be made more sensitive to
surveys offer the best option in some cases. More in-
                                                            the importance of their role in students’ develop-
depth information and analysis on such an important
                                                            ment as citizens?
topic would, however, be desirable.

On average, 15 % of young people surveyed claimed
that they were happy with the presence of foreigners,       EXAMPLES OF NATIONAL INITIATIVES
but 9 % felt that all foreigners should be sent back to
                                                            (For more information see Annex 1)
their country.
                                                            Greece and Cyprus — The ‘Parliament of adolescents’
Although there are no clear patterns or clusters appar-
                                                            is an annual project in which elected Lyceum pupils
ent from the graph a negative relationship can be seen
                                                            meet in the House of Parliament and discuss matters
between the numbers of respondents who said they
                                                            of concern of the young generation as well as matters
were ‘glad’ to have foreigners and the numbers of re-
                                                            of current importance to their country, Europe and the
spondents who thought foreigners should be ‘sent
                                                            world.
back’.
                                                            Italy — In all secondary schools a statute of students’
The percentages of those who said they are glad of the
                                                            rights and duties was introduced in order to enhance
presence of foreigners range from 7 % (Greece) to
                                                            democracy in schools and widen students’ opportuni-
45 % (Finland), and at the same time the percentages        ties.
arguing for foreigners to be sent back range from 1 %
(Sweden) to 19 % (Greece).                                  Poland — The KOSS programme has trained 2 000
                                                            teachers to teach civics to their students. It also cre-
The indicator highlights attitudes which are part of the    ates and publishes civics programmes.
school curriculum in a lot of countries but at the same
time reflects values that might be influenced by a
country’s economic situation and trends in immigra-
tion. According to J. Torney-Purta et al. (1999), social
diversity and the way it is understood by policy-mak-
ers and the public seems to have a great influence on
schools, with implications for curriculum content and
methodology.


KEY POLICY ISSUES FOR DISCUSSION CONCERNING
CIVICS

In the many countries with economic or social diffi-
culties, it is often tempting to blame foreigners for the
problem. What can be done to help school students


32 | EUROPEAN REPORT ON THE QUALITY OF SCHOOL EDUCATION
8. DROP-OUT RATES


 Europe has faced considerable challenges in recent decades. The development of our
 economies and the demands of an increasingly competitive society continue to leave
 some members of society by the wayside. Today’s learning or knowledge-based society is
 increasingly divided into those who have adequate skills and qualifications, and those
 who do not. In this rapidly changing environment, it is increasingly important for indi-
 viduals to be able to continue to update their knowledge and skills throughout their
 lives. Many believe that a minimum knowledge base is required in order for this to hap-
 pen, and that those who finish compulsory schooling without qualifications are conse-
 quently less likely to be able to participate effectively in life-long learning. Young peo-
 ple with a negative attitude to learning, and/or who leave school without qualifications
 are, therefore, likely to encounter significant problems later in life as a result.


     Rates (%)                                                                                                                                                                                                                                                                            Rates (%)
50                                                                                                                                                                                                                                                                                                    50

40                                                                                                                                                                                                                                                                                                    40

30                                                                                                                                                                                                                                                                                                    30

20                                                                                                                                                                                                                                                                                                    20

10                                                                                                                                                                                                                                                                                                    10
                                                                                                                                                                       (:)                                        (:) (:)
 0                                                                                                                                                                                                                                                                                                    0
                 Belgium


                                                                                                                                                      United Kingdom
                           Denmark
                                     Germany
                                       Greece
                                                Spain
                                                        France
                                                                 Ireland
                                                                           Italy
                                                                                   Luxembourg
                                                                                                Netherlands
                                                                                                              Austria
                                                                                                                        Portugal
                                                                                                                                   Finland
                                                                                                                                             Sweden


                                                                                                                                                                       Bulgaria
                                                                                                                                                                                  Czech Rep.
                                                                                                                                                                                               Estonia
                                                                                                                                                                                                         Cyprus
                                                                                                                                                                                                                  Latvia
                                                                                                                                                                                                                           Lithuania
                                                                                                                                                                                                                                       Hungary
                                                                                                                                                                                                                                                 Poland
                                                                                                                                                                                                                                                          Romania
                                                                                                                                                                                                                                                                    Slovenia
                                                                                                                                                                                                                                                                               Slovakia


 PERCENTAGE OF THE POPULATION OF 18 TO 24 YEAR OLDS HAVING ACHIEVED LOWER SECONDARY LEVEL OF
          EDUCATION (ISCED 2) OR LESS AND NOT ATTENDING EDUCATION OR TRAINING, 1997

                                                                                           (:) Data not available
                                                                                   Source: Eurostat, Labour force survey.


                                                                                                                                             EUROPEAN REPORT ON THE QUALITY OF SCHOOL EDUCATION | 33
Often, those who drop out of formal education lack                (30.2 %), Spain (30.0 %) and the United Kingdom
the fundamental skills needed to find employment.                 (31.4 %) show alarmingly high drop-out rates, while
They may have received no form of vocational training             drop-out rates in Germany (13.2 %), Austria (11.5 %)
and are therefore likely to have difficulty in finding a          and the Scandinavian countries in particular (Sweden
job. In addition, since pupils who drop out of school             9.6 % and Finland 8.5 %) fall significantly below the EU
without basic skills are generally less able and less will-       average. All of the central and eastern European coun-
ing than others to embark on a strategy of life-long              tries have drop-out rates below the EU average. The
learning, the threat of unemployment may be an on-                highest rate among these countries is Romania (19.8 %),
going factor for these people in the longer term. Life-           while the Czech Republic has the lowest rate at 6.8 %.
long learning is becoming essential to the employabil-
ity of the individual, and the number of jobs requiring           The indicator does not show, however, whether drop
no formal training is decreasing. This is particularly            out in individual countries is the result of pupils not
                                                                  passing examinations at the end of lower secondary
true of industrial countries with highly developed
                                                                  education or whether it is caused by a lack of oppor-
service sectors. In addition, young people without a
                                                                  tunities for vocational training following lower sec-
complete education may experience greater difficulty
                                                                  ondary education. Nor does it illustrate regional differ-
than others with regard to social integration and ac-
                                                                  ences in drop-out rates within individual countries.
tive participation in democratic society. Those who
leave school prematurely may consequently be at risk              The differences between countries are related to dif-
of marginalisation and social exclusion.                          ferences between educational systems but also to
                                                                  socioeconomic disparities. The better scores of some
The indicator presented here is based on the 1997
                                                                  northern countries, for instance, are often attributed
Labour force survey (Eurostat) and is an approximation
                                                                  to the organisation of their educational systems, in the
(proxy) of the drop-out rates from different Member
                                                                  sense that the less selective mechanisms in education
States (5). Drop-out is defined here as the share of the
                                                                  systems such as the integrated Nordic model could
total population of 18 to 24 year olds having achieved
                                                                  help to ease the transition between different school
the lower secondary level of education (ISCED level 2)
                                                                  environments when a pupil moves from primary to
or less and not attending education or training.
                                                                  secondary level. Such systems, which cater for pupils
As with other indicators, the data provided should be             of all age groups, also allow adults to enrol and are
treated with caution as they are not sufficiently differ-         therefore providers, to some extent, of ‘life-long learn-
entiated. In particular, they include pupils who did not          ing’, allowing upper secondary education to be ac-
gain qualifications at the end of lower secondary educa-          cessed by a wide range of people. It is thus easier for
tion as well as those who did, but who were unable to             school drop-outs to return to education even after the
obtain further qualifications or who did not wish to pur-         normal completion age for school education. Such a
sue further education or vocational training. An indica-          system is likely to impact on aggregate drop-out rates.
tor showing the percentages of pupils who did not ob-             A further explanation for the comparatively low drop-
tain qualifications at the end of compulsory schooling            out rates in Austria and Germany is the so-called ‘dual
would be preferable. The data required for this are not,          system’, whereby pupils undertake an apprenticeship
however, available.                                               within an enterprise as well as part-time vocational
                                                                  training. Such a system can help to allow less-able
The graph shows that drop-out rates in the EU remain              pupils, in particular, to obtain a vocational qualifica-
relatively high, with an average drop-out rate of 22.5 %.         tion, due to the high practical element involved.
There are, however, notable differences between Mem-
ber States. The data suggest that northern Member                 On the other hand, high drop-out rates might be
States perform better in combating the phenomenon                 linked to economic factors such as high unemploy-
than do other Member States. Portugal (40.7 %), Italy             ment rates, or disparities between urban and rural
                                                                  economies or between central and peripheral regions.
(5) The Community Labour force survey (LFS) is a harmonised       Research suggests, for instance, that young people at-
    sample survey of the inhabitants of the country at the time   tending school in rural areas are often indispensable
    of the survey. Due to the particular socioeconomic and geo-   to family businesses such as farming, and that they
    graphical situation of Luxembourg, the data on this indica-
    tor are not, therefore, comparable with those of the other    may be inclined to drop out of school in times of eco-
    countries.                                                    nomic hardship. In such regions, the skills required for


34 | EUROPEAN REPORT ON THE QUALITY OF SCHOOL EDUCATION
employment are often seen as being passed from gen-         France — A ‘new chance’ for young people who leave
eration to generation rather than from teacher to           school without qualifications. This programme aims to:
pupil. The link between formal education and success        improve procedures for identifying the young people
in the labour market is often less evident in such ru-      concerned and increase the available information
ral economies than it is in the service-oriented            about the issue of drop out.
economies.
                                                            Germany — Here it has proved useful to find local in-
                                                            dustry partners who can give potential drop-out pupils
KEY POLICY ISSUES CONCERNING SCHOOL                         the chance to gain experience in practical working, in
DROP-OUT                                                    parallel with their school-based learning.

Efforts to reduce the number of drop outs must take         The Netherlands — Early school-leaving in the Nether-
into account the three different sub-groups which           lands is challenged by a policy of cooperation between
make up drop outs. These sub-groups are:                    schools at a regional level.

• pupils who leave school before completing com-            Poland — An educational psychology service has been
pulsory schooling                                           set up and many educationalists and psychologists
                                                            have been recruited to identify the individual needs of
• pupils who do not achieve any qualifications at           pupils, to analyse the causes of failure and to find
the end of compulsory schooling                             ways to remedy them.

• pupils who do not receive professional training           Spain — Among other initiatives one is for 16 to 21
after leaving school with or without qualifications.        year olds who have not finished secondary education
                                                            or have no professional qualification for the labour
What kind of support can be offered to each of these        market.
groups in order to reduce the drop-out rates?
                                                            United Kingdom — ‘New deal’ is a key part of the UK
What is link between drop-out rates and policies re-        Government’s ‘Welfare to work’ strategy. It gives job-
garding children with special educational needs? Do         seekers aged 18 to 24, 25+ and those with disabilities
different countries’ arrangements for SEN provision         a chance to develop their potential, gain skills and ex-
affect their drop-out rates?                                perience and find work (http://www.newdeal.gov.uk).
At its extraordinary meeting in Lisbon, in March 2000,
the European Council set a target to halve by 2010 the
number of 18 to 24 year olds with only lower second-
ary level education who are not in further education
and training. How can this reduction in drop-out
rates be achieved?


EXAMPLES OF NATIONAL INITIATIVES

(For more information see Annex 1)

Bulgaria — In 1997, a project named ‘School for
everybody’ was launched. Its main goals were to build
up expertise for coping with this complex problem.

Europe — The ‘Second chance schools’ project offers
education and training to young people who lack the
skills and qualifications necessary to find a job or ben-
efit fully from conventional training. For further infor-
mation, see the web site
(http://europa.eu.int/comm/education/2chance/
homeen.html).


                                                       EUROPEAN REPORT ON THE QUALITY OF SCHOOL EDUCATION | 35
9. COMPLETION OF UPPER SECONDARY EDUCATION


  Completion rates of upper secondary education are — like low drop-out rates — impor-
  tant indications of successful education systems. The completion of upper secondary
  education is considered as increasingly important, not just for successful entry into the
  labour market, but also in allowing students access to the learning and training oppor-
  tunities offered by higher education. In addition, the contribution made by school edu-
  cation in helping young people deal with the demands of modern society should not be
  underestimated. The internationalisation of trade, the global context of technology, and
  above all, the rapid development of information technology have made societies
  increasingly complex. Successful participation in the learning society requires the basic
  building blocks offered by a secondary education.


      Rates (%)                                                                                                                                                                                                                                                                            Rates (%)
100                                                                                                                                                                                                                                                                                                    100

80                                                                                                                                                                                                                                                                                                     80

60                                                                                                                                                                                                                                                                                                     60

40                                                                                                                                                                                                                                                                                                     40

20                                                                                                                                                                                                                                                                                                     20
                                                                                                                                                                        (:)                                        (:) (:)
 0                                                                                                                                                                                                                                                                                                     0
                  Belgium


                                                                                                                                                       United Kingdom
                            Denmark
                                      Germany
                                        Greece
                                                 Spain
                                                         France
                                                                  Ireland
                                                                            Italy
                                                                                    Luxembourg
                                                                                                 Netherlands
                                                                                                               Austria
                                                                                                                         Portugal
                                                                                                                                    Finland
                                                                                                                                              Sweden


                                                                                                                                                                        Bulgaria
                                                                                                                                                                                   Czech Rep.
                                                                                                                                                                                                Estonia
                                                                                                                                                                                                          Cyprus
                                                                                                                                                                                                                   Latvia
                                                                                                                                                                                                                            Lithuania
                                                                                                                                                                                                                                        Hungary
                                                                                                                                                                                                                                                  Poland
                                                                                                                                                                                                                                                           Romania
                                                                                                                                                                                                                                                                     Slovenia
                                                                                                                                                                                                                                                                                Slovakia


                            PERCENTAGE OF YOUNG PEOPLE AGED 22 WHO HAVE SUCCESSFULLY COMPLETED
                                          AT LEAST UPPER SECONDARY EDUCATION, 1997

                                                                                            (:) Data not available
                                                                                    Source: Eurostat, Labour force survey.


 36 | EUROPEAN REPORT ON THE QUALITY OF SCHOOL EDUCATION
The indicator shows the percentage of young people            In view of the complementary nature of this indicator
aged 22 who have successfully completed upper sec-            and the indicator covering drop-out rates, the commen-
ondary education (ISCED 3). This level of education may       tary on the interpretation of the data obtained through
either be ‘terminal’ (i.e. preparing students for entry di-   the ‘drop-out’ indicator also applies to this one.
rectly into working life) or ‘preparatory’ (i.e. preparing
students for tertiary education). The figures for each
country indicate the percentage of young people aged
                                                              KEY POLICY ISSUES CONCERNING COMPLETION OF
22 who have successfully completed at least upper sec-
                                                              UPPER SECONDARY EDUCATION
ondary education. Since some students will achieve this
level in later years, the percentages reported for the in-    The failure to complete the upper secondary level of
dividual countries may yet rise in the older age groups.      education successfully cannot be considered in isola-
The data shown are based on the 1997 Labour force             tion from the rest of a young person’s school career.
survey (6).                                                   Nor can the impact of a country’s economic situation
                                                              be ignored. Measures aimed at increasing success rates
A number of factors should be remembered when con-
                                                              should therefore take both of these factors into ac-
sidering the information presented. The chart shows
                                                              count.
the percentage of 22 year olds who have successfully
completed upper secondary education (ISCED 3). The            • What efforts can be made to make upper second-
remaining group — those who have not attained this            ary education more attractive to all?
level — consists of two categories: those covered by
the ‘drop-out rates’ indicator, and those who are con-        • What are the challenges, in terms of quality of up-
tinuing to work towards an equivalent level of educa-         per secondary education, of the increased emphasis on
tion at the age of 22. The indicator does not show the        life-long learning? How should upper secondary level
relative proportions of these two groups. An indicator        education adapt to such developments, and to the
giving information on the number of pupils without            changes taking place in subsequent educational
final school-leaving qualifications at the end of ‘lower      stages?
secondary education’ (ISCED 2; see in addition the
                                                              • What are the effects of the balance between gen-
‘drop-out rates’ indicator) and an indicator describing
                                                              eral education and vocational training? Should oppor-
the successful completion of ‘upper secondary educa-
                                                              tunities for practical learning in the business and ad-
tion’ (ISCED 3) at a later point in time (for example at
                                                              ministrative sectors be expanded in order to increase
the age of 25), would be more suitable. The data which
                                                              young people’s motivation and give them a better un-
would be required for this are not, however, readily
                                                              derstanding of the connection between theoretical
available.
                                                              learning and practical activity?
The average percentage of those who successfully com-
pleted upper secondary education at the age of 22 years
was 71.2 % in the European Union in 1997. However,            EXAMPLES OF NATIONAL INITIATIVES
there are considerable differences between the various
                                                              (For more information see Annex 1)
countries. On the one hand, there is a group of countries
whose completion rates exceed 70 %, in some cases by a        Ireland — The ‘Leaving certificate applied’ — This alter-
significant amount; this category includes particularly       native learning programme focuses on the needs and
countries such as the Czech Republic, Poland and Slove-       interests of students using a range of methodologies.
nia, but also the northern European countries Finland         It seeks to develop in students an enterprising outlook,
and Sweden. On the other hand, there is a group of            self-confidence and other skills related to success in
countries whose completion rates fall below 70 %; this        the workplace.
category includes in particular southern European
countries such as Spain, Italy and Portugal and also the      Spain — The ‘Educación a distancia’ programme in-
United Kingdom.                                               tends to facilitate access to education to adults and
                                                              also to non-adults who due to personal, social, geo-
                                                              graphical or other exceptional circumstances cannot
(6) See footnote 5 on data concerning Luxembourg.             follow education at school with daily attendance.


                                                         EUROPEAN REPORT ON THE QUALITY OF SCHOOL EDUCATION | 37
10. PARTICIPATION IN TERTIARY EDUCATION


      The opportunities offered by tertiary education are becoming more and more important.
      The demands of today’s labour market are markedly different from those of even 10 or
      so years ago, and are continuing to evolve rapidly. If young people are to succeed in this
      increasingly competitive and global environment then it is crucial that they acquire the
      skills and competencies which will enable them to compete effectively with others.


(%)                                                                                                                                                                                                                                                                                                                       (%)
35                                                                                                                                                                                                                                                                                                                        35

30                                                                                                                                                                                                                                                                                                                        30

25                                                                                                                                                                                                                                                                                                                        25

20                                                                                                                                                                                                                                                                                                                        20

15                                                                                                                                                                                                                                                                                                                        15

10                                                                                                                                                                                                                                                                                                                        10

 5                                                                                                                                                                                                                                                                                                                        5
                                                                 (:) (:)         (:)                          (:)                                                                                     (:)      (:)                 (:)                                  (:)                                    (:)
 0                                                                                                                                                                                                                                                                                                                        0
                                                                                                                                                                                                               Iceland


                                                                                                                                                                                                                                                                        Norway
                                                                                                                                                   United Kingdom


                                                                                                                                                                                                                                                                                          Romania
                                                                                                                                                                                                                                                                                 Poland


                                                                                                                                                                                                                                                                                                    Slovenia
      Belgium
                Denmark
                          Germany
                                    Greece
                                             Spain
                                                     France
                                                              Ireland
                                                                        Italy
                                                                                Luxembourg
                                                                                             Netherlands
                                                                                                           Austria
                                                                                                                     Portugal
                                                                                                                                Finland
                                                                                                                                          Sweden


                                                                                                                                                                    Bulgaria
                                                                                                                                                                               Czech Rep.
                                                                                                                                                                                            Estonia


                                                                                                                                                                                                                                  Liechtenstein
                                                                                                                                                                                                      Cyprus


                                                                                                                                                                                                                         Latvia


                                                                                                                                                                                                                                                  Lithuania
                                                                                                                                                                                                                                                              Hungary


                                                                                                                                                                                                                                                                                                               Slovakia


                                    Students as a percentage of the 18 to 24 age group                                                                                         Students as a percentage of the 25 to 29 age group


      PARTICIPATION RATES IN TERTIARY EDUCATION, AS A PERCENTAGE OF TOTAL POPULATION, BY AGE GROUP —
                                          ISCED 5, 6 AND 7, 1996/97

                                                                                                                          (:) Data not available
                                                                                                                          Source: Eurostat, UOE.


  38 | EUROPEAN REPORT ON THE QUALITY OF SCHOOL EDUCATION
In recent years, higher education institutions have re-          most all cases, they are actually higher among women
sponded more and more to the changing demands of                 than among men.
the labour market, endeavouring to equip their students
with the specific skills they need to succeed. Many              As for other indicator areas, caution should be applied in
courses have moved away from a purely academic focus             drawing conclusions from the limited data available. The
towards a more vocational one, and the links between             very different tertiary education systems in the coun-
higher education and industry have consequently be-              tries from which data was collected, and the different
come clearer. For this reason, tertiary education is, more       characteristics of the countries themselves, make it es-
than ever before, seen as the means to taking part in the        pecially difficult to draw meaningful conclusions from
high-value-added international industries.                       this data. Nevertheless, some reasons for the varying
                                                                 participation rates in tertiary education between coun-
It is not necessarily desirable, however, to have ever           tries and between men and women can be suggested.
increasing levels of participation, if these are not
matched to national and international needs. Of key              • In some countries, training for certain occupations
importance is the need to match the supply of gradu-             takes place as part of upper secondary education or a
ates to current demand, and to predict trends in de-             further (post-secondary non-tertiary) level, whereas, in
mand in the light of the development of future new               other countries, training for these occupations takes
technologies, employment trends etc.                             place at the level of tertiary education.

The data presented in the graph show the proportion              • In certain countries the lack of opportunities for
of students in certain age groups participating in ter-          undertaking vocational training pushes young people
tiary education (ISCED 5, 6 and 7), as a percentage of           towards tertiary education. This may be the case par-
the total population of that age group. The graph                ticularly for young women, as the opportunities open
presents this information for two age groups: those              to them outside tertiary education may be less attrac-
aged up to 24, and those aged from 25 to 29 (7).                 tive than those open to young men.

It is clear from the data that the participation rates in        Participation rates may also be linked to the prevailing
tertiary education vary greatly between countries. In            conditions of the labour market. A weak labour market
the younger age group, participation ranges from 11 %            could lead to an increase in the number of students
in Romania to 32 % in Belgium; in the older age group            enrolling on higher education courses as those having
participation varies from 3 % in Estonia to 16 % in              difficulty in finding a job, or who have lost their jobs,
Greece. In all countries the participation rate in the           may decide to enrol instead in higher education. It
younger age group is higher than in the older one.               should be remembered, however, that enrolment rates
                                                                 and graduation rates cannot necessarily be equated.
However, there are countries in which the two rates              Equally, the effect of numbers enrolling in higher edu-
resemble each other far more closely than in other               cation may in turn impact on the labour market in a
countries. In Germany in particular there is scarcely            number of ways. High participation rates will ulti-
any difference between the two rates (14 % and 13 %              mately lead to a well-qualified workforce, making it
respectively). Countries such as Germany, where the              more difficult for those without a higher education
duration of courses is relatively long and the age at            qualification to find work in particular sectors. High
which students begin tertiary education is more varied,          participation rates spread across a wide age range will
will not have such high participation rates for a given          also have a significant impact on the proportion of the
age group as countries where courses are shorter and             population which is unavailable for work at any time.
the age of students is more uniform.

The diagram does not differentiate between participa-            KEY POLICY ISSUES CONCERNING PARTICIPATION IN
tion of men and women. Generally, however, it is the             TERTIARY EDUCATION
case that participation rates of men and women are
fairly similar in the majority of countries although, in al-     As a result of the very varied systems in place within
                                                                 the tertiary level of education, discussion of issues sur-
                                                                 rounding the data is of a fairly speculative nature. In
(7) Due to the particular socioeconomic and geographical situ-   summary, although the data collected using this indi-
    ation of Luxembourg, the data on this indicator are not
    comparable with those of the other countries. Most stu-      cator provide only limited information about trends in
    dents study outside the country.                             participation in higher education, the findings raise a


                                                            EUROPEAN REPORT ON THE QUALITY OF SCHOOL EDUCATION | 39
number of policy issues which could be explored in
more depth, in particular as follows.

• The relative proportions of men and women par-
ticipating in higher education. Why is the relative
number of women increasing? What is the male/fe-
male balance in certain subject areas (for example the
sciences and the humanities)? What is the effect of in-
creased participation in terms of unemployment rates
among women?

• The link between higher education and the labour
market. To what extent is the choice of higher educa-
tion a direct response to the labour market? Is a coun-
try’s production of graduates well matched to its over-
all needs (in terms of the labour market etc.)? Are
there too many or too few graduates in particular
countries? What is the effect on the labour market of
the trends in participation?

• The effects of high/low participation rates. What is
the relationship between participation rates among
older age groups and the productivity of the labour
market? Can the benefits of higher education be
measured in other ways, such as increased maturity,
social awareness etc.?

• The connection between secondary and tertiary
education. What are the possibilities in secondary edu-
cation for increasing the number of those — particu-
larly young women — aiming to take up take up math-
ematical, scientific or engineering studies?


EXAMPLES OF NATIONAL INITIATIVES

(For more information see Annex 1)

Ireland — Universities and other tertiary institutions
now have programmes which are aimed at redressing
the current imbalance in the representation of the
social classes in the universities and other tertiary
institutions.

Scotland — The ‘University of the Highlands and Is-
lands’ is making extensive use of remote access teach-
ing technology to link a number of centres with
students across the remote rural region of northern
Scotland.


40 | EUROPEAN REPORT ON THE QUALITY OF SCHOOL EDUCATION
11. EVALUATION AND STEERING OF SCHOOL EDUCATION


All educational systems require evaluation and steering. At national, local and school
level evaluation serves a number of essential purposes. It measures whether the educa-
tion system lives up to the objectives set. It offers diagnostic and formative information
for system managers, headteachers, teachers and a wider public. It opens up dialogue
and provides the basis for development planning and school improvement. Benchmarks
allow schools to measure themselves against other comparable institutions. They can be
used by inspectors or other external agents to compare the outcomes of individual
schools. They help focus on processes intended to achieve those outcomes

Evaluation may be either internal (self) or external, or a combination of the two. Both
forms of evaluation carry resource and training implications. With this in mind, most
European countries are seeking the best and most productive combination of the two
forms of evaluation. Ideally, external and self-evaluation complement each other as
vital sources of information.


                                                          Publication of the overall results
   LI                                                     of external certificated examinations
                                                          Publication of the overall results
   CY                                                     of external tests

                                                          No publication of overall results


MONITORING EDUCATION SYSTEMS AT PRIMARY AND/OR SECONDARY LEVEL — PUBLICATION OF THE OVERALL
                             RESULTS OF EXTERNAL TESTS, 1997/98

                                      Source: Eurydice.


                                           EUROPEAN REPORT ON THE QUALITY OF SCHOOL EDUCATION | 41
As the movement for more rigorous evaluation gathers        perspectives and raise questions about whether it is
momentum, more data will be forthcoming in the next         preferable to account for the performance of the sys-
few years. Currently we have information on the pub-        tem as a whole; whether to present comparative data
lication of examination and test results. These are         at school level; or whether to make public data which
sometimes used for diagnostic, or developmental, pur-       may have been designed to serve a diagnostic purpose.
poses, sometimes for accountability and reporting to
parents and public.                                         All European countries are seeking the best way in
                                                            which to report school performance and to reconcile
The country map shows how practice between Member           diagnostic/developmental purposes with accountabili-
States varies with respect to the publication of results    ty objectives. This is an area where policy is changing
of external tests.                                          rapidly and in which there will be different configura-
                                                            tions and more complex variations in the future as
The map shows a majority of countries, mainly pre-
                                                            schools and teachers become more confident in self-
accession countries, where there is no publication of
                                                            evaluation and external monitoring systems adapt
external test results. In 10 countries, including all the
                                                            their function and purpose to complement schools’
Scandinavian countries, there is publication of overall
                                                            own internal evaluations.
examination results. In four countries more detailed
publication of attainment testing is published. How-        A relatively short-term goal for the presentation of in-
ever, policies and practices in these four countries        dicators in the future could be to illustrate different
vary considerably.                                          patterns of internal and external evaluations for
                                                            schools across Member States. Much of this informa-
The UK (except Scotland), Spain, France and Belgium
                                                            tion is already available through the Standing Interna-
(French) are all represented by the same colour yet are
                                                            tional Conference of Inspectors (SICI) but some work is
very different not only in what they do but in their
                                                            needed before it can be presented in the form of an
policy purpose. In England, for example, results at key
                                                            informative indicator profile.
stages (ages 7, 9, 12, 14, 16 and 18) are published pri-
marily for accountability purposes and to raise stan-       A longer-term goal could be to provide data which
dards through encouraging parental information and          show the development of self-evaluation in Europe
choice. In France, by contrast, tests are administered      and its relationship to external evaluation. Such data
yearly for diagnostic purposes and examination results      will illustrate the nature of the balance between inter-
are published as benchmarks for schools to compare          nal and external evaluation and the role that each of
their own performance and thereby raise standards.          these plays in the steering and evaluation of school
Legislation prevents parental choice of school in the       systems.
State sector. In Spain, individual schools make their
data available but publication of results is intended to    As for other indicators, the data above provide a start-
provide information on standards overall and is based       ing point for a closer look at policy rationale, effec-
on a sample of schools. Scotland, in common with its        tiveness and viability.
other UK partners, publishes results of external exami-
nations at 16 to 18. Attainment test scores within the
national 5 to 14 programme are used both diagnosti-         KEY POLICY ISSUES CONCERNING EVALUATION AND
cally and for targets relevant to national standards.       STEERING OF SCHOOL EDUCATION

In a number of countries, for example Lithuania, Bul-       Reporting of data is not a stand-alone exercise. It is
garia and Portugal, piloting of new approaches is tak-      related to systems of monitoring, inspection and self-
ing place and policies are changing as a consequence.       evaluation, implicitly or explicitly conveying messages
The impact at school and classroom level cannot be          about purpose, policy and priority. What are the key
illustrated by a map but it is the attitudes and compe-     messages which should be conveyed through the
tencies of individual teachers which will put the effi-     publication of school performance data?
cacy of the policy to the test.
                                                            Monitoring schools’ performance is critical to raising
The publication of examination performance reflects a       standards for all pupils but it is both expensive and
belief in the importance of accountability to a wider       difficult to raise standards from the outside. What
public. However, the data highlight different policy        powers and roles should be given to schools in the


42 | EUROPEAN REPORT ON THE QUALITY OF SCHOOL EDUCATION
reporting of their own performance and how can             Scotland — In 1996, ‘How good is our school?’ was
that be achieved?                                          published. It is a toolkit for schools to use in self-eval-
                                                           uation, based on a set of 33 performance indicators.
As schools’ expertise in self-evaluation increases and     For more information, see the web site
their access to appropriate tools and strategies grows,    (http://www/scotland.gov.uk/structure/hmi/default.htm).
the role of inspection changes. What role is there — if
any — for external monitoring systems in these cir-        Spain — INCE (Instituto Nacional de Calidad y Evalu-
cumstances?                                                ación) was created to design evaluation systems for
                                                           the different types of education governed by the
The trend to publish performance data is likely to grow    LOGSE (new law for education).
rather than diminish and data will continue to serve
different purposes, such as: accountability, bench-
marking or informing parental choice. At what level
(individual school, school clusters, regional, national)
should reporting be focused in order to fulfil its
purposes most effectively and economically?


EXAMPLES OF NATIONAL INITIATIVES

(For more information see Annex 1)

Europe — Pilot project ‘Evaluating quality in school
education’, see the web site
(http://europa.eu.int/comm/education/poledu/
finalrep/rep.pdf).

Austria — Rich resource site on the Internet has been
established, for schools, allowing them to access infor-
mation, ideas, procedural proposals, instruments and
other support for schools’ programme development
and self-evaluation (http://www.qis.at).

Denmark — The Danish Evaluation Institute is a single
organisation for the evaluation of all levels of educa-
tion.

Hungary — A new pilot project the ‘Quality develop-
ment programme’ will be launched, involving more
then 400 public institutions. It will focus on operation
and management.

The Netherlands — About 0.5 % of the budget for pri-
mary and secondary education is spent on external
evaluation activities. Schools also have their own sys-
tems for internal evaluation of the quality of educa-
tion.

Portugal — PEPT (Education for every student), a
programme designed to foster students’ completion
of compulsory education, involves a self-evaluation
plan which includes an observatory with 15 indica-
tors relating to context, process, resources and out-
comes.


                                                      EUROPEAN REPORT ON THE QUALITY OF SCHOOL EDUCATION | 43
12. PARENT PARTICIPATION


 POWERS OF SCHOOL-LEVEL BODIES WHICH INVOLVE PARENT REPRESENTATIVES, IN THE PREPARATION OF THE
                 SCHOOL DEVELOPMENT PLAN — COMPULSORY EDUCATION, 1997/98

                                            Source: Eurydice.


44 | EUROPEAN REPORT ON THE QUALITY OF SCHOOL EDUCATION
Parental participation may, for example, take place          of schools (for example, school governors with business
through:                                                     experience and connections) the majority of parents
                                                             will not be motivated to become involved at that
• statutory advisory and decision-making bodies              macro level of school policy/practice. The large majori-
(e.g., school boards)                                        ty will wish to be involved where issues are of direct
•   evaluation of their schools                              relevance to their own children’s welfare and progress.

                                                             There are many good practices which involve a wider
•   voluntary associations (e.g., parent associations)
                                                             group of parents at school and classroom level and
• voluntary involvement in after-school activities           which illustrate how parents can make a significant
and clubs                                                    contribution to quality and standards. This indicator
                                                             provides a good starting point for further research and
• voluntary involvement in classroom activities (e.g.,       raises important policy questions about the role and
paired reading)                                              influence of parents. There are further implications for
                                                             the role of all stakeholders and how they work togeth-
• communications with the school and support of
                                                             er for school quality and improvement. European
their children’s learning and progress.
                                                             unions of parents, teachers, school students and head-
There are a number of areas in which parents may par-        teachers have already, through joint conferences, laid
ticipate.                                                    the groundwork for fuller and richer collaboration.

The map shows one significant aspect of parental in-
volvement, namely in the preparation of the school           KEY POLICY ISSUES CONCERNING PARENT
development plan:                                            PARTICIPATION

The data reveal that in five countries parents have de-      School development planning should not simply be a
cision-making powers in relation to the preparation of       mechanistic operation nor one which is confined to
the school development plan. This is generally through       school leaders or teachers. It benefits from the in-
a representative body such as a council or board. It is      volvement of parents and a wider constituency of
more common (18 countries) for parents to have a             stakeholders. What particular insights and added-
consultative or advisory function. In some countries,        value do parents bring to the process of school
for example the Netherlands, the council ratifies the        development planning?
plan developed by the authority. In four countries,
parents have no powers in respect of development             Parental involvement is often regarded as ‘a good
                                                             thing’ but it needs to be examined in the light of its
planning although in each of these four countries they
                                                             relevance for different purposes and contexts. In what
do have powers in other areas such as school rules,
                                                             areas of consultation and decision-making are par-
control or allocation of expenditure.
                                                             ent powers most relevant and useful? In what re-
Finland represents an exception because the powers of        spects might policy-makers wish to limit parental
councils vary so much between municipalities and the         powers as well as to increase them?
most recent legislation (1 January 1999) does not contain
                                                             Extending parent participation raises questions about
provisions for parental consultation in its school system.
                                                             other forms of stakeholder involvement. For example,
These data do not tell us about the strength and com-        what steps can be taken to give greater responsibil-
position of the parent constituency at school level, its     ity to school students and exploit the considerable
contribution or impact. Further research would be            resource and expertise they offer for improving
needed in order to identify the most effective forms of      schools?
membership and the most helpful ways in which par-
ents consult and speak on behalf of their constituen-
cies. Consultative bodies by their nature involve a          EXAMPLES OF NATIONAL INITIATIVES
minority of parents — those who volunteer and those          (For more information see Annex 1)
most likely to have the confidence, expertise or interest
in playing a role at whole school level. While parents       Europe — EPA’s ‘Training programme for parents’ is an
are a valuable resource and potentially powerful allies      example of how to improve quality through coopera-


                                                         EUROPEAN REPORT ON THE QUALITY OF SCHOOL EDUCATION | 45
tion and constructive dialogue between parents and
teachers at school level.

Germany — Seminars for parents aim to: inform them
of new developments in learning and teaching; estab-
lish consensus on areas of school; and to motivate
them to participate in wider policy as aspects of
school.


46 | EUROPEAN REPORT ON THE QUALITY OF SCHOOL EDUCATION
13. EDUCATION AND TRAINING OF TEACHERS


Years                                                                                                                                                                                                                                                                                                  Years
 8                                                                                                                                                                                                                                                                                                      8

 7                                                                                                                                                                                                                                                                                                      7

 6                                                                                                                                                                                                                                                                                                      6

 5                                                                                                                                                                                                                                                                                                      5

 4                                                                                                                                                                                                                                                                                                      4

 3                                                                                                                                                                                                                                                                                                      3

 2                                                                                                                                                                                                                                                                                                      2

 1                                                                                                                                                                                                                                                                                                      1

 0                                                                                                                                                                                                                                                                                                      0
                                                                                                                                                                    Czech. Rep.
                                                                                                                                                         Bulgaria


                                                                                                                                                                                                               Liechtenstein


                                                                                                                                                                                                                                                                                 Slovenia
                                                                                                                                                                                                                               Lithuania
                                                                                                                                             Scotland


                                                                                                                                                                                                                                                                                            Slovakia
        Belgium


                                                                                                                                              England


                                                                                                                                                                                  Estonia
                                                                                                                                                                                            Iceland


                                                                                                                                                                                                                                           Hungary


                                                                                                                                                                                                                                                                       Romania
                                                                                                                                                                                             Cyprus
                                                                                                                                                                                                      Latvia


                                                                                                                                                                                                                                                     Norway
                                                                                                                                                                                                                                                              Poland
                  Denmark
                            Germany
                              Greece
                                       Spain
                                               France
                                                        Ireland
                                                                  Italy
                                                                          Luxembourg
                                                                                       Netherlands
                                                                                                     Austria
                                                                                                               Portugal
                                                                                                                          Finland
                                                                                                                                    Sweden


                                                                                                                                          United
                                                                                                                                         Kingdom


  DURATION OF INITIAL EDUCATION AND TRAINING OF TEACHERS FOR LOWER GENERAL SECONDARY SCHOOLS,
                                            1999/2000

                                                                                                                              (:) Data not available
                                                                                                                                 Source: Eurydice.


                                                                                                                                                EUROPEAN REPORT ON THE QUALITY OF SCHOOL EDUCATION | 47
The data shown here are for initial teacher education              Lithuania, Poland, Romania and Slovenia to the equiv-
in lower general secondary schools only. Data exist for            alent of almost four years in Germany.
primary and upper secondary schools too (Eurydice key
                                                                   In addition, the time spent on pedagogic/practical train-
data, 2000). The graph illustrates similarities and dif-
                                                                   ing in relation to the total duration of the training dif-
ferences among countries in:
                                                                   fers widely. In Finland and the Netherlands, for example,
•   the length of initial training courses                         the equivalent of one year is spent on pedagogic and
                                                                   practical training. However, as a proportion of the total
• the balance in training between general education                length of training this represents approximately one
and pedagogic practical training.                                  sixth and one quarter of the total duration of the
                                                                   courses in these countries, respectively. By contrast, the
For the purposes of this indicator, two key distinctions           proportion of time spent on pedagogical/practical train-
have been made:                                                    ing in Germany is closer to two thirds.
• general or subject-based education and training:                 The data reveal very different patterns of provision but
knowledge related to what the trainee will be required             also conceal underlying complexities. They tell us
to teach, as well as general education which is direct-            nothing about the balance, nature or relevance of
ly linked to teaching                                              studies nor about their effectiveness in developing the
                                                                   core competencies required by teachers. As countries
• pedagogic and practical training: practical place-
                                                                   develop criteria for teacher competencies, they must
ments in schools, plus a range of other courses which
                                                                   look again at course provision and consider its rele-
are related to the teaching profession (for example,
                                                                   vance to teachers’ needs. Nor do the data show
theoretical courses on didactics, adolescent psycholo-             whether practical training is higher-education-based
gy, methodology, history of education, use of ICT).                or school-based, a factor which has major resource
In some cases it has been hard to separate the two                 implications.
categories, for example where general and pedagogic                The data relate only to lower secondary education. In
training are taught together. In these cases 50 % of               some, but not all countries, there will be different
time has been attributed to each in the graph.                     arrangements for primary and upper secondary
                                                                   teacher training.
The graph provides information on two aspects of ini-
tial teacher training: firstly, the length and, secondly,
the amount of time spent on pedagogic and practical                KEY POLICY ISSUES CONCERNING TEACHER
training. It should be noted that, for Germany and                 EDUCATION
Austria (8), only training for teachers in Gymnasium or
AHS (allgemeine höhere Schule) respectively is includ-             The balance of time given to teaching of subject
ed (two routes are possible, depending on the type of              knowledge and pedagogy is a matter of concern to all
secondary education).                                              countries. What steps must be taken to ensure that
                                                                   teacher training institutions achieve the optimum
With regard to the first aspect, the data show that the            balance in their teaching, taking into account cost-
most common length of course is five years (eight                  effectiveness?
countries) or four years (14 countries). In Germany,
Luxembourg and Italy, initial courses are longer than              The continuing professional development of teachers
average, while in Belgium and Liechtenstein they are               will be an increasing priority in the immediate and
                                                                   long-term future. What provision should now be
shorter.
                                                                   made to ensure that teachers update their knowl-
The graph also shows the amount of time spent on                   edge and practice?
pedagogic and practical training. This varies greatly,
                                                                   Teacher recruitment and retention is more of a prob-
from the equivalent of less than a year in Ireland,
                                                                   lem in some countries than others but the situation is
                                                                   liable to change as social and economic conditions
(8) In Austria, teacher training for the Hauptschule, which rep-   change. What can be learned from countries with a
    resents around 70 % of teachers, is a three-year non-uni-
    versity education where theoretical and practical elements     surplus of teachers, and from others with a shortage,
    are integrated and cannot be displayed separately.             in order to plan for the future?


48 | EUROPEAN REPORT ON THE QUALITY OF SCHOOL EDUCATION
As teacher retention becomes a more pressing priority,
issues of separate pay and promotion arrangements
for particularly effective or ‘expert’ teachers will be-
come a more pressing policy issue. What can be done
to reward and retain particularly effective teachers?


EXAMPLES OF NATIONAL INITIATIVES

(For more information see Annex 1)

Hungary — The in-service teacher training system —
The Act on Public Education has declared that each
teacher should participate in at least 120 contact-
hours of in-service teacher training during seven years
of practice.

Portugal — ‘Sailing through the Portuguese language’
is the name given to an initiative of the Department of
Secondary Education of the Portuguese Ministry of
Education, designed to provide teaching training using
Internet facilities.


                                                      EUROPEAN REPORT ON THE QUALITY OF SCHOOL EDUCATION | 49
14. PARTICIPATION IN PRE-PRIMARY EDUCATION


 Pre-primary education is significant in many different respects. Firstly, it makes an im-
 portant contribution to the emotional and cognitive development of children and to
 their social integration, thereby helping to prepare them for the school environment and
 reducing the likelihood of failure at school later on. Secondly, it plays an important part
 in supporting families. The changing role of the family as a social institution often
 means that parents are no longer at home full time and that, as a result, they are un-
 able to provide an adequate educational and social environment for their children.


Pre-primary education is defined as the initial stage of                                                                                                       Even if the significance of pre-primary education is
structured teaching. It is usually centre- or school-                                                                                                          acknowledged across Europe, opinions as to its educa-
based, designed to meet the educational and develop-                                                                                                           tional function differ. Some believe that children
mental needs of children of at least three years of age,                                                                                                       should play as long as possible, while others argue that
and provided by adequately trained staff.                                                                                                                      pre-school education is essential in order to facilitate


    Number of years                                                                                                                                                                                                                                                           Number of years
4                                                                                                                                                                                                                                                                                               4

3                                                                                                                                                                                                                                                                                               3

2                                                                                                                                                                                                                                                                                               2

1                                                                                                                                                                                                                                                                                               1

                                                                                                                                                                                                        (:)                                                        (:) (:)
0                                                                                                                                                                                                                                                                                               0
                Belgium


                                                                                                                                                     United Kingdom
                          Denmark
                                    Germany
                                      Greece
                                               Spain
                                                       France
                                                                Ireland
                                                                          Italy
                                                                                  Luxembourg
                                                                                               Netherlands
                                                                                                             Austria
                                                                                                                       Portugal
                                                                                                                                  Finland
                                                                                                                                            Sweden


                                                                                                                                                                      Bulgaria
                                                                                                                                                                                 Czech Rep.
                                                                                                                                                                                              Estonia
                                                                                                                                                                                                        Cyprus
                                                                                                                                                                                                                 Latvia
                                                                                                                                                                                                                          Lithuania
                                                                                                                                                                                                                                      Hungary
                                                                                                                                                                                                                                                Poland
                                                                                                                                                                                                                                                         Romania
                                                                                                                                                                                                                                                                   Slovenia
                                                                                                                                                                                                                                                                              Slovakia


                                                                                               ISCED 0                                                                           ISCED 1

                                           AVERAGE DURATION OF ATTENDANCE BY CHILDREN AGED THREE
                                             TO SIX AT AN EDUCATION-ORIENTED INSTITUTION, 1996/97

                                                                                                                 (:) Data not available
                                                                                                                 Source: Eurostat, UOE.


50 | EUROPEAN REPORT ON THE QUALITY OF SCHOOL EDUCATION
a child’s transition to primary school. Regardless of
                                                            KEY POLICY ISSUES CONCERNING PARTICIPATION IN
these different approaches of individual countries, it is
                                                            PRE-PRIMARY EDUCATION
the case that participation rates have been increasing
markedly during the last 30 to 40 years in almost all       As participation in pre-primary education increases
European countries.                                         across Europe, it is increasingly important to ensure
                                                            that the links between pre-primary and primary insti-
The indicator provides information about the average        tutions are strengthened. It is widely acknowledged
attendance of children aged three to six years at pre-      that early measures can play a significant part in re-
primary (ISCED 0) and primary (ISCED 1) education-          ducing school ‘failure’ in later years. What measures
oriented institutions during 1996/97. The data used are     can be taken in order to facilitate successful learn-
based on information compiled by Eurostat using the         ing at primary level and beyond, and to ensure that
results of the UOE data collection and population statis-   the transition from playful learning in the pre-
tics. They take into account the fact that compulsory       primary setting to more formal learning within the
primary education begins earlier in some countries than     school setting is successful?
in others. The graph does not, however, provide infor-
mation about whether attendance at the institution is
                                                            EXAMPLES OF NATIONAL INITIATIVES
full time (all day) or part-time (half a day).
                                                            (For more information see Annex 1)
The diagram shows that a considerable number of
countries are able to offer children a place for three      Italy — In Italy, three initiatives concerning quality in
full years of pre-primary education. Belgium, Denmark,      infant education have been promoted by the Ministry
France, Italy, Hungary and Sweden are among these           of Education and by the National Institute for the
countries. In many countries (including Austria, Ger-       Evaluation of Education Systems.
many and the Netherlands), pre-primary places for           Luxembourg — All children aged between four and six
children aged over three are only available for two to      years are obliged to attend institutions of pre-primary
three years. In other countries (such as Finland, Greece    education. In addition, a third of three-year-olds cur-
and Portugal), however, a child would, on average,          rently attend these institutions.
spend less than two years in the pre-primary sector. In
                                                            Netherlands — In the Netherlands, two experimental
evaluating the differences between countries, it must
                                                            programmes have been implemented for early child-
be taken into account that in some, primary education
                                                            hood education with a view to stimulating the cogni-
begins at a comparatively very early age, meaning that
                                                            tive, social–emotional and linguistic development of
that fewer pre-primary places are required. This applies    disadvantaged children aged between three and six
particularly to the United Kingdom.                         years.
The information presented in the chart does not show
whether pre-primary provision in each country corre-
sponds to parental demand. Theoretically it is conceiv-
able that in countries with comparatively low partici-
pation, supply meets demand more closely than in
some of the countries with high participation.

The data illustrated in the chart show that the major-
ity of the countries attach high importance to pre-
primary education. Even if attendance at institutions is
generally voluntary among this age group, there is an
emerging trend for childcare to be provided for almost
all children of three years and older. This indicator
does not provide information about the educational
content of the programmes offered by institutions in
the various countries.


                                                       EUROPEAN REPORT ON THE QUALITY OF SCHOOL EDUCATION | 51
15. NUMBER OF STUDENTS PER COMPUTER


  The information society will not only open up new channels of communication amongst
  people, but it is likely to have a considerable impact on the way we live, work, consume,
  interact with government as well as express and entertain ourselves.

  If every European citizen is to be able to use computers effectively, schools must offer
  all students the opportunity of learning to use them. Moreover, if the potential of the
  Internet and educational software is to be fully exploited by teachers and students, a
  sufficient number of effective and sufficiently up-to-date computers must be available.

  It should not be forgotten, however, that infrastructure in itself does not guarantee the
  development of high-level competencies by students. Schools’ organisation, the man-
  agement of technology, the use of high-quality software, and above all teachers’ com-
  petencies are all important factors (see also the indicator about ICT).


      Number of students                                                                                                                                                                                                                                                                 Number of students
      per computer                                                                                                                                                                                                                                                 880                       per computer
                                                                                                                                                                                                                 339
                                                                                                                                                                                238                                216
150                                                                                                                                                                                                                                                                                                               150

120                                                                                                                                                                                                                                                                                                               120

 90                                                                                                                                                                                                                                                                                                               90

 60                                                                                                                                                                                                                                                                                                               60

 30                                                                                                                                                                                                                                                                                                               30

                                                 (:) (:) (:)                   (:) (:) (:)                     (:) (:) (:) (:)                            (:) (:) (:)         (:)                      (:)                  (:)                           (:)         (:)                  (:)      (:)
  0                                                                                                                                                                                                                                                                                                               0
          French Com.
                        Flemish Com.


                                                                                                                                                                   Scotland
                                                                                                                                                                    England
                                       Denmark
                                                 Germany
                                                   Greece
                                                            Spain
                                                                    France
                                                                             Ireland
                                                                                       Italy
                                                                                               Luxembourg
                                                                                                            Netherlands
                                                                                                                          Austria
                                                                                                                                    Portugal
                                                                                                                                               Finland
                                                                                                                                                         Sweden


                                                                                                                                                                               Bulgaria
                                                                                                                                                                                          Czech Rep.
                                                                                                                                                                                                       Estonia
                                                                                                                                                                                                                  Cyprus
                                                                                                                                                                                                                           Latvia
                                                                                                                                                                                                                                    Lithuania
                                                                                                                                                                                                                                                Hungary
                                                                                                                                                                                                                                                          Poland
                                                                                                                                                                                                                                                                    Romania
                                                                                                                                                                                                                                                                              Slovenia
                                                                                                                                                                                                                                                                                         Slovakia


                                                                                                                                                                                                                                                                                                          Japan
                                                                                                                                                                                                                                                                                                    USA


                                                                                                                                                                   United
                                                                                                                                                                  Kingdom
         Belgium

                                                                                                                          1995 TIMSS                                                                   1998 SITES


                                 NUMBER OF STUDENTS PER COMPUTER — LOWER SECONDARY SCHOOL, 1995 AND 1998

                                                                                                          (:) Data not available
                                                                                                Source: IEA, TIMSS (OECD–OCTO) & SITES.


 52 | EUROPEAN REPORT ON THE QUALITY OF SCHOOL EDUCATION
The number of students per computer in the schools         United States also have a high number of computers:
where eighth grade students are enrolled was measured      Japan (27; 14) and United States (16; –).
both in 1995 (IEA–TIMSS) and in 1998 (IEA–SITES).
                                                           According to SITES, central and eastern European
The above graph shows the number of computers at a         countries (Bulgaria, Lithuania, the Czech Republic,
particular time (in a domain in which changes are tak-     Slovenia and Hungary) are less well-equipped than
ing place very rapidly). The information about the         most others. However, Cyprus also ranks very low, but
number of computers was derived in different ways in       the situation seems to be changing very fast in those
different surveys. In TIMSS, the issue addressed was       areas: between 1995 and 1998, the decrease in num-
the number of computers ‘available for use by teach-       ber of students per computer ranged from 23 %
ers or students’ in the school, whereas in SITES it was    (Lithuania) to 70 % (Slovenia).
the number of computers ‘available for use by stu-
                                                           It is important to emphasise that the indicator repre-
dents in the entire school’. The ratios may be seen as
                                                           sents an average, concealing very different situations
fairly close and comparable, although not strictly iden-
                                                           in individual schools: a fairly similar level of equip-
tical. OECD (1998) underlines that, in TIMSS, the indi-
                                                           ment in all schools, or possibly very well-equipped
cator may apply to a slightly different population. In
                                                           schools alongside schools without any access to new
addition, it should be noted that some countries did
                                                           technologies.
not satisfy the IEA sampling requirements.
                                                           The data clearly show a trend towards an improvement
The statistics illustrated do not provide information
                                                           of ICT resources in lower secondary schools. The resourc-
about the adequacy of computers in relation to cur-
                                                           ing of schools appears to depend on the wealth of the
rent requirements — for example connection to Inter-
                                                           country, but the relation is not a simple one: major
net, or ability to run powerful software — nor about
                                                           progress made by several countries between 1995 and
their actual use. Moreover, the indicator could vary ac-
                                                           1998 shows that solutions to a lack of resources can be
cording to the level of the education system: the ratio
                                                           found, in some cases, through partnership.
of students to computers is considerably more
favourable at upper secondary level than at lower sec-
ondary education (nine countries provided information
about both levels).                                        KEY POLICY ISSUES FOR DISCUSSION CONCERNING
                                                           THE NUMBER OF STUDENTS PER COMPUTER
The graph shows that the range of countries’ scores is
very large in both studies: from nine (Scotland) to 880    Faced with the necessity of providing expensive equip-
(Romania) in TIMSS, and from 9 (Denmark) to 238            ment to a large number of schools, some educational
(Bulgaria) in SITES.                                       systems turn to a partnership approach, in which the
                                                           partner organisation must benefit in some way from
In every country which took part in both surveys, the      its contribution but must respect national rules re-
availability of computers in schools rose between 1995     garding school education. (It may not, for example, in-
and 1998. In those European or pre-accession coun-         terfere with the curriculum.) Exchange of experiences
tries which took part in both surveys, the number of       in this area could eventually help countries less well-
students per computer decreased from 90 to 55 on av-       equipped to find a means of improving their resources.
erage, that is 39 % in less than four years. It may be     How would it be possible to create partnership with
assumed that a similar decrease also took place in the     institutions or organisations which could help to in-
other countries.                                           crease the availability of computers in schools? How
                                                           can schools be guaranteed a real long-term benefit
Eight of the participating countries, among which
                                                           from such an approach?
three are northern, had fewer than 20 students per
computer in at least one survey. The number of stu-        As technology changes rapidly, it is wise to bear in
dents per computer is shown in brackets, according to      mind from the outset the need to upgrade computers,
TIMSS; then SITES; ‘–’ means that the country did not      replace outdated models, or repair faulty machines. It
take part in the survey): United Kingdom (11 for Eng-      may be preferable to provide the schools with a small-
land and 9 for Scotland; –), Denmark (17; 9), Austria      er number of computers in the first instance, in order
(19; –), Sweden (19; –), Finland (–; 10), Luxembourg (–;   to ensure that the hardware remains usable and at a
12), Italy (–; 16) and France (29;17). Japan and the       suitable level of performance over time. How can


                                                      EUROPEAN REPORT ON THE QUALITY OF SCHOOL EDUCATION | 53
schools ensure that their equipment remains appro-
priate while costs are kept at a manageable level?

Hardware alone cannot guarantee efficient use of ICT
in schools; teachers must be able to use ICT effective-
ly themselves. How should teacher training in this
field be organised?

The importance of computer skills in today’s society is
widely recognised. How should the use of computers
in primary and secondary schools be organised in
order to ensure that pupils acquire these skills?


EXAMPLES OF NATIONAL INITIATIVES

(For more information see Annex 1)

Belgium (French) — 1998 partnership offering all pri-
mary and secondary school a ‘cyber centre’: computers
and facilities to connect to Internet.

Estonia — The ‘Tiger leap’ programme is a national tar-
get programme with the overall objective of improving
the educational system in Estonia through the intro-
duction of modern information and communication
technologies (http://www.tiigrihype.ee/english).

Italy — 1999, companies and banks provided schools
with their old (but perfectly working) computers.

Portugal — New regulations on school administration
and management, issued in 1998, created clusters of
schools (agrupamentos) which allow for the sharing of
human as well as material resources.


54 | EUROPEAN REPORT ON THE QUALITY OF SCHOOL EDUCATION
16. EDUCATIONAL EXPENDITURE PER STUDENT


     The share of total financial resources devoted to education is a key decision for nation-
     al governments. It is an investment with long-term returns, and most governments con-
     sider it to be something which impacts on several key political challenges such as social
     cohesion, international competition, and sustainable growth.

   The chart summarises educational expenditure per stu-                                                  meals, transport and other welfare services, but do not
   dent, differentiated according to level of education,                                                  generally include expenditure on student fees. Expen-
   namely primary (ISCED 1), lower and upper secondary                                                    diture for research is not included if it is carried out by
   (ISCED 2, 3 and 4) and tertiary education (ISCED 5 and                                                 separate research institutions with a purely adminis-
   6). The information is based on the UOE finance data                                                   trative link to universities.
   provided by countries for the financial year 1997; in-
   formation is presented for EU countries only, as data                                                  A straightforward comparison of expenditure per pupil
   for the remaining countries were unavailable.                                                          is problematic on the basis of these figures. It would
                                                                                                          not, for example, take into account national variations
   The data cover only expenditure on public institutions.                                                in the costs of educational resources of comparable
   They include expenditure for ancillary services such as                                                quality. A teacher in one country could incur greater


         PPS index                                                                                                                                                                           PPS index
12 000                                                                                                                                                                                                   12 000

10 000                                                                                                                                                                                                   10 000

 8 000                                                                                                                                                                                                   8 000

 6 000                                                                                                                                                                                                   6 000

 4 000                                                                                                                                                                                                   4 000

 2 000                                                                                                                                                                                                   2 000
                                                                                                                                                                                    (:)   (:)
    0                                                                                                                                                                                                    0
                                                                                                                                                                                           Japan
                                                                                                                                                                                    USA
                                                                                                                                                                United Kingdom
                 Belgium

                           Denmark

                                     Germany

                                               Greece

                                                        Spain

                                                                France

                                                                         Ireland

                                                                                     Italy

                                                                                             Luxembourg

                                                                                                          Netherlands

                                                                                                                        Austria

                                                                                                                                  Portugal

                                                                                                                                             Finland

                                                                                                                                                       Sweden


               Primary education                                                        Secondary education                                                                      Tertiary education

              EXPENDITURE PER PUPIL/STUDENT (PPS) IN PUBLIC INSTITUTIONS BY LEVEL OF EDUCATION, 1997

                                                                                   (:) Data not available
                                                                                   Source: Eurostat, UOE.


                                                                                             EUROPEAN REPORT ON THE QUALITY OF SCHOOL EDUCATION | 55
expenditure than a teacher in another country as a re-      A number of observations, beyond those already dis-
sult of higher salary costs. However, the work of a         cussed, can be made on the basis of the data shown.
teacher in the first country is not necessarily of better   Even taking into account the differences in prosperity
quality than that of a teacher in the second country.       between countries, the priority given to education
The reason for differences in expenditure can be at-        seems to vary considerably. Wealthier countries seem
tributed largely to differences in salary levels. Howev-    to be able to ‘afford’ to make education a priority. It is
er, factors such as the number of students enrolled and     clear that different countries pursue different strate-
the different duration of studies also have a decisive      gies regarding expenditure on education. In the major-
influence in the amount of educational expenditure          ity of countries, expenditure per student increases in
per student.                                                line with the age of students. The variation in funding
                                                            levels between the different levels of education within
The graph shows clearly that expenditure per head dif-      individual countries is quite marked. In Denmark, for
fers greatly between individual countries. Greece, for      example, expenditure on each of the three stages is
example, has rather low levels of expenditure, while        quite similar, whereas there are clear differences in the
countries such as Austria have above average expendi-       funding allocated to the three stages in the Nether-
ture. The extent of the differences between the coun-       lands, where the difference between secondary and
tries can be demonstrated clearly by taking the exam-       tertiary level is explained by the inclusion of research
ple of secondary education. Greece spends 2 150 PPS         expenditure.
(purchasing power standards expressed in ecus) on
each pupil, whereas Luxembourg spends 10 009 PPS.
Between these two extremes lies a group of countries        KEY POLICY ISSUES CONCERNING EDUCATION
with relatively low levels of expenditure, including        EXPENDITURE
countries such as Ireland (3 637 PPS) and the United
Kingdom (3 808 PPS), as well as a group of countries        This comparative overview of expenditure on educa-
with comparatively high levels of expenditure on sec-       tion, combined with a knowledge of the situation of
ondary education, such as Austria (7 676 PPS), Den-         the economies of the different countries, gives rise to
mark (6 699 PPS) and France (6 501 PPS). With respect       the following questions regarding the financing of
to the comparatively very low level of expenditure in       education:
Germany (4 196 PPS) it must be taken into account
                                                            • How, and according to which criteria, should
that training within the dual system of the upper sec-      priorities be set — particularly with respect to the
ondary level is financed to a considerable extent by        different levels of education?
business, and the expenditure is not, therefore, includ-
ed here. Under the dual system, approximately one           • How can we make sure that expenditure on
third of students’ training takes place in schools which    education is an investment?
are financed by the State, and two thirds in companies
                                                            • What is the role of the private sector in funding
which are not normally publicly funded.
                                                            education, especially in the context of life-long
The differences between countries can be explained in       learning? Is the contribution of private sector fund-
part by their differing levels of prosperity. Neverthe-     ing an opportunity or a danger, particularly for the
less, it is interesting that in those countries which had   less wealthy countries?
very high levels of expenditure per pupil, expenditure
                                                            • What is the implication of the expansion of life-
also represents a relatively large proportion of the
                                                            long learning on education expenditure? Who will
gross domestic product per head of the population. In
                                                            meet the costs of this expansion: the State, the in-
Denmark and Austria, expenditure per pupil on educa-
                                                            dividual participant, the private sector?
tion comprised 28 % and 33 % respectively of the
gross domestic product per head of the population in        • Is the balance of expenditure between the dif-
1995, taking into account the higher prosperity of          ferent educational levels right? What are the priori-
these countries, whereas it represented 16 % in             ties in terms of funding? What are the consequences
Greece, 19 % in Ireland and 24 % in the United King-        of increasing funding at local/regional level? How
dom in that year (source: Education at a Glance,            could this affect the quality of educational estab-
1998).                                                      lishments?


56 | EUROPEAN REPORT ON THE QUALITY OF SCHOOL EDUCATION
EXAMPLES OF NATIONAL INITIATIVES

(For more information see Annex 1)

Scotland — New public–private partnership arrange-
ments allow local authorities to fund school re-build-
ing programmes, which they otherwise would not have
been able to fund on such a scale.


                                                    EUROPEAN REPORT ON THE QUALITY OF SCHOOL EDUCATION | 57
ANNEXES


EUROPEAN REPORT ON THE QUALITY OF SCHOOL EDUCATION | 59
1. EXAMPLES OF NATIONAL INITIATIVES


                                                          France
1.   MATHEMATICS
                                                          In France a national ‘observatory’ for mathematics
Austria                                                   teaching and achievement has been developed jointly
                                                          by the Mathematics Teachers Association (APMEP) and
In Austria, as a consequence of the poor results of       the National Institute for Pedagogical Research (INRP).
Austrian upper secondary students — different from        Surveys carried out over 10 years have produced many
the students of the seventh and eighth grades — the       assessments tools and teaching references for pupils
Austrian Ministry of Education has begun a project        from grade 6 to grade 12. These are already used by
with two principal objectives:                            hundreds of teachers and are now available on the In-
                                                          ternet, and on CD-ROM, for all teachers.
• to establish measures for the further development
of instructional methods in mathematics;
                                                          Germany
• to develop a methodology for the use of materials
relevant to TIMSS in mathematics instruction.             In Germany, materials have been developed for math-
                                                          ematics teachers, in which the TIMSS results are ex-
These materials will serve as a tool in voluntary self-
                                                          plained and suggestions for the improvement of math-
evaluation of schools. The project is intended to be a    ematics teaching are presented. These materials
first step in relating international studies of student   include a CD-ROM containing excerpts from a study
achievement to practical work in schools.                 video, produced in the context of TIMSS, on the teach-
                                                          ing of mathematics in Germany, Japan and the USA.

Cyprus
                                                          United Kingdom
The Mathematical Society of Cyprus, in cooperation
with the Ministry of Education and Culture, has initi-    Launch of the Maths Year 2000 in January to raise ex-
ated mathematical contests covering all areas of the      pectations, promote a ‘can do’ attitude towards maths
country and all ages of pupil. The response from          and get rid of the national fear of figures. Maths Year
pupils has been very high. The contests are helping to    2000 will make maths fun and accessible for everyone.
build a culture which promotes excellence in mathe-       And most importantly, Maths Year 2000 will support
matics.                                                   the efforts of primary teachers to drive up standards in


                                                     EUROPEAN REPORT ON THE QUALITY OF SCHOOL EDUCATION | 61
maths through the government’s national numeracy          newspaper is integrated in different subject matters at
strategy. Some 27 000 teachers from schools with the      school. After four weeks of reading the local news-
biggest challenges will receive intensive maths train-    paper and getting familiar with structure, special lan-
ing.                                                      guage and different types of texts (report, comment,
                                                          etc.), the pupils also receive other newspapers (trans-
As a response to the Unesco initiative to declare 2000    regional and weekly papers). The guided comparative
‘the year of mathematics’, most countries have set up     reading also makes a remarkable contribution to polit-
an agenda and projects which can be consulted             ical education and to media-education in general. The
(http://wmy2000.math.jussieu.fr/). As an example, the     project is an excellent instrument to stimulate interest
United Kingdom has organised a high-profile cam-          in reading, in public affairs and promotes critical
paign promoting mathematics as an enjoyable and           judgement. The project is financed by the publishers
interesting topic. The campaign is being led by a high-   and by industry-sponsors. The participation rate is
profile media personality famous for her numerical        high.
skills. For more information go to the web site
(www.mathsyear2000.org).
                                                          Italy

                                                          In 1998, the Ministry of Education launched the ‘Prog-
                                                          etto lettura 2000’ programme aiming to promote the
2.   READING
                                                          development of school libraries and to encourage
                                                          reading among students of all kind of schools. Among
Denmark                                                   the initiatives proposed by the schools, two are to be
                                                          mentioned:
The results from the IEA reading literacy survey from
1991 showed that Denmark was not at a high or na-         Students (last year of lower secondary schools and all
tionally acceptable level. Since then, Denmark has        grades of upper secondary) can take part in their own
made efforts to increase the reading level in compul-     school in a jury which has to select the 20 most impor-
sory education. One of the projects has been to           tant books of 20th century from 100 youth books pro-
strengthen educational/pedagogical research in the        posed by a group of writers. The selected books must be
field. Furthermore, the in-service training of school     reviewed explaining the reasons of the choice; the re-
teachers has been expanded and municipalities have        views can be considered as a credit. The list of the most
decided to increase the amount of lessons in reading      favourite books at national level will be presented at the
and writing. Teacher training colleges have, in accor-    Book Fair (May 2000) and discussed with the students.
dance with the latest ministerial order, upgraded the
importance of Danish as a subject.                        A web site on reading ‘Giovani lettori protagonisti —
                                                          Young readers are protagonists’, wholly addressed to
The Ministry of Education, the National Association of    pupils of primary and lower secondary schools will be
Local Authorities and the Danish Union of Teachers        ready next April as a ‘virtual’ online library. There will
have together launched a big national programme           be also a section for teachers with suggestions and di-
‘Folkeskolen 2000’. The aims of the programme include     dactic proposals in order to motivate pupils toward
setting standards for core knowledge and proficiency      book reading (www.galassia.org).
for each subject. Additionally, a project named Quality
in Education, was introduced by the Danish Govern-
ment in 1998 with the aim of strengthening qualifica-     Sweden
tions in Danish, mathematics and English.
                                                          Research has shown that young people improve their
                                                          reading skills when they participate in joint reading
Germany                                                   experiences with a close friend or relative. Based on
                                                          this finding, regional and local school authorities in
Newspapers in schools — A large number of local and       Sweden have asked and actively encouraged parents of
regional newspapers in Germany take part in this proj-    students aged 10 to 12 to spend half an hour per day
ect: pupils receive over the period of three months       reading a good book with their child. Half the time,
‘their’ daily newspaper (without paying for it). The      the student reads aloud to the parent and the other


62 | EUROPEAN REPORT ON THE QUALITY OF SCHOOL EDUCATION
half the child listens to the parent reading. The au-     the social relevance of science and technology; the
thorities have supported this programme by funding        strategic role of multimedia, telematics and informa-
the purchase of interesting books that both students      tion technologies; the interdisciplinary meaning of the
and parents enjoy.                                        content areas proposed by the programme.

                                                          An initiative has been carried out aiming to improve
                                                          teaching/learning processes in science and to prevent
                                                          learning difficulties during the last year of primary
3. SCIENCE
                                                          school (fifth grade) by means of individualised learning
                                                          units and materials. The experience was based on the
Europe                                                    DIVA model of individualised teaching (Didattica individ-
                                                          ualizzata con valutazione analogica/Individualised
‘Women in Science’ is a mobile exhibition, obtainable
                                                          teaching with analogical assessment): using analogy, this
on request from the Member States’ Education Min-
                                                          approach allows diagnostic tests to be developed which
istry departments, which deals with equal opportuni-
                                                          identify potential learning difficulties regarding specific
ties and gender-related issues to be shown in the
                                                          subject content. In this way remedial action can be
secondary schools.
                                                          planned before failure has actually happened and indi-
It illustrates the history of science through the         vidualised learning/teaching units can be prepared. The
achievements of women in different periods of history     content area selected for this innovative initiative deals
and current trends in the feminist approach to science,   with physical, chemical and biological phenomena.
accompanied by figures and bibliographies, and also
illustrates initiatives organised by European networks
and by the European Commission to promote equal           Slovakia
opportunities at school, at university and in careers.
                                                          ‘Schola Ludus’, launched by scientists of Comenius
The content of the exhibition can be put to use by        University, is an NGO operated, and MoE supported,
teachers as a platform for discussing equal opportuni-    programme commemorating Jan Amos Comenius’ be-
ties in schools and perhaps for getting more girls to     lief in the effectiveness of learning by playing. ‘Schola
opt for scientific and technical subjects.                Ludus’ promotes science education by interactive exhi-
                                                          bitions touring the country.

Ireland
                                                          Spain
European Union Physics Colloquium — The Colloquium
on Attainment in Physics at 16+ was held in 1998 and      The National Science Museum has a guide of school
involved Ireland and eight other European education       programmes for permanent exhibitions, temporary ex-
systems. The colloquium examined approaches to            hibitions, workshops, guided visits, didactical materials
physics education at upper secondary level in the par-    and courses.
ticipating countries. Each country prepared a detailed
                                                          The ‘Consejo Superior de Investigaciones Científicas’ or-
paper on physics education. The outcome of the collo-
                                                          ganises guided visits for groups to several scientific insti-
quium was a report on the principal issues in physics
                                                          tutes to acquaint young people with scientific research.
education in upper secondary education in Europe.


Italy
                                                          4.   ICT
In 1999, a national four-year programme ‘Progetto SET
— SET project’ was launched, aiming to enhance pupils’    Europe
scientific and technological skills and to raise their
achievement levels. The programme is based on four        One of the objectives of President Prodi’s eEurope ini-
basic assumptions: a unified vision of science and        tiative is to make digital literacy one of the basic skills
technology; a wider concept of laboratory skills in-      of every young European. eLearning is intended to im-
cluding experimental skills and capacity to evaluate      plement the education/training part of eEurope. This


                                                     EUROPEAN REPORT ON THE QUALITY OF SCHOOL EDUCATION | 63
initiative has four components: to equip schools with         ment. A scheme to offer tax reductions for the purchase of
multimedia computers; to train European teachers in           home computers is currently being developed along with
digital technologies; to develop European educational         support schemes for teachers to acquire PCs for home use.
services and software and to speed up the networking
of schools and teachers.
                                                              Italy
Most of the resources to be mobilised will be national,
but they should be backed by European Structural              A large-scale programme, the PSTD ‘Programma di
Fund assistance in the eligible regions, mobilisation of      sviluppo delle tecnologie didattiche 1997–2000’, was
the Community programmes to promote digitalisation            promoted to spread information and communication
and development of partnerships between public au-            technologies (ICT) and aims to improve the
thorities and industry.                                       teaching/learning processes.

                                                              The programme has defined three large categories of
Cyprus                                                        objectives:

From the school year 2000–01, the new type of lyceum          1. to promote students’ mastery of multimedia in
— ‘the unified lyceum’ (upper secondary education) —          terms of understanding and using different tools, or
will be introduced in Cyprus. Following an extensive          adopting new cognitive styles in the study, design and
four-year pilot, the new lyceum will have three key           the conduct of experiments in communication.
new elements:
                                                              2. to      improve     the    effectiveness      of the
• upgrading the ICT skills of pupils by introducing           teaching/learning processes and the pedagogical or-
curricular changes that provide for more teaching pe-         ganisation eTwer regarding subject-bound competen-
riods in ICT;                                                 cies or the acquisition of cross-curricular skills.

•   upgrading schools’ technological equipment;               3. to develop the professionalism of teachers not on-
                                                              ly through education, but also by giving them tools
• developing the skills of staff to enable the provi-         and services for their daily job.
sion of a more flexible programme of studies to suit
the needs and aspirations of all pupils.                      An experimental teaching project called ‘Multilab’
                                                              (multimedia laboratory) aims to revolutionise teaching
                                                              through the use of computers in classrooms. A net-
Estonia                                                       work of seven schools has been set up in each of the
                                                              20 cities involved in the project and one of the upper
In some Estonian schools, senior pupils are required to       secondary schools selected is responsible for the coor-
spend four hours a week on mentoring and tutoring             dination and implementation of the initial in-service
younger children in ICT, acting as a mediator between         training phase for the teachers.
them and their teachers. The benefits to older pupils
are seen to be as significant as those for the younger        Multilab does not, however, propose a single model for
children who gain from working with peers whose ex-           methods of teaching. The project is presented to the
perience is more relevant. This takes place as part of a      schools as an offer of the necessary structure and
wide national initiative to increase the use of ICT and       equipment.
develop the expertise of teachers.

                                                              The Newerlands
Hungary
                                                              The Dutch ‘knowledge net’ is a project of the Ministry
In Hungary, initiatives are underway to promote new           of Education bringing togewer pupils, parents, teach-
methods and teaching aids that make use of ICT technol-       ers and cultural organisations. It is a computer net-
ogy in a range of school disciplines. Successful applicants   work which also provides services: information, discus-
are expected, in exchange for funds for equipment and         sion groups, and technical facilities. Business firms re-
software, to develop and test computer-assisted se-           ceive tax benefits if they provide computers to schools.
quences of lessons and give reports on student develop-       Pupils (and teachers) receive a qualification, called the


64 | EUROPEAN REPORT ON THE QUALITY OF SCHOOL EDUCATION
‘digital educational driver’s licence’ (digitaal rijbewijs)   count for e-mail and access to Internet. Around
which sets a standard for basic ICT skills.                   65 000 teachers have an account. More information
                                                              (in Spanish) is available on the Internet
                                                              (http://www,pntic.mec.es/).
Poland

The ‘Interkl@sa’ programme aims to prepare young              Sweden
people for work in the information society and to de-
velop schools as modern centres for innovation and            In Sweden the government offers in-service training
creation. It also brings together two projects: the first     for school leaders and teacher teams to learn how to
establishing an Internet workshop in each commune,            use computers as a tool. Money has been allocated by
and the second planning an Internet workshop in each          the government to supply 60 000 teachers with a per-
secondary school.                                             sonal computer. A specific State allowance is given to
                                                              each school so that they can link up to the Internet.
                                                              Within a few years all Swedish students will have their
Slovakia                                                      own personal e-mail address.

Info-age — Infovek, in Slovak (www.infovek.sk) — is a
non-profit-making NGO operated programme aimed
at the improvement of ICT in primary and secondary
                                                              5.   FOREIGN LANGUAGES
schools. Reflecting US and EU activities of this type,
access to Internet, at least one multimedia laboratory
and training of teachers is to be provided for all pri-       Europe
mary and secondary schools. The programme was
                                                              The aim of the ‘European label’ is to help stimulate in-
launched in 1999. It is supported by MoE and backed
                                                              terest in language learning by highlighting innovative
by the President of the Parliament. It continues the ef-
                                                              language learning projects at all stages of education
forts of Dutch–Czechoslovak project Comenius from
                                                              and training. The European label was launched in the
early 1990s and the recent ‘Open society fund’ pro-
                                                              context of the Commission’s 1995 white paper ‘Teach-
gramme which have already provided Internet access
                                                              ing and learning: towards the learning society’, which
to 138 schools.
                                                              set the objective of helping all EU citizens to be profi-
                                                              cient in three European languages.
Slovenia                                                      The label can be awarded to any initiative in the field
                                                              of language teaching and learning, whatever type of
The objective of the ‘Developing computer literacy’
                                                              organisation is responsible and whatever the age of
programme (http://ro.zrsss.si/) is to: train teachers and
                                                              the learners involved. Some projects will involve the
pupils for the use of information technology; imple-
                                                              use of new technologies, but that is not essential.
ment a standardisation of computer supported trans-
                                                              What is important is that a project makes good use of
fer of data between schools and other institutions;
                                                              the resources available to it.
unify the computer software used for teaching and
administration purposes in schools; supply schools
with up-to-date computer and data equipment; and              Belgium
provide the possibilities for research and development
in the field of implementing new information tech-            Due to the limited international importance of Dutch
nologies in schools.                                          (the mother tongue in Flanders), foreign language
                                                              learning has a prominent position in Flanders. An im-
                                                              pressive number of people attend foreign language
Spain                                                         courses, not only in compulsory education (from age
                                                              12 to 18), but mainly in all kinds of adult education.
All Spanish State schools have an official Internet ac-
count and space to publish a web page. Many schools           The most important provider is the Department of Ed-
have created their own website. All teachers of State         ucation, which offers courses in 18 languages (both,
schools have the opportunity to ask for a personal ac-        European and non-European). Access to these courses


                                                         EUROPEAN REPORT ON THE QUALITY OF SCHOOL EDUCATION | 65
is made easy and very cheap. Some language courses         They have half-time classroom work. They have addi-
are on offer as distance learning. In addition, specific   tional duties, aimed at regular training of other FL
types of work-related language training courses are        teachers in several neighbouring municipalities in
offered in the sector of occupational (VDAB) and self-     state-of-the-art teaching methods; analysing the
employment training (VIZO). Finally, many companies        needs of in-service training for the municipalities for
invest in modern foreign language training.                which they are responsible, planning and managing
                                                           the in-service training jointly with the regional inspec-
The wish to interrelate the general and vocational lan-
                                                           tors in FL. This cascade model of teacher training is
guage offer has resulted in developments on the
                                                           proving very successful, and currently similar consider-
macro-level. The educational authorities have decided
                                                           ations are under way for all other subjects.
to work out a qualification structure in which both
types of language offer are integrated.

To that end the Department for Educational Develop-        Hungary
ment (DED) has worked out a common tool for build-
                                                           Hungary, as other countries, has been participating in
ing user-friendly and transparent language learning
                                                           an experience of the Council of Europe (Modern Lan-
curricula. It is a common framework to describe the
                                                           guages Division) concerning a European language
entire language offer (both general and occupational)
                                                           portfolio (ELP) since its launch in 1998. The ELP is a
provided by the Department of Education. This frame-
                                                           personal document in which students can record their
work uses a European-level indication as described in
                                                           qualifications and other significant linguistic and cul-
the common European framework of the Council of
                                                           tural experiences in an internationally transparent
Europe ‘Breakthrough up to effectiveness’. The frame-
                                                           manner, thus motivating learners and acknowledging
work:
                                                           their efforts to extend and diversify their language
•   is based on the need for effective communication;      learning at all levels in a life-long perspective.

• meets the demands of society and the world of
work by describing final objectives in terms of lan-       Ireland
guage tasks. These tasks are described in a systematic
way, using a fixed set of building blocks. The final ob-   In Ireland, a project has commenced aimed at increas-
jectives are then clustered into certified modules.        ing the range of foreign languages taken by students
                                                           in secondary school. At present, French has by far been
The first new curricula based on this framework will be    the dominant foreign language taught in Irish schools
on offer by September 2000 (basic level to Break-          with the number of students taking German less than
through); higher levels of proficiency will be intro-      one-third of the number taking French. Very few stu-
duced in 2001.                                             dents take Spanish and far fewer take Italian. The
                                                           project is aimed at increasing the numbers taking
                                                           Spanish and Italian by increasing the number of
Bulgaria
                                                           schools which offer these languages. It is also intend-
Improving foreign language (FL) teaching through cre-      ed to introduce Japanese to the school curriculum. In
ation of a network of ‘methodology teachers’ In order      its initial stage the project is exploring how best this
to improve FL teaching, the Bulgarian Ministry of Edu-     extension of foreign languages may take place.
cation and Science (MES) decided to create in 1996 a
national network of so-called ‘teacher methodologists’.
After a highly competitive selection process, over 150
candidates in four languages (English, German, French      6.   LEARNING TO LEARN
and Russian) were appointed to attend one- to two-
year special part-time ‘training of trainers’ pro-         Belgium (Flanders)
grammes, and sat exams to become teacher methodol-
ogists. In 1998, corresponding legislative changes were    In Flemish Belgium, learning to learn skills are already a
made and the position of ‘teacher methodologist’ was       compulsory aspect of the 6 to 18 core curriculum. They
introduced in the school system. About 150 teacher         are presented as a cross-curricular theme to be integrated
methodologists took this position all over the country.    and applied in as many subjects as possible. Skills include


66 | EUROPEAN REPORT ON THE QUALITY OF SCHOOL EDUCATION
the ability to reflect on your own learning, choose appro-    naires have been developed for two age groups. One, for
priate strategies for solving problems, being aware of        students of 10 to 15 years of age, covers four main ar-
feelings and be able to channel these effectively, and to     eas: learning strategies; learning styles; awareness of
make informed choices about subjects and careers.             learning (‘metacognition’); and attitudes to school and
                                                              learning. The second, aimed at students aged 14 to 17 in
                                                              general and vocational education, has 14 scales, seven
England                                                       of which tap cognitive, or thinking, skills while the other
                                                              seven tap into affective, or feeling, aspects such as test
In England, the Department for Education and Em-
                                                              performance anxiety, self explanations for success and
ployment (DfEE) has commissioned and published a re-
                                                              failure, perceptions of one’s own competence or ability.
port on thinking skills (McGuinness, Thinking Skills,
DfEE, 1999) and made a Ministerial press release indi-        The Netherlands
cating the importance of this is an emerging govern-
ment priority. At the level of practice level there are       In the Netherlands, a cohort study of 20 000 second-
numerous authorities and schools undertaking training         ary students is repeated every five years using a test
and examples of large-scale initiatives such as the           developed to measure the general problem solving ca-
University of the First Age, in Birmingham, which holds       pacities of 14- to 15-year-old pupils.
summer schools in which schoolchildren of secondary
age practice accelerated learning techniques.

                                                              7.   CIVICS
Finland

In Finland, research has been conducted as a prelude to       Greece and Cyprus
developing a new form of national assessment. The re-         In Greece and Cyprus, the ‘Parliament of adolescents’ is
search analysed factors which cut across and permeate         an annual project in which elected Lyceum pupils act
school subjects and came to be called ‘learning to learn      as representatives of all other pupils living in all areas
competencies’. Identification of these factors will, it is    of the two countries. They meet in the House of Par-
hoped, help to explain relative success and failure in        liament and discuss matters of concern of the young
general and in specific subjects. The national study of       generation as well as matters of current importance to
sixth graders in 1996 has provided a national norm for        Greece and Cyprus. In their discussions they follow the
later testing, leading in 1997 to a study of ninth graders,   rules and regulations of the real Parliament. The proj-
similarly furnishing a national norm. Further extensions      ect has been successful in providing pupils with rich
and developments are now building on this work.               experiences in civics education.


Germany                                                       Italy
In Germany, widespread curriculum revision is taking          In all secondary schools a ‘Statute of students’ rights
place, encouraging pupils through the use of texts and        and duties’ was introduced in order to enhance
questionnaires to reflect on their working habits, their      democracy in schools and widen students’ opportuni-
learning strategies, their ability to communicate and         ties (i.e., the right to be informed about learning goals
cooperate. Teachers are given criteria for the measure-       and assessment criteria, to participate in support ac-
ment of self-regulated, cross-curricular work, in order       tivities to prevent drop out; the duty of the schools to
to certificate competencies in these areas.                   respect cultural and religious values of foreign stu-
                                                              dents and to organise intercultural activities etc.).

Italy                                                         The following are examples of courses and initiatives
                                                              of ‘cross-curricular education’ dealing with civics at
In Italy, a repertoire of instruments has been developed      both curricular and extra curricular level:
to measure learning to learn competencies and to pro-
vide teachers with simple tools which they can use for        • peace and human rights education: Amnesty In-
remedial and individualised intervention. Question-           ternational organised in-service teachers’ training and


                                                         EUROPEAN REPORT ON THE QUALITY OF SCHOOL EDUCATION | 67
elaborated students’ and teachers’ materials and            In the field of ‘Education for Europe’, the National
teaching units for schools in Rome and other Italian        Centre for Teachers’ Improvement has trained 1 200
towns (http://www.amnesty.it/edu/index.html);               teachers using a multimedia methodological tool ‘An
                                                            educational package on the European integration’.
• environmental education and education for cul-
tural heritage: at national level many schools are in-
volved in initiatives for the ‘adoption’ of monuments
and local areas allowing students to develop a sense of
                                                            8.   DROP-OUT RATES
belonging to their local communities. See the web site
(http://www.legambiente.com/scuola/index.html),
which is in Italian;                                        Europe

• intercultural education: Peter Pan is a European          At European level, the ‘Second chance schools’ project
multilingual school magazine, on paper and online.          offers education and training to young people who
The     online   version   (http://www.geocities.com/       lack the skills and qualifications necessary to find a job
CollegePark/Theater/8153/index.html) and chat-line          or benefit fully from conventional training. The project
(http://members.xoom.it/PeterPanNews/chat.html) can         aims to set up long-term partnerships between all
be found on the Internet;                                   those concerned, at local level, with the social and
                                                            economic integration of young people at risk of social
• education for lawfulness: the national cultural asso-     exclusion. More information can be found on the In-
ciation LIBERA (Associations, names and numbers against     ternet (http://europa.eu.int/comm/education/2chance/
mafias) signed an agreement with the Italian Ministry of    homeen.html).
Education in order to carry out a plan of action-research
in schools aiming to define specific competencies in this
area. The agreement provides for the collaboration of all   Bulgaria
provincial representative councils of students.
                                                            In 1997, a Phare project was launched to cope with
                                                            the increase in school drop outs as a result of the un-
                                                            stable economic situation. The project was named
Poland                                                      ‘School for everybody’. Its main goals were to build ex-
In accordance with the requirements and needs of the        pertise for coping with this complex problem through
education reform taking place in the country, the           appropriate training, involving all concerned stake-
                                                            holders, and building centres of expertise and aid
KOSS programme has trained 2 000 teachers to teach
                                                            throughout the country. As a result of the project, 13
civics to their students. It also creates and publishes
                                                            project centres were established countrywide, three of
civics programmes.
                                                            which are resource centres for teacher training, and
‘Law and civics education in secondary schools’ is a        the rest are centres for school dialogue. Considerable
programme which deals with the creation of courses in       training of teachers, headmasters and other stakehold-
cooperation with the pupils. Within the framework of        ers took place too. At the end of the project the 13
this programme, lessons are developed and conducted         centres officially became part of the educational sys-
with the active participation of pupils.                    tem. They offer various expertise and training in meth-
                                                            ods, curriculum design, psychology training, advice,
An estimated 200 000 pupils from primary and sec-           pupil consultancy services, and support to schools,
ondary school (the ‘Gymnasium’ system, implemented          municipalities, parents and pupils to cope with the
following educational reform) have learned and are          drop-out problem. They are obliged to train staff for
learning civics through the KOSS programme.                 other such centres to be created in each of the 28 re-
                                                            gions of the country.
‘Young citizens are active’ is a project aiming to teach
young people to participate in everyday life in an ac-
tive and productive way. Pupils have to try to find so-
                                                            France
lutions to the most important problems they feel exist
within their society and to convince the local authori-     A ‘New chance’ for young people who leave school
ties to develop their ideas.                                without qualifications. Each year some 57 000 young


68 | EUROPEAN REPORT ON THE QUALITY OF SCHOOL EDUCATION
people leave the educational system in France without        for schools to report early school-leavers to the
qualifications and therefore risk social and profession-     municipality.
al exclusion. The French Government takes the view
that schools are not only responsible for education
and training of the young people attending them, but         Poland
also for the future of those who leave school where no
arrangements for transition are in place. This new ac-       To help reduce the numbers of those dropping out in
tion:                                                        Poland, an educational psychology service was set up
                                                             and, in 1998/99, 7 646 school educationalists were re-
• encourages responses for each young person                 cruited by schools to identify pupils’ individual needs,
rather than general solutions;                               to analyse the causes of failure and to find ways of
                                                             remedying them. In the same year, 978 psychologists
•   facilitates initiatives and supports innovation;         were hired by schools to look at the potential difficul-
•   acts together with partners, particularly enterprises.   ties facing pupils and to organise different forms of
                                                             psychological therapy. In addition, they provide advice
The programme, which was launched in May 1999, has           to students and teachers and cooperate with the edu-
a number of objectives. It aims to: improve procedures       cationalists and parents in order to prevent behaviour-
for identifying the young people concerned and in-           al disorders and initiate educational assistance inside
crease the available information about the issue of          and outside schools.
drop out; prevent disaffection in upper secondary
schools; enrich training up to the level of CAP; and de-
velop a European dimension (the integration of the           Spain
European ‘Second chance schools’ projects into the
‘New chance’ programme is explicitly mentioned).             Three different initiatives, two of them depending on
                                                             the Ministry of Education or the autonomous commu-
                                                             nity, the other depending on the Ministry of Labour or
Germany                                                      the autonomous community.

Some pupils will become drop outs because they lose          • ‘Programmas de garantía social’ for 16 to 21 year olds
interest in theoretical learning at school. In Germany it    who have not finished secondary education or have no
has proved useful to find local industry partners who        professional qualification to the labour market. These
can give those pupils the chance to gain experience in       programmes are described (in Spanish) on the Internet
practical working, in parallel with their school-based       (http://www.mec.es/cnrop/portada_cnrop_40.htm).
learning. It has been shown that a relatively large          • ‘Formación profesional ocupacional’ provided by
number of pupils gain new motivation for education           the Ministry of Labour and funded by the European So-
at school as a result of this approach.                      cial Fund. Details, in Spanish, can be found on the Inter-
                                                             net (http://www.inem.es/ciudadano/p_formacion.html).

The Netherlands                                              •   Secondary education for adults (ESPA).

Early school-leaving in the Netherlands is challenged
by a policy of cooperation between schools at a re-          United Kingdom
gional level. Early school-leavers are registered and are
put back into schools as much as possible in order to        ‘New deal’ is a key part of the UK Government’s ‘Wel-
give them the opportunity to achieve an upper sec-           fare to work’ strategy. It gives jobseekers aged 18 to
ondary qualification. To achieve this, 39 regional cen-      24, 25 + and those with disabilities a chance to devel-
tres (RMC) have been formed with responsibility for          op their potential, gain skills and experience and find
registering early school-leavers and coordinating ac-        work. It also provides an opportunity for businesses to
tions. These regional centres take into account the dif-     make use of the untapped energies and talents of a
ferent responsibilities of the stakeholders in the region    new labour force. More than 67 000 companies have
(school, employment agencies, justice, youth care, mu-       signed ‘New deal’ employer agreements so far. Partner-
nicipalities, etc.) in deciding how best to act. A law is    ship between the Employment Service and a wide
currently being prepared which will make it obligatory       range of organisations is crucial to the success of ‘New


                                                        EUROPEAN REPORT ON THE QUALITY OF SCHOOL EDUCATION | 69
deal’. ‘New deal’ was created to help unemployed peo-         institutions. These are organised at institutional level
ple into work by closing the gap between the skills           and between institutions, in line with Government pol-
employers want and the skills people can offer.               icy, and are supported in different ways by the State.
                                                              One example is the ‘Accessing college education’ proj-
                                                              ect. Sixty students were accepted into the project and
                                                              while at school they benefited from extra classes and
9. COMPLETION OF UPPER SECONDARY                              supervised study and also tuition in study skills. As the
EDUCATION                                                     students are encouraged to forgo paid employment
                                                              while at school, they are each given money each month
                                                              by the project. They are also provided with academic,
Ireland
                                                              personal and financial support while they are in college.
In Ireland, one of the most important aims of educa-
tion policy is to maximise the numbers of students
who complete upper secondary education. To that end           Scotland
an alternative programme, the ‘Leaving certificate ap-
                                                              In Scotland, the ‘Open University’ and ‘Open College’
plied’, has been devised for students for whom the
                                                              are interesting examples of making tertiary education
mainstream programmes are not suitable. This pro-
                                                              more available to mature students and those in remote
gramme focuses on the needs and interests of students
                                                              areas. Perhaps more topical is the development of the
using a range of methodologies. It also seeks to devel-
                                                              new ‘University of the Highlands and Islands’, which is
op in the students an enterprising outlook, self-confi-
                                                              making extensive use of remote access teaching tech-
dence and other skills related to success in the work-
                                                              nology to link a number of centres with students
place. Students are required to perform tasks during
                                                              across the remote rural region of northern Scotland.
the two years of the ‘Leaving certificate applied’,
which are assessed and count towards the student’s fi-
nal examination. Work experience and preparation for
the world of work are also important aspects of the
                                                              11. EVALUATION AND STEERING OF SCHOOL
programme.
                                                              EDUCATION


Spain                                                         Austria

The ‘Centro para la Innovación y Desarrollo de la Edu-        In advance of the general introduction of compulsory
cación a Distancia’ (CIDEAD) organises and coordinates        school planning and self-evaluation, a rich resource site
‘Educación a distancia’ intending to facilitate access to     on the Internet has been established for schools, allowing
education to adults and also to non-adults who due to         them to access information, ideas, procedural proposals,
personal, social, geographical or other exceptional cir-      instruments and other support for schools programme
cumstances cannot follow education at school with             development and self-evaluation (http://www.qis.at).
daily attendance. It provides primary education, sec-
ondary, and secondary for adults and non-compulsory
post-secondary education.                                     Denmark

                                                              Denmark launched the Danish Evaluation Institute, in
                                                              August 1999, a single organisation for the evaluation
                                                              of all levels of education. The mandate of the institute
10.   PARTICIPATION IN TERTIARY EDUCATION                     is internationally unique, because it is given the task
                                                              by Parliament to undertake systematic and mandatory
Ireland                                                       evaluation of teaching and learning at all levels of the
                                                              educational system from kindergarten classes to post-
In Ireland, many of the universities and other tertiary in-   graduate courses.
stitutions now have programmes which are aimed at re-
dressing the current imbalance in the representation of       In order to understand the expectations of Government
the social classes in the universities and other tertiary     and Parliament it is necessary to point to two highly vis-


70 | EUROPEAN REPORT ON THE QUALITY OF SCHOOL EDUCATION
ible elements in the recent Danish political debate on       Portugal
education. Firstly, there has been much concern about
the transition from one level to the next in the educa-      Evaluation and steering of schools is now seen in Por-
tional system, whether it be the transition from primary     tugal as very much connected with the definition of
to secondary or from secondary to tertiary education.        educational plans which schools are required to elabo-
Secondly, OECD surveys during the 1990s have ques-           rate and follow.
tioned the skill levels of Danish primary school pupils in   PEPT (Education for every student), a programme de-
elementary reading and mathematics.                          signed in 1991 to foster students completion of com-
Europe                                                       pulsory education, made it obligatory for every school
                                                             to structure a self-evaluation plan which includes an
The European pilot project ‘Evaluating quality in            observatory with 15 indicators relating to context,
school education’, a self-evaluation profile, provided a     process, resources and outcomes.
highly stimulating starting activity and influenced pol-
icy developments in a number of countries and in             Similarly the Institute of Educational Innovation (IIE),
some, for example Italy and Portugal, the pilot has          is currently taking forward work on self-evaluation of
been extended to involve a wider group of schools.           quality education in schools first developed and fi-
                                                             nanced by the European Commission.
For the full report see the web site
(http://europa.eu.int/comm/education/poledu/
finalrep/rep.pdf).                                           Scotland

                                                             Scotland has a well-developed approach to promoting
Hungary                                                      self-evaluation in schools, backed up by publication of
                                                             examination results and a regular programme of inde-
The improvement of quality has a prominent place in          pendent inspections of individual establishments. ‘How
the strategy of the Ministry of Education in Hungary.        good is our school?’ was published in 1996. It is a
A comprehensive programme of quality development             toolkit for schools to use in self-evaluation, based on a
has been initiated by the Ministry. A new pilot project      set of 33 performance indicators. These were organised
will be launched with more then 400 public institutes,       into seven key areas. In the latest development of this
nursery schools (pre-primary education institutes),          approach many schools across the country (in some
primary and secondary schools (including the voca-           cases schools within a local authority) are beginning to
tional training schools) and hostels. The programme          publish their own self-evaluation reports (standards
focuses on the operation and management of the               and quality reports) in which they summarise their
schools, thus internal development work will be car-         own evaluation of their performance in each of the
ried out by the institutions themselves. The success of      key areas for their stakeholders. Development of the
the quality development programme is largely based           self-evaluation approach in Scotland is being taken
on the cooperation of teachers, providers, and those         forward through the nationally coordinated ‘Quality
responsible for quality assurance in the domain of in-       initiative in Scottish schools’.
dustry. One of the most important elements of pro-
fessional support is the Manual of Quality Improve-
ment, published by the Ministry, which is available for      Spain
each institution.
                                                             • INCE (Instituto Nacional de Calidad y Evaluación)
                                                             was created to design evaluation systems for the dif-
The Netherlands                                              ferent types of education governed by the LOGSE (new
                                                             law for education).
About 0.5 % of the budget for primary and secondary
education is spent on external evaluation activities         • Self-evaluation of schools is mandatory in Spain;
such as tests, examinations, evaluations by the inspec-      schools are free to follow their own model of self-
torate, and large-scale evaluation research. School also     evaluation. The Ministry of Education has published
have their own systems for internal evaluation of the        the ‘Modelo Europeo de Gestión de Calidad’, but train-
quality of education.                                        ing is needed to put the model into practice.


                                                        EUROPEAN REPORT ON THE QUALITY OF SCHOOL EDUCATION | 71
The Ministry of Education holds an annual contest for     service teacher training during seven years of practice.
an award of quality in education, the objectives of       The courses could be supplied by any kind of training
which are to foster quality improvement in education      organisation including HE institutions, pedagogical in-
through quality in the management of schools and to       stitutions, schools, training firms, NGOs or even private
foster use of the ‘Modelo europeo de gestión de cali-     individuals. The courses should go through an accredi-
dad’ as a systematic tool of self-evaluation for im-      tation process which includes two phases: first, the
provement.                                                professional accreditation of the programme and, sec-
                                                          ond, the accreditation of the local implementation of
                                                          the programme — this allows organisations to imple-
                                                          ment programmes created by others if they agree.
12.   PARENT PARTICIPATION                                Each programme is required to have an internal quali-
                                                          ty assurance and quality management system. All edu-
                                                          cation institutions receive per capita funding based on
Europe
                                                          the number of teachers employed form the state
EPA’s ‘Training programme in partnership’ is an exam-     budget to cover the costs of the courses (tuition and
ple of how to improve quality through cooperation         other expenses).
and constructive dialogue between parents and teach-
ers at the school level.
                                                          Portugal
Many parents do not come to the school — through
fear, lack of knowledge, lack of time or lack of aware-   ‘Sailing through the Portuguese language’ is the name
ness. EPA’s training course targets these parents and     given to an initiative of the Department of Secondary
highlights their important role and responsibility in     Education of the Portuguese Ministry of Education, de-
the education of their own child. It provides them with   signed to provide teaching training using Internet facil-
the confidence to communicate effectively with            ities. This initiative started in October 1999 and is in-
teachers.                                                 tended for teachers of the Portuguese language who
                                                          work with 11th grade students. There are now 158
                                                          teachers following this initiative. ‘Sailing through the
Germany                                                   Portuguese language’ offers a range of opportunities
                                                          including glossary, activities and solutions to problems
In Germany, seminars for parents are provided at both
                                                          and participating in a group discussion through the
classroom and school level with three primary aims:
                                                          Internet.
• to inform them of new developments in learning
and teaching and the part they can play in supporting
their children’s learning;
                                                          14. PARTICIPATION RATES IN PRE-PRIMARY
• to establish consensus on areas of school life, such
                                                          EDUCATION
as social education and values education;

• to motivate them to participate in wider aspects        Italy
of school policy such as school rules and policies on
violence, drugs, etc.                                     In Italy, three initiatives concerning quality in infant
                                                          education have been promoted by the Ministry of Ed-
                                                          ucation and by the National Institute for the Evalua-
                                                          tion of Education Systems.
13.   EDUCATION AND TRAINING OF TEACHERS                  A four-year national programme of in-service teacher
                                                          training aims to:
Hungary
                                                          • promote a process of action research and imple-
The in-service teacher training system — the Act on       ment innovations in four areas: curriculum, education-
Public Education has declared that each teacher           al organisation, life contexts of children, professional
should participate in at least 120 contact-hours of in-   identity of teachers;


72 | EUROPEAN REPORT ON THE QUALITY OF SCHOOL EDUCATION
•   encourage and record innovative experiences;
                                                             15.     NUMBER OF STUDENTS PER COMPUTER
• disseminate relevant results and practices at re-
gional and national level;                                   Belgium (French)
•   enhance teachers’ expertise;                             In 1998, a partnership was signed between the French
                                                             Community of Belgium (responsible for education and
• set up a network of professional resources able to
                                                             teachers training), Walloon or Brussels Capital regions
support innovative processes and to meet new de-
                                                             (responsible for technology and equipment) and the Fed-
mands of teacher training.
                                                             eral State (responsible for telecommunications) in order
A project entitled ‘Special actions to evaluate quality      to offer to each primary and secondary school a ‘cyber
in infant schools’ aims to:                                  centre’: computers and facilities to connect to Internet.

• carry out a national survey of schools’ experiences
of self-evaluation in the context of factors which con-      Estonia
tribute to children’s learning and development;
                                                             The Estonian ‘Tiger leap’ programme is a national tar-
• develop a scale to be used by teachers for evalu-          get programme with the overall objective of improving
ating the quality of different aspects of the school         the educational system in Estonia through the intro-
setting.                                                     duction of modern information and communication
                                                             technologies. The programme is aimed at general edu-
The project QUASI (Quality of infant school) is a study
                                                             cation systems, but it also involves vocational educa-
aiming to define a repertoire of quality indicators rel-
                                                             tion. Further information can be found on the Internet
evant to infant schools.
                                                             (http://www.tiigrihype.ee/english).

                                                             Italy
Luxembourg
                                                             In 1999, many important companies and banks (Tele-
In Luxembourg, all children aged between four and six        com, Enel, Alitalia, Benetton, Banca di Roma, etc.) pro-
years are obliged to attend institutions of pre-primary      vided schools with their old (but perfectly working)
education. In addition, a third of three-year-olds at-       computers. In March 2000, the Italian Government
tend these institutions. Pre-primary education places        launched a national plan for spreading the use of
considerable emphasis on language development in a           computers among students at home, based on an
multilingual environment.                                    agreement with the Italian Association of Banks. The
                                                             initiative provides an interest-free loan for purchasing
                                                             a computer.
The Netherlands

In the Netherlands, the Ministry of Education and the
Ministry of Health have implemented two experimen-           Portugal
tal programmes for early childhood education (Pi-            Computers have been provided to schools in recent
ramide and Kaleidoscope) with a view to stimulating          years and, currently, every school, from 5th through to
the cognitive, social-emotional and linguistic develop-      12th grade, has a least one computer with access to
ment of disadvantaged children aged between three            the Internet. The new regulations on school adminis-
and six years. The programme aims to give these chil-        tration and management, issued in 1998, created clus-
dren a better start in primary education. The pro-           ters of schools (agrupamentos) which allow for the
grammes are implemented in close cooperation with            sharing of human as well as material resources.
both childcare centres and schools for pre-primary ed-
ucation, and allow the children to receive more per-         FOCO — the Portuguese programme for teacher train-
sonal attention. Evaluation shows that there is a sig-       ing — defined the area of technology information and
nificant (initial) effect, especially on the cognitive de-   communication as one of its first priorities. FOCO is
velopment of these children, and also on their vocab-        developed in the 150 teacher training centres created
ulary and thought processes.                                 by the association of several schools.


                                                        EUROPEAN REPORT ON THE QUALITY OF SCHOOL EDUCATION | 73
16.   EDUCATIONAL EXPENDITURE PER STUDENT


Scotland

In Scotland, the Government has encouraged the use
of new public–private partnership arrangements to al-
low local authorities to fund school rebuilding pro-
grammes which they otherwise would not have been
able to fund on such a scale. These arrangements make
it attractive for private investors to put the money up
front for major building programmes. In Glasgow, for
example, this is allowing the authority to create sever-
al completely refurbished schools at once, thus ratio-
nalising inefficient, under-capacity schools and replac-
ing poor-quality buildings. This sort of initiative allow
major quality improvements in education to be funded
efficiently without capital funds all having to come
from the public purse.


74 | EUROPEAN REPORT ON THE QUALITY OF SCHOOL EDUCATION
2. REFERENCES AND FURTHER READING


Mathematics                                              Union. Studies, Office for Official Publications of
                                                         the European Communities, Luxembourg, 1999.
Black, P., Atkin, M., Changing the subject: Innova-
tions in science, mathematics, and technology edu-       Lafontaine, D., ‘From comprehension to literacy:
cation, London and Paris, 1996.                          thirty years of reading assessment’, in OECD, Net-
                                                         work A 2000, OECD, Paris (not yet published).
Keitel, C., Kilpatrick, J., ‘The Rationality and irra-
tionality of international comparative studies’, in:     Postlethwaite, T. N. and Ross, K. N., Effective schools
Kaiser, G., Luna, E., Huntley, I., International com-    in reading. Implications for educational planners,
parisons in mathematics education, London, 1998,         The International Association for the Evaluation of
pp. 241–257.                                             Educational Achievement, La Haye, 1992.

For more information on the TIMSS study visit            For more information about the IEA Reading Litera-
http://timss.bc.edu                                      cy study visit:
                                                         http://uttou2.to.utwente.nl/rl/iea-rl.htm

Reading
                                                         Science
Dombey, H. (coord.), Early literacy teaching and
learning. Innovative practice in four different na-      Adey, P., The science of thinking, and science for
tional contexts: a thematic network, European            thinking: A description of cognitive acceleration
Commission, Brussels, 1998.                              through science education (CASE), International Bu-
                                                         reau of Education (Unesco), 1999.
Elley, W. B., How in the world do students read?, The
International Association for the Evaluation of Edu-     Beaton, A. E., Martin, M. O., Mullis, I. V. S, Gonzalez,
cational Achievement, La Haye, 1992.                     E. J., Smith, T. A. and Kelly, D. L., ‘Science achieve-
                                                         ment in the middle school years’, IEA’s third inter-
Elley, W. B. (ed.), The IEA study of reading literacy:   national mathematics and science study (TIMSS),
achievement and instruction in thirty-two school         Boston College, Chestnut Hill (Ma.), 1996.
systems, Pergamon, Oxford, 1994.
                                                         Coughlan, R. (ed.), Attainment in physics — Pro-
European Commission (Education, Training, Youth          ceedings of the colloquium on attainment in
DG), Initial teaching of reading in the European         physics at 16+, Stationery Office, Dublin, 1999.


                                                    EUROPEAN REPORT ON THE QUALITY OF SCHOOL EDUCATION | 75
Martin, M. O., Mullis, I. V. S., Gonzalez, E. J., Smith, T.   project, Eburon Publishers, Delft (Netherlands),
A. and Kelly, D. L., ‘School contexts for learning and        1999.
instruction’, IEA’s third international mathematics
and science study,. Boston College, Chestnut Hill             INRA (Europe) – European coordination office,
(Ma.), 1999.                                                  ‘Young Europeans’, Eurobarometer, No 47.2, Euro-
                                                              pean Commission, Directorate-General XXII, Brus-
Séré, M. G. (coord.), Improving science education:            sels, 1997.
Issues and research on innovative empirical and
computer-based approaches to labwork in Europe,               For more information on the Eurobarometer surveys
European Communities, Brussels, 1998.                         visit       http://europa.eu.int/comm/dg10/epo/eb/
                                                              surveys.html or for IEA civic education study, visit
Wise, K. C. and Okey, J. R., ‘A meta-analysis of the
                                                              http://www2.hu-berlin.de/empir_bf/iea_e.html.
effects of various science teaching strategies on
achievement’, Journal of Research Science Teaching,
20 (5), 1983, pp. 419–435.
                                                              Drop-out rates
For more information on the TIMSS study visit:
http://timss.bc.edu                                           Bucchi, M. — IARD (Istituto di Ricerca), Dropping out
                                                              and secondary education, European Commission,
                                                              Directorate-General XXII, Brussels.
Foreign languages
                                                              Colson, D., Gérard, Fr.-M., Guitard, Cl. and. Mar-
Blondin, C. (coord. and ed.), European Commission             tynow, N. (Bureau d’Ingénierie en Education et en
(Education, Training, Youth DG), Learning modern              Formation, Louvain-la-Neuve), Getting on with
languages at school in the European Union. Studies            training, European Commission, Directorate General
— No 6, Office for Official Publications of the Euro-         XXII, Brussels.
pean Communities, Luxembourg, 1997.
                                                              Eurydice, Measures to combat failure at school. A
Bonnet, G. (ed.), The effectiveness of the teaching           challenge for the construction of Europe, Brussels,
of English in the European Union. Report of the col-          1994.
loquium. Background documents (October 1997),
Ministère de l’Education Nationale, Direction de l’é-         Institut de la Méditerranée, Colloque de Marseille,
valuation et de la prospective, Paris, 1998. See also:        L’école de la deuxième chance, Editions de l’Aube,
http://www.education.gouv.fr/dpd/colloq/                      Saint-Etienne, 1997.
INRA (Europe) — European coordination office,                 Ides Nicaise (ed), Success for all? Educational
‘Young Europeans’, Eurobarometer, No 47.2, Euro-              strategies for socially disadvantaged youth in six
pean Commission, Directorate-General XXII, Brus-              European countries, Leuven, 1999.
sels, 1997.
                                                              OECD, Venir à bout de l’échec scolaire, OECD, Paris,
For more information on the Eurobarometer surveys
                                                              1998.
visit:
http://europa.eu.int/comm/dg10/epo/eb/surveys.html            Serrano Pascual, A., Ouali, N. and Desmarez, P. (Cen-
                                                              tre de sociologie du travail, de l’emploi ed de la for-
For details of DIA-LANG, a diagnostic computer-
based assessment project funded by the European               mation (TEF), Université Libre de Bruxelles), Prevent-
Commission under the Socrates programme, visit:               ing failure at school and in professional life in Eu-
http://www.jyu.fi/DIALANG/general.html                        rope, European Commission, Directorate-General
                                                              XXII, Brussels.

Civics
                                                              Evaluation and steering of school education
Torney-Purta, J., Schwille, J. and Amadeo, J. A. (eds.),
Civic education across countries: Twenty-four na-             SICI, Inspectorates of education in Europe — A de-
tional case studies from the IEA civic education              scriptive study, Brussels, 1999.


76 | EUROPEAN REPORT ON THE QUALITY OF SCHOOL EDUCATION
Parents’ participation                                 Jacques Delors, L’Education — Un trésor est caché
                                                       dedans, Unesco, Paris, 1996.
Eurydice, The role of parents in the education sys-
tems of Europe, Brussels, 1997.                        European Commission, Accomplishing Europe
                                                       through education and training, Office for Official
                                                       Publications of the European Communities, Luxem-
Number of students per computer                        bourg, 1997.
Pelgrum, W. J. and Andersen, R. E., ICT and the        European Commission, Education across Europe —
emerging paradigm for life long learning: A world-     Statistics and Indicators 1999, Office for Official
wide educational assessment of infrastructure,         Publications of the European Communities, Luxem-
goals and practices, OCTO, Enschede (the Nether-       bourg, 2000
lands), 1999.
                                                       European Commission, Evaluating quality in school
For more information on the TIMSS study, visit         education — A European pilot project, Office for Of-
http://timss.bc.edu                                    ficial Publications of the European Communities,
                                                       Luxembourg, 1999.
For more information on the IEA/SITES study, visit:
http://www.mscp.edte.utwente.nl/sitesm1/               European Commission/Eurydice/Eurostat, Key data
                                                       on education in Europe 1999–2000, Office for Offi-
                                                       cial Publications of the European Communities,
General                                                Luxembourg, 2000.
Centre for Educational Research and Innovation
(CERI), ‘Education at a glance’, OECD indicators,
OECD, Paris, 1996, 1997 and 1998.

Centre for Educational Research and Innovation
(CERI), Education Policy Analysis, OECD, Paris, 1997
and 1999.


                                                  EUROPEAN REPORT ON THE QUALITY OF SCHOOL EDUCATION | 77
3. LIST OF PARTICIPANTS IN THE
   WORKING COMMITTEE ON QUALITY
   INDICATORS


BELGIUM                                                  GERMANY
Mrs Martine HERPHELIN                                    Frau Ministerialrätin Helga HINKE
Directrice générale adjointe                             Bayerisches Staatsministerium für Unterricht und Kultus
Direction de la Recherche en éducation et pilotage in-
terréseaux
Administration générale de l’Enseignement et de la       GREECE
Recherche scientifique
Ministère de la Communauté française                     Prof Nikitas PATINIOTIS
                                                         Laboratory of Sociology and Education
Mrs Fanny CONSTANT                                       University of Patras
Attachée
Direction de la Recherche en éducation et du Pilotage
interréseaux                                             SPAIN
Administration générale de l’Enseignement et de la
Recherche scientifique                                   Mrs María L. MORENO MARTINEZ
Ministère de la Communauté française                     Technical Advisor
                                                         Instituto Nacional de Calidad y Evaluación
Mr Etienne GILLIARD
Attaché
Administration générale de l’Enseignement et de la       FRANCE
Recherche scientifique
Ministère de la Communauté française                     Mr Gérard BONNET
                                                         Chargé de mission auprès du directeur de la program-
Mr Roger STANDAERT
                                                         mation et du développement
Directeur
                                                         Direction de la programmation et du développement
Ministerie van de Vlaamse Gemeenschap
Dienst voor Onderwijsontwikkeling                        Ministère de l’éducation nationale

                                                         Mr Jacques PERRIN
DENMARK
                                                         Inspecteur général
Mrs Birgitte BOVIN                                       Ministère de l’éducation nationale
Head of Section
Uddannelsesstyrelsen
Undervisningsministeriet


                                                    EUROPEAN REPORT ON THE QUALITY OF SCHOOL EDUCATION | 79
IRELAND                                                  AUSTRIA

Dr Carl Ó DÁLAIGH                                        Dr Herbert PELZELMAYER
Deputy Chief Inspector                                   Leiter der Abt. I/3 des Bundesministeriums für Bildung,
Department of Education and Science                      Wissenschaft und Kultur; Bildungsforschung, Planung,
                                                         Kooperation
Mr Richard COUGHLAN
Senior Inspector                                         Dr Werner SPECHT
Evaluation Support & Research Unit                       ZSEII — Zentrum für Schulentwicklung
Department of Education and Science                      Abt.II: Evaluation und Schulforschung

                                                         Mag. Erich SVECNIK
ITALY                                                    Researcher
                                                         ZSEII — Zentrum für Schulentwicklung
Prof. Benedetto VERTECCHI
                                                         Abt.II: Evaluation und Schulforschung
President
C.E.D.E. — Centro Europeo Dell’Educazione
Istituto Nazionale per la Valutazione del Sistema del-   PORTUGAL
l’Istruzione
                                                         Mrs Gloria RAMALHO
Prof. Vega SCALERA                                       Directora
Researcher                                               Gabinete de Avaliação Educacional
C.E.D.E.— Centro Europeo Dell’Educazione
Istituto Nazionale per la Valutazione del Sistema del-   FINLAND
l’Istruzione
                                                         Mr Simo JUVA
                                                         Director
LUXEMBOURG                                               General Education Division
                                                         Ministry of Education
Mr Dominique PORTANTE
Directeur
Service de Coordination de la Recherche et de l’Inno-    SWEDEN
vation pédagogiques et technologiques
                                                         Mr Ulf P. LUNDGREN
Ministère de l’Education nationale, de la formation
                                                         Director General
professionnelle et des Sports
                                                         National Agency for Education

                                                         Mr Mats EKHOLM
THE NETHERLANDS
                                                         Director General
Mr Jan van RAVENS                                        National Agency for Education
Head
                                                         Mrs Eva EDSTRÖM-FORS
Unit Multilateral Affairs and Knowledge
                                                         Director
Department of International Relations
                                                         Ministry of Education and Science
Ministry of Education, Culture and Science
                                                         Mr Staffan LUNDH
Mr Jaco van RIJN
                                                         Director
Researcher
                                                         National Agency for Education
Unit Information Policy and Forecasting
Ministry of Education, Culture and Science
                                                         UNITED KINGDOM
Mr Ruud ABELN
Head                                                     Ms Chloe WEST
Unit Information Policy and Forecasting                  Team Leader
Department of Financial Economic Affairs                 Pupil Performance and Research Team
Ministry of Education, Culture and Science               Department for Education and Employment


80 | EUROPEAN REPORT ON THE QUALITY OF SCHOOL EDUCATION
Mr Chris WORMALD                                          HUNGARY
Team Leader
                                                          Mr Zoltàn BOGDÁNY
Excellence in Cities Initiative, Standards & Effective-
                                                          Deputy Head
ness Unit
                                                          The Minister’s Cabinet
Department for Education and Employment
                                                          Ministry of Education

UNITED KINGDOM (SCOTLAND)                                 Mrs Katalin HERNECZKI
                                                          Director of Comenius 2000
Dr Wray BODYS                                             Quality Improvement Programme Bureau
Lead Officer
HM Inspector of Schools/Audit Unit                        LATVIA
Education Department
Scottish Executive                                        Mr Nils SAKSS
                                                          Mission of Latvia to the European Commission
Dr Bill MAXWELL
Lead Officer                                              Dr Andrejs RAUHVARGERS
Quality, Standards and Audit Division                     Deputy Head of State Secretary for
HM Inspectors of Schools                                  Education Strategy & Int. Cooperation
Scottish Executive Education Department                   Ministry of Education and Science

                                                          LITHUANIA
BULGARIA
                                                                         ˇ
                                                          Mr Ricardas ALISAUSKAS
                                                               ˇ
Mr Pencho MIHNEV                                          Head
Senior Expert                                             Education Development Division
Department ‘General Education’                            Ministry of Education and Science
Ministry of Education and Science
                                                                         ˇ
                                                          Mr Arûnas PLIKSNYS
                                                          Director
CYPRUS
                                                          General Education Department
Dr Kyriacos PILLAS                                        Ministry of Education and Science
Head
Research & Evaluation Unit                                POLAND
Pedagogical Institute
Ministry of Education & Culture                           Mrs Aldona HILDEBRANDT
                                                          Chief Inspector
Mr Vasilis PHILIPPOU                                      Department of Teachers’ Improvement
Secretary A                                               Ministry of National Education
Permanent Delegation of the Republic of Cyprus to the
                                                          Mrs Ewa KOLASINSKA
European Union
                                                          Senior Inspector
                                                          Department of Teachers’ Improvement
CZECH REPUBLIC                                            Ministry of National Education
Dr Jan SOKOL
Former Minister of Education                              ROMANIA
Ministry of Education, Youth & Sports
                                                          Mr Alexandru MODRESCU
                                                          Head
ESTONIA                                                   Department for Documentation and Education Analysis
                                                          Socrates National Agency
Mrs Epp. REBANE
Head                                                      Mr Mircea MANIU
General Education Department                              General Director of the International Relations Department
Ministry of Education                                     Ministry of National Education


                                                     EUROPEAN REPORT ON THE QUALITY OF SCHOOL EDUCATION | 81
SLOVAKIA                                             EXPERTS

Dr Juraj VANTUCH                                     Mrs Christiane BLONDIN
Faculty of Education                                 Service de pédagogie expérimentale
Comenius University                                  Université de Liège

                                                     Mr Marc DEMEUSE
SLOVENIA                                             Maître de Conférences
Mr Janez KREK                                        Service de pédagogie expérimentale
Assistant                                            Université de Liège
Faculty of Education                                 Prof. Dr Klaus KLEMM
University of Ljubljana                              Fachbereich 2
                                                     Universität/Gesamthochschule Essen
EUROPEAN COMMISSION
                                                     Prof. John MACBEATH
Mr Anders J. HINGEL                                  Quality in Education Centre
Head of Unit                                         University of Strathclyde
Directorate-General for Education and Culture
Development of education policies
                                                     OECD – Organisation for Economic Cooperation and
Mr Lars Bo JAKOBSEN
                                                     Development
Detached national expert
Directorate-General for Education and Culture        Mr Andreas SCHLEICHER
Development of education policies                    Deputy Head
                                                     Statistics on Indicators Division
Mr Ben ROLLES
Trainee                                              Mr Tom SMITH
Directorate-General for Education and Culture        Statistics on Indicators Division
Development of education policies

Miss Kate LYONS
Trainee
Directorate-General for Education and Culture
Development of education policies

Miss Liliane LAUBACH
Secretary
Directorate-General for Education and Culture
Development of education policies

Mr Spyridon PILOS
Education and training statistics
Coordination
Eurostat


UNITE EUROPEENNE D’Eurydice

Madame Luce PEPIN
Directrice

Madame Arlette DELHAXHE
Directrice adjointe/Etudes et analyses

Mr Patrice BREL
Graphiste


82 | EUROPEAN REPORT ON THE QUALITY OF SCHOOL EDUCATION
European Commission

European report on the quality of school education
Sixteen quality indicators

Luxembourg: Office for Official Publications of the European Communities

2001 — 82 pp. — 21 x 29.7 cm

ISBN 92-894-0536-8
16
                                                           NC-30-00-851-EN-C
EN


                                          ISBN 92-894-0536-8
       OFFICE FOR OFFICIAL PUBLICATIONS
 EUR
       OF THE EUROPEAN COMMUNITIES

       L-2985 Luxembourg                     9 789289 405362

2000 16 Indicators For Quality On Education

  • 1.
    Directorate-General for Educationand Culture EUROPEAN REPORT ON THE QUALITY OF SCHOOL EDUCATION SIXTEEN QUALITY INDICATORS Report based on the work of the Working Committee on Quality Indicators European Commission
  • 2.
    EUROPEAN COMMISSION Directorate-General for Educationand Culture EUROPEAN REPORT ON THE QUALITY OF SCHOOL EDUCATION SIXTEEN QUALITY INDICATORS Report based on the work of the Working Committee on Quality Indicators (1) MAY 2000 (1) The working committee includes experts selected by the Ministers of Education of the following countries: Belgium, Denmark, Germany, Greece, Spain, France, Ireland, Italy, Luxembourg, the Netherlands, Austria, Portugal, Finland, Sweden, the United Kingdom, Cyprus, Hungary, Poland, Romania, Slovakia, Latvia, Estonia, Lithuania, Bulgaria, the Czech Republic, and Slovenia.
  • 3.
    A great dealof additional information on the European Union is available on the Internet. It can be accessed through the Europa server (http://europa.eu.int). Cataloguing data can be found at the end of this publication. Luxembourg: Office for Official Publications of the European Communities, 2001 ISBN 92-894-0536-8 © European Communities, 2001 Reproduction is authorised provided the source is acknowledged. Printed in Italy
  • 4.
    CONTENTS Indicators on monitoring of education A. INTRODUCTION 5 11. Evaluation and steering of school education 41 B. FIVE CHALLENGES TO THE QUALITY OF 12. Parent participation 44 EDUCATION IN EUROPE 9 Indicators on resources and structures SIXTEEN INDICATORS ON THE QUALITY OF SCHOOL EDUCATION 13 13. Education and training of teachers 47 Indicators on attainment 14. Participation in pre-primary education 50 1. Mathematics 14 15. Number of students per computer 52 2. Reading 17 16. Educational expenditure per student 55 3. Science 20 Annexes: 4. Information and communication 23 technologies (ICT) 1. EXAMPLES OF NATIONAL INITIATIVES 61 5. Foreign languages 26 2. REFERENCES AND FURTHER READING 75 6. Learning to learn 29 3. LIST OF PARTICIPANTS IN THE WORKING 79 COMMITTEE ON QUALITY INDICATORS 7. Civics 31 Indicators on success and transition 8. Drop-out rates 33 9. Completion of upper secondary education 36 10. Participation in tertiary education 38 EUROPEAN REPORT ON THE QUALITY OF SCHOOL EDUCATION | 3
  • 6.
    A. INTRODUCTION The qualityof education and training is considered in research projects have been launched with a view to all Member States to be a concern of the highest po- strengthening cooperation at European level in the litical priority. High levels of knowledge, competencies field. These initiatives have paved the way for the pilot and skills are considered to be the very basic condi- project on quality evaluation in school education tions for active citizenship, employment and social co- which was implemented in 101 secondary schools hesion. Lifelong learning is an important means of across Europe in 1997/98. Based on the results of the shaping one’s future on a professional and personal pilot scheme, the Commission adopted in January level, and high-quality education is essential in the 2000 a proposal for a recommendation of the Euro- light of labour market policies, and the free movement pean Parliament and the Council on ‘European cooper- of workers within the European Union. ation in quality evaluation in school education’, based on Article 149 and 150 of the Treaty. It is stated in Article 149 of the EC Treaty that ‘the Community shall contribute to the development of The need for cooperation in the field of quality evalu- quality education by encouraging cooperation be- ation was equally underlined at the conference, held in tween Member States and, if necessary, by supporting Prague in June 1998, of the Education Ministers of the and supplementing their actions while fully respecting European Union and of the 11 acceding countries as the responsibility of the Member States for the con- well the Education Ministers from the three non-asso- tent of teaching and the organisation of educational ciated countries of central and eastern Europe partici- systems and their cultural and linguistic diversity’. The pating as observers. The Education Ministers from the Education Council has debated this subject on numer- 26 participating countries invited the Commission to ous occasions. A number of conclusions and resolu- establish a working committee of national experts des- tions have been adopted, inviting Member States and ignated by the Ministers with a view to agreeing a the Commission to initiate cooperation in the field. In ‘limited number of indicators or benchmarks for school the Council resolution of 26 November 1999, Ministers standards to assist national evaluation of systems’. A of Education identified the quality of education as one working group consisting of experts of 26 European of the priority issues for consideration under the new countries was subsequently set up in February 1999 (2). cooperation model of the ‘Rolling agenda’. Two progress reports were prepared by the Commission. Under the Community action programme Socrates, The first report, containing the basic criteria for the quality of education is the key objective of the pro- gramme actions. Quality of education has thus been a (2) The list is also available on the Internet priority issue for analysis, and a number of studies and (http://europa.eu.int/comm/education/indic/membersen.html). EUROPEAN REPORT ON THE QUALITY OF SCHOOL EDUCATION | 5
  • 7.
    selection of indicators,was presented to the European greater social cohesion. Achieving this goal requires an Ministers of Education, in Budapest, in June 1999. The overall strategy aimed at preparing the development second report, setting out a preliminary outline of the of the knowledge-based economy and a strategy de- indicators to be considered, was submitted to the Edu- signed to modernise the European social model by in- cation Council at the meeting on 26 November 1999. (3) vesting in people and by combating social exclusion. This European report on the quality of school education is At the core of this strategic reorientation of priorities, based on the 16 indicators which were selected by the the conclusions of the Lisbon European Summit (March working group in cooperation with the Commission. These 2000) recognised the essential role of education and indicators cover four broad areas: attainment levels; edu- training in moving towards the goal of full employment cational success and transition; monitoring of school edu- through the development of the knowledge economy. cation; and educational resources and structures. The European Council clearly identified the need to set quantifiable targets, indicators and benchmarks as a The Commission envisages submitting this report to the means of comparing best practice and as instruments Education Council under Portuguese Presidency (8 June for monitoring and reviewing the progress achieved. 2000) and to the Conference of European Education Min- isters to be held in Bucharest (18 to 20 June 2000). The re- The Commission is convinced that this first European re- port will constitute a key element of the ‘Rolling agenda’ port on the quality of school education will contribute of the Education Council in the field of quality of educa- a European dimension to the shared knowledge pool tion. The Commission’s intention is to update and to com- available for educational policy-making. The Commis- plement the selected indicators on a regular basis. sion hopes that the report will foster cooperation across Europe and stimulate a wide ranging debate among all The European report on the quality of school educa- stakeholders on quality policies of education. tion represents the Commission’s first response to the conclusions of the special European Council meeting in Lisbon on 23 and 24 March 2000. At this meeting PRESENTATION OF THE 16 INDICATORS the Union set itself the strategic target of becoming The 16 indicators on quality of school education se- the most competitive economy in the world capable of lected by the working committee of national experts sustainable growth, with more, higher quality jobs and provide a complementary set of information, which be- gins to paint a picture of quality in European schools. (3) The two progress reports can be found on the Internet (http://europa.eu.int/comm/education/indic/backen.html). The 16 indicators are shown in the table below: AREA INDICATOR Attainment 1. Mathematics 2. Reading 3. Science 4. Information and communication technologies (ICT) 5. Foreign languages 6. Learning to learn 7. Civics Success and transition 8. Drop out 9. Completion of upper secondary education 10. Participation in tertiary education Monitoring of school education 11. Evaluation and steering of school education 12. Parental participation Resources and Structures 13. Education and training of teachers 14. Participation in pre-primary education 15. Number of students per computer 16. Educational expenditure per student 6 | EUROPEAN REPORT ON THE QUALITY OF SCHOOL EDUCATION
  • 8.
    The indicators fallinto four areas: USING INDICATORS AND BENCHMARKS IN POLICY- MAKING 1. Attainment. It is through graphical portrayal of similarities and dif- ferences between countries that indicators and bench- In this area are seven indicators of attainment which marks truly come into their own. This allows countries are seen as critical for all European countries in the to learn from one another through comparison of both present and for the future. In some fields — ‘mathe- common interests and shared differences. The aim of matics’, ‘reading’, ‘science’ — data already exist. To benchmarks is not to set standards or targets, but some degree this reflects the relative ease of measure- rather to provide policy-makers with reference points. ment in these curricular areas. At the other end of the Benchmarks are used to identify issues which need to spectrum ‘learning to learn’ is an indicator covering a be investigated further, and to suggest alternative much less easily measurable set of skills but nonethe- routes to policy goals. less critical for an unpredictable social and economic As an example we might look at existing data on the future where no comparable data is presently avail- use of ICT in schools. able. In between are subjects such as ‘civics’, for which little data as yet exists, and ‘foreign languages’, which has also still to be developed. ‘Information and com- munication technology’ (ICT) is also included in this Why choose ‘ICT attainment’ as indicator attainment set because, although little good data cur- for quality of education? rently exists, it will be a key indicator in years to come. This topic is selected because ICT is of the most criti- All of these areas of attainment remain important cal policy relevance. It is already having far-reaching goals for the future. effects on people’s lives and children’s learning, with, for example, 40 % of all UK market shares in ICT. 2. Success and transition. Why choose data on ‘the use of ICT in Into this area fall three indicators of highly significant schools’? policy relevance. They are closely inter-related — The indicator selected is simply one of many. It com- ‘drop-out rate from school’, ‘completion of upper pares countries’ approaches to the use of ICT as a cur- secondary education’ and ‘participation in tertiary ricular subject and/or as a generic tool. While the education’. data are limited in how much they reveal, they pro- vide an introduction to policy discussion by raising a number of questions about the future place, purpose 3. Monitoring of school education. and practice of ICT in European schools. For example: Two indicators currently fall into this area. These are • Which is better — to teach ICT as a subject in its ‘evaluation and steering of school education’ and own right or to use it as a tool across all subjects? ‘parental participation’. Both are concerned with stake- holder participation where heads of schools, teachers, • What does this mean for the education of teach- students and parents are key stakeholders, consumers ers — specialist skills or generic skills? of information and active players in school improve- ment. • What are the demands of the labour market — for high level specialists (e.g., programmers) or young people with broad computer literacy? 4. Resources and structures. And looking to the immediate and longer-term This category includes four indicators, each concerned future: with key aspects of infrastructure which underpin • What are the cost benefits of alternative forms school performance and pupil success. These are ‘educa- of provision? How much of learning can be inde- tional expenditure per student’, ‘education and training pendent, teacher-led, peer group-led, or home, of teachers’, ‘participation rates in pre-primary educa- school, or community based? tion’ and ‘number of students per computer’. EUROPEAN REPORT ON THE QUALITY OF SCHOOL EDUCATION | 7
  • 9.
    All the indicatorslead into a number of different pol- ity. In some cases data is long-standing and well- icy areas and into the examination of promising prac- researched. In some, data is new and less well tested. tices that already exist within Europe. Within each of In others there is no data available as yet but the indi- the indicator areas in this document, examples of such cator is included as an area of important emerging practices are illustrated. They suggest what can be policy issues. done with imagination and commitment. For instance, within ICT, examples are given of interesting initiatives In all cases, however, comparability has to be ap- in Estonia and Sweden. The Swedish example covers a proached with caution and an open mind. Even the number of key areas, including teacher education and most robust of data conceal historical and cultural dif- student resourcing, but carries significant cost impli- ferences and value systems. National goals and priori- cations. The Estonian example, on the other hand, sug- ties differ and will continue to differ but much may gests innovative ways of using hidden resources still be learned from innovative practice and new and (school students) to actually minimise costs and simul- different approaches to old problems. taneously raise achievement. So, indicators lead to So, promising or interesting examples of what is hap- benchmarks, to issues and questions and thence to pening across Europe are presented to stimulate dis- examples of practice which provide a focus for policy cussion further and to illustrate principles which may development in every European country. be transferable across countries. Some examples of practice go well beyond the parameters of the associ- ated indicator but in so doing illustrate the potential FROM DATA TO POLICY AND PRACTICE of the data to make a difference both at policy level In this report, each of the 16 indicators is presented in and in school or classroom practice. sequence, which does not represent an order of prior- 8 | EUROPEAN REPORT ON THE QUALITY OF SCHOOL EDUCATION
  • 10.
    B. FIVE CHALLENGESTO THE QUALITY OF EDUCATION IN EUROPE The new millennium may be only a symbolic change of more demanding resources of skills, attitudes and date but it marks an important stage for policy-mak- motivation to learn. It questions curriculum content ers in European countries. It encourages us to look to and the prioritisation and compartmentalisation of the future and turn our attention to the challenges ‘subjects’. which that future presents. For policy-makers, the Reading, mathematics and science claim their place as challenge will be to stay in touch with, and ahead of, indicators because they provide essential knowledge national and transnational movements which will tools and provide the foundations for lifelong learning change the face of Europe and impact on national sys- skills. Less easily measurable competencies in civics, tems of education. The 16 indicators presented in this foreign languages and ICT will be no less significant in report lead us to identify five key challenges for the the future. Least developed of all in terms of the indi- future: cator areas presented in this report are learning to • the knowledge challenge learn skills but, arguably, they may be the most critical and enduring of competencies in the society of the • the challenge of decentralisation third millennium. • the resource challenge All of these areas of knowledge and skills present ma- • the challenge of social inclusion jor challenges for the teaching profession and to the content of teaching in initial and in-service training. • the challenge of data and comparability. Indicators in these areas do not provide the answer but do raise critical questions about how and where teach- ers should be trained in the future and how continu- The knowledge challenge ing professional development can be ensured. The challenge of the knowledge society brings us back Change requires rethinking, reappraisal, re-evaluation to the essential purposes of school education, in rela- of accepted practices, challenging what has always tion to the world of work, to social life and lifelong been done and accepted. Change often requires both learning. The information explosion demands funda- restructuring and re-culturing of organisations. It im- mental rethinking of traditional conceptions of poses new demands on hierarchies, status and rela- knowledge, its ‘transmission’, ‘delivery’ by teachers tionships. It may unsettle teachers and puzzle parents and ‘acquisition’ by students. It raises questions about who have cast schools in the mould of what they the assessment and testing of knowledge and the knew. EUROPEAN REPORT ON THE QUALITY OF SCHOOL EDUCATION | 9
  • 11.
    However, as theexamples of promising practice show, to opportunities and thaosthey do not hinder pupils in these challenges are being met. Initiatives are under- achieving their full potential. way to up-skill teachers, to exploit new technologies, It has been argued thaoscentralised systems, which pre- to break new ground in learning to learn competen- scribe and control education inputs (curriculum, form cies. Meeting the knowledge challenge means learning content, etc.) need less monitoring and control than from the good and implementing the best. decentralised systems, which place less emphasis on the control of input and require greaoer emphasis on the control of output. A closer look at indicators on The challenge of decentralisation the steering and evaluation of systems does not en- During the last two decades, many European educa- tirely support such a contention but does reveal quite tional systems have devolved more autonomy and re- divergent systems enveloping apparently similar sponsibility to schools, bringing increasing demands pracoices. for accountability at school and, in some cases, class- room level. The scale and rate of decentralisation has been very different within European countries. In some The resource challenge (for example, the Netherlands and the United King- For many people within the educational systems the dom), schools have acquired a large measure of auton- solution to the pressures of change is more resources. omy, while in Belgium (Flanders), Denmark, Finland Education is increasingly being viewed around the and Sweden most decisions are now taken at school world as investment. While opening up choice to con- level. In Italy, a reform, which involves a greaost gree sumers in new educational markets, the economic im- of school autonomy, has been mooted since 1997. In perative is for cost-effecoive aloernatives to expensive Austria, reforms in 1993–94 enhanced the autonomy institutional pracoices. Technology will become cheap- of the schools. er and widely accessible while professional manpower will become scarcer and costlier, in both a social and The trend to devolve decision-making to school level is economic sense. The indicator on numbers of comput- a high stakes political strategy, the result in part of a ers per pupil is already daoed as schools experience lack of trust in the State’s capacity to respond ade- rapid increases in provision. The real challenge lies in quately to each and every need of an increasingly de- the most intelligent and cost-effecoive use and de- manding population. It has been argued thaosthose ployment of new technologies. most concerned with the outcome of a decision are in the best position to take decisions which most directly In most European countries there are twin trends affecosthem. In a sense, decentralisation is a means of which increase resource demands at both ends of the taking the political debate on quality down to lower compulsory schooling. More and more people are using levels of the education system. the education system for a longer and longer period of their lives, so increasing resource demands on educa- In doing so it raises questions about comparability, oion. Enrolment in further and higher education is in- equity, quality assurance and inspecoion. Empowering creasing steadily. Aosthe other end of the education stakeholders at lower levels means making them re- system, pre-school education is becoming more and sponsible for defining whaosthey understand by quali- more common and, alohough its nature and timing is a ty in education and giving them ‘ownership’ of their debaoed issue, there is wide agreement thaosearly part in the education system. childhood experiences have a deoermining influence on intelligence, on personal development and on sub- The process of decentralisation is often seen as both sequent social integration. However desirable, and positive and inevitable, but with its own attendant however much investment in early childhood repre- problems. Since it is the responsibility of the State to sents long-oerm investment,sthese accelerating trends provide quality education for all, there needs to be also bring pressure on resource provision and require some guarantee thaosthe system is, in fact, fulfilling creaoive policy thinking. thaosobjecoive. Decentralisation by its very nature leads to greaoer differences in standards among schools. The As provision becomes less institutionalised, individuals policy challenge is to acknowledge thaosthese differ- will need to adapt by assembling their own qualifica- ences exist, and to ensure thaosdifferences are turned tions, their own building blocks of knowledge, on the 10 | EUROPEAN REPORT ON THE QUALITY OF SCHOOL EDUCATION
  • 12.
    job, in moreinformal ways or in new contexts still to This indicator is a reminder that the relationship be- be identified. Learning throughout life is becoming the tween school and society is a vital ingredient in poli- key to controlling one’s future on both a professional cy-making. Policy-makers need to know the answers to and a personal level, making it possible to participate questions such as the following. more actively in society. 1. What implicit and explicit messages do schools Again policy-makers will benefit from data which convey on social inclusion? monitors important trends, but beyond the numbers 2. Where is the system losing young people — and and graphics lie issues about the nature and effective- why? ness of provision and the need for more and better data, sensitive enough to inform decision-making in 3. Where are the problems most acute? these areas. 4. Where can we identify successes in engaging and retaining young people? The challenge of social inclusion 5. What are the alternatives for the future? All European education systems aim to be inclusive, to offer children and young people the opportunity to The challenge of data and comparability benefit from school education and to prepare them for life after school. The 16 indicators presented in this report provide a timely reminder that countries can no longer look in- No system is entirely successful in achieving these aims wards, but that they must look outwards to see how and all countries recognise the increasing magnitude they are performing in comparison to their neigh- of the task. It is becoming all the more challenging be- bours. A new term has entered the policy discourse — cause school structures, curricula and the learning benchmarking. Benchmarks bring a new way of think- environment are seen by many young people as un- ing, about national performance, about local and re- congenial or irrelevant to their lives. For many there is gional effectiveness, and performance at the level of no apparent incentive from home or community to go individual schools. Benchmarks can be used diagnosti- to school and no benefit from attending on a regular cally and formatively to inform policy and practice but basis. All Member States are realising that the future are sometimes also viewed as a threat. brings a monumental challenge to traditional struc- tures of educational institutions. This means finding The challenge of comparability is to create an open ways of educating people beyond school and outside and positive climate for dialogue. Comparison which is the classroom, helping them acquire the skills and perceived as unfair becomes detrimental to the posi- competencies which will make them less vulnerable in tive and constructive use of benchmark data. The ob- the global economy. The European pilot project ‘Sec- vious place to start is with standards attained by chil- ond chance schools’, which presently counts 13 dren at school — their outcomes on leaving school, schools in 11 Member States, addresses this problem by their acquisition of basic skills at key stages of devel- showing that those young people who have left edu- opment. cation without the basic skills necessary to find jobs Data on pupil attainment at given ages is, however, of and permit integration can be reintegrated through limited use to policy-making without knowledge of individualised education and training schemes in close the conditions in which attainment is raised and cooperation with local employers. of limited value without an understanding of factors which contribute to good teaching and effective The civics indicator provides one measure of social in- learning. clusion. It reminds us of how ‘foreigners’, however de- fined, are perceived, and suggests that it is for social This raises the question of the availability of compara- agencies and schools in particular to address this issue. tive data. Many indicators in this report clearly lack Attitudes towards foreigners can be affected not sim- sufficient data to support a policy discussion and to ply through the context of the curriculum, but enable the identification of good practices. Problems through the very structures and culture of schools related to data have been identified and are listed themselves. below. EUROPEAN REPORT ON THE QUALITY OF SCHOOL EDUCATION | 11
  • 13.
    • The problemof obtaining data for all the coun- ing the best use of the ‘European statistical system’ tries involved. In only three cases have we been able to and the ‘Community statistical programme’ (4) would show full coverage of all the 26 countries involved by allow us to derive greater benefit from the use of using Eurydice data. These are the indicators covering: comparative indicators and benchmarks in terms of parents’ participation, ICT usage and evaluation and improving the quality of education. monitoring systems. The extension of the Eurostat UOE data collection and Labour Force Survey to all these countries is ongoing (five statistical indicators). Comparing systems • The problem of a lack of data in relation to specif- Europe is a rich mix of cultures and histories, brought ic indicators. The report is not currently supported by together in one union, facing common problems and data on attainment in foreign languages, learning to pursing common goals while preserving cultural and learn, ICT or civics. The results from the PISA study linguistic diversity. (OECD) and the IEA (International Association for the European countries share many common objectives. Evaluation of Educational Achievement) survey on They are all concerned to offer young people the civics, which will be published by 2001, will provide chance to achieve high levels of literacy and numera- answers to some of these problems, but for ‘foreign cy, to provide a stimulating school experience and to languages’ there are no measures in place to address instil a desire for learning which will serve young peo- the lack of available data. Furthermore, data on ple well for their lives beyond school. Such objectives parental participation, and more broadly ‘stakeholder are not contested. Nor is there disagreement about key participation’, clearly needs to be further elaborated subjects of the school curriculum. This background than is presently the case, as does data on the evalua- provides a strong basis for sharing and learning from tion and monitoring of school education. In the latter one another. case, new comparative data should look in particular at the links between external and internal evaluation. However, subject areas are given different priorities in different Member States. Varying emphases are placed • For some indicators, the age of the data used is on the context of learning at different ages and clearly a problem. This is particularly so in the field of stages. Methodologies differ. Teaching and learning is ‘reading’, where the data used in this report are almost embedded in different structures. Countries diverge in 10 years old. Publication of some new data is, howev- their linguistic and cultural histories. These cultural er, planned within the coming months and years. This patterns bring a depth and richness to the dialogue at is the situation for six of the seven attainment indica- European level. They provide a strong basis for Mem- tors (mathematics, reading, science, learning to learn, ber States to learn from one another. ICT, civics). The availability of regularly updated valid data will continue to be of major concern. This is why, in selecting indicators and benchmarks, it is important to choose those which are most genera- • The problem of the usefulness of the data has tive in stimulating an open policy dialogue; one which been discussed throughout the preparation of this re- looks forward — to policy implications of the data and port. One could question whether the data which is lines for further inquiry in the future. Data for all presently available, or planned, on attainment levels countries are embedded in a cultural and historical provide sufficient insight into each country’s educa- context. All data are suggestive rather than definitive. tional specificity. Establishing a strong awareness of Indicators should be regarded as starting points, limit- the particular nature of a country’s educational system ed in their internal meaning but unlimited in their im- would better allow countries, which may so desire, to plications for improving raising standards for all. take remedial action in specific areas. More refined methodologies would allow a move away from straightforward comparisons and allow the reader to understand better not only the levels of skills in spe- cific areas but also how these skills are attained in diverse educational systems. (4) Council Decision No 1999/12/EC of 22 December 1998 on A common approach between European countries to the Community statistical programme 1998 to 2002 (OJ defining the indicator needs and methodologies mak- L 42, 16.2.1999, p. 1). 12 | EUROPEAN REPORT ON THE QUALITY OF SCHOOL EDUCATION
  • 14.
    SIXTEEN INDICATORS ONTHE QUALITY OF SCHOOL EDUCATION Indicators on attainment Indicators on monitoring of education 1. Mathematics 11. Evaluation and steering of school education 2. Reading 12. Parent participation 3. Science 4. Information and communication Indicators on resources and structures technologies (ICT) 13. Education and training of teachers 5. Foreign languages 14. Participation in pre-primary education 6. Learning to learn 15. Number of students per computer 7. Civics 16. Educational expenditure per student Indicators on success and transition 8. Drop-out rates 9. Completion of upper secondary education 10. Participation in tertiary education EUROPEAN REPORT ON THE QUALITY OF SCHOOL EDUCATION | 13
  • 15.
    1. MATHEMATICS Asolid grounding in mathematics belongs at the very core of the educational curricu- lum. Analytical skills, logic skills and reasoning are all enhanced through the study of mathematics. Compulsory training of children in mathematics is therefore an important requirement for participation in society, ultimately making an indispensable contribution to national competitiveness and the knowledge society. All countries seem to share this view and place basic learning in mathematics at the heart of early learning. The year 2000 has been announced ‘Year of mathematics’ by the International Mathematical Union and sponsored by Unesco. % of items with a correct answer 80 80 70 70 60 60 8th 50 50 7th 40 40 30 30 20 20 10 10 (:) (:) (:) (:) (:) 0 0 Japan Scotland Romania USA Germany Greece Spain France Italy Ireland Luxembourg Netherlands Austria Portugal Finland Sweden England Bulgaria Czech Rep. Estonia Latvia Lithuania Hungary Poland Slovenia Slovakia Flemish com. Denmark French com. Cyprus United Kingdom Belgium 7th grade 8th grade Average TEST RESULTS IN MATHEMATICS (13-YEAR-OLD STUDENTS), 1995 (:) Data not available Source: IEA, TIMSS. 14 | EUROPEAN REPORT ON THE QUALITY OF SCHOOL EDUCATION
  • 16.
    The graph showsthe results of an international math- Some caution should be taken with the data with re- ematics ability test: the Third International Mathemat- gard to the comparability of the results of the partici- ics and Science Study (TIMSS). TIMSS is a collaborative pating countries. Attention should be drawn to some research study conducted by the International Associ- potential problems. Firstly, some of the participating ation for the Evaluation of Educational Achievement countries did not fulfil the guidelines for drawing the (IEA). Tests were taken in 1995 by samples of, among samples, thus the results cannot be guaranteed to be others, classes from the two adjacent grades with the fully representative. Secondly, it must be remembered largest proportion of 13-year-old students (seventh that the pupils in the participating countries are ac- and eighth grades in most countries). In the survey, customed to different types of test. The types of task which covered 41 systems of education worldwide, the presented in the TIMSS tests, and the manner in which ability of seventh and eighth grade pupils to handle the tests were conducted, may have been familiar to mathematical symbols, terms and models, and their some students but unfamiliar to others. This may ex- mathematical thinking and problem solving abilities plain some of the variations between countries. There were all measured. were also slight differences in age among pupils test- ed. Furthermore national differences between curricu- The findings of the TIMSS study will be complemented by la might also have had an impact on results. OECD’s PISA study (Programme for international student assessment) which will be carried out later this year. The Compared to their overall performance, almost all first results of this study will be published in 2001. countries did relatively better in some content areas than they did in others indicating differences in the The graph shows the average scores of seventh and curriculum emphasis between countries. Significant eighth grade pupils from each country. The two hori- differences in results can, for example, be found be- zontal lines show the international averages for the tween geometry and algebra. The TIMSS survey points European and pre-accession countries in the seventh to a range of factors that appear to be linked to high (lower line) and eighth grades (upper line). The differ- achievement in mathematics, including the following. ences between grades vary from 1 percentage point in Belgium (Flanders) to 10 percentage points in France • A clear positive relationship between a stronger and in Lithuania. liking of mathematics and higher achievement. How- ever, even in some high-scoring countries such as the European countries achieved very varied results, in Czech Republic, Austria and the Netherlands, mathe- terms of percentage of correct answers in the test. They matics is not necessarily very popular, with more than ranged from 65 % in the seventh grade (Belgium (Flan- 40 % of students reporting that they disliked it. ders)) to 37 % (Portugal) and from 66 % in the eighth grade (Belgium (Flanders) and the Czech Republic) to • A strong positive relationship between achievement 43 % (Portugal). It is particularly interesting to note that and home environment — better educated parents, the central European countries such as Bulgaria, the Czech availability of study aids at home such as dictionaries, Republic, Hungary, Slovenia and Slovakia performed es- computers and a study desk for the student’s own use. pecially well. When the test results from the seventh and There were other factors where the TIMSS survey could eighth grades, shown here, are compared with those establish no clear link with achievement. They includ- from the fourth grade, also available in the TIMSS sur- ed class size, number of instructional hours in class, vey, they show a very similar pattern of results in terms amount of homework and gender. of the relative positions of the countries. This suggests that the relative abilities in mathematics are established early in the educational process. KEY POLICY ISSUES CONCERNING MATHEMATICS In the light of this, however, it is surprising that there The key policy issues set out here are based partly on does not appear to be any strong connection within international discussion of the results of TIMSS, but countries between the TIMSS results for pupils in the they are also linked to wider educational debate: eighth grade and those in the final classes (12th or 13th grade). A very high level of performance among The development of teaching methods which ensure eighth grade pupils, in relation to other countries, does that pupils have a positive attitude towards mathe- not necessarily mean a comparably high level among matics, and that they are motivated to learn mathe- 12th grade pupils. matics and encouraged to study and apply mathemat- EUROPEAN REPORT ON THE QUALITY OF SCHOOL EDUCATION | 15
  • 17.
    ical laws independently.How can such a culture of teaching and learning be developed and maintained in the field of mathematics, and how can the impor- tance of mathematics be demonstrated in order to motivate pupils to learn? The issue of positive and negative attitudes towards mathematics which could influence students’ choices of subjects studied in tertiary education. Many coun- tries experience difficulties in attracting students to technical and scientific studies. What experiences and positive actions exist to encourage students to pur- sue such fields of study, and to overcome negative attitudes towards mathematics in this context? Mathematics is considered to be at the very core of the educational curriculum. High attainment levels in mathematics are central for access to some key areas of higher education and many professional careers. But mathematical ability is a core sG .pne sc18.zens.9(s.)]TJT730.1108tiesss andabiTwknowledgeudis i
  • 18.
    2. READING Readingskills play a central role in an individual’s learning at school. The ability to read and understand instructions and text is a basic requirement of success in all school sub- jects. The importance of literacy skills does not, however, come to an end when children leave school. Such skills are key to all areas of education and beyond, facilitating par- ticipation in the wider context of lifelong learning and contributing to individuals’ social integration and personal development. The indicator is based on an IEA survey in which three areas of reading literacy were as- sessed: narrative prose, expository prose and documents. It concerns six different skills or processes related to these areas. % of items with a correct answer 80 80 70 70 60 60 50 50 40 40 30 30 20 20 10 10 (:) (:) (:) (:) (:) (:) (:) (:) (:) (:) (:) (:) 0 0 New Länder Old Länder French com. Denmark Greece Spain France Ireland Italy Luxembourg Netherlands Austria Portugal Finland Sweden United Kingdom Bulgaria Czech Rep. Estonia Cyprus Latvia Lithuania Hungary Poland Romania Slovenia Slovakia USA Japan Belgium Germany Average TEST RESULTS IN READING LITERACY (14-YEAR-OLD STUDENTS), 1991 (:) Data not available Source: IEA, Reading literacy. EUROPEAN REPORT ON THE QUALITY OF SCHOOL EDUCATION | 17
  • 19.
    The data forthe proposed indicator comes from the policy-makers can exert some influence on these re- IEA. The tests were taken in 1991 by samples of the sources, their distribution or their use. The most effi- classes of the grades with the largest proportion of cient of these variables relates to the presence of 9-year-olds and 14-year-olds in 32 systems of educa- books in the community and parental cooperation tion. In the longer term, as with mathematics and sci- with the school. ence, indicators from the PISA survey will be published in autumn 2001. In addition, the IEA is preparing a new study about reading literacy. KEY POLICY ISSUES CONCERNING READING The graph above shows the mean percentages of items At secondary school level, public libraries and book- successfully answered by the sample of 14-year-old shops can make an essential contribution to reading students in each country. The horizontal line corre- skills; the regular addition of new books to the school sponds to the mean success percentage calculated for library, the existence of a reading room and a teachers’ the European and pre-accession countries. library are worth considering. They can also play an As the average age of students was not exactly the important part in providing interesting reading mate- same in the different countries, their scores may be rial for pedagogic use. How can the number and slightly underestimated (Italy, Hungary, Spain and Bel- quality of books available to students — and also to gium) or overestimated (Portugal and France). teachers – be enriched? The average score is 72 %. It is not always easy to As is the case for computers (see the ‘students per make sense of this kind of international comparison computer’ indicator), a sufficient number of high- without some sort of frame of reference to tell us, for quality books is necessary, but this alone will not guar- example, what ‘15 %’ actually means. One can analyse antee high attainment levels in reading. The books the data and see that, based on 14 identical items must be used in the most efficient way in order to en- from the test, the difference between the scores of hance both students’ interest for and competence in 9-year-olds and 14-year-olds was around 24 %. reading. How can teachers be supported in address- Although this information should be treated with cau- ing the needs of different age groups? How can the tion it does provide a guideline — for example, if we cross-curricular nature of reading be taken into consider Belgium and Finland, separated by 15 per- account in teacher training? centage points, we can see that 15 percentage points As in other domains, parental participation (see rele- represents about two thirds of the average interna- vant indicator) is important. How can parental partic- tional progress observed between 9 and 14 years in the ipation be achieved, particularly for students with 14 items referred to above (Elley, 1994: see Annex 2). poor reading skills? How can parents be supported in Analyses have been carried out in order to determine their role? what variables may be linked to the level of reading Young people are increasingly faced with forms of me- achievement, both between countries and within each dia which include written material (advertising, televi- country. It should, however, be stressed that although sion, CD-ROM, and multimedia, for example). How can statistical analyses show links between achievement curriculum development and teacher training best and some other variables, no country follows exactly be managed in order to equip young people with lit- the same pattern. The results point more to areas for eracy skills for the future and to allow them to further exploration than to definitive solutions for im- analyse in a critical way the information conveyed proving reading attainment. by the media? • The countries’ averages are linked to some charac- teristics of the home environment (such as the pres- ence of books, newspapers, etc.). EXAMPLES OF NATIONAL INITIATIVES • Some individual students’ characteristics, such as (For more information see Annex 1) gender, also play a part in reading performance. Denmark — Efforts to increase the level of attainment • The level of certain school resources is also associ- in reading in compulsory education in Denmark by re- ated with reading literacy achievement. Educational inforcing the subject in the curriculum. 18 | EUROPEAN REPORT ON THE QUALITY OF SCHOOL EDUCATION
  • 20.
    Germany — Newspapersin schools — over a period of three months, students receive ‘their’ daily newspaper (without paying for it). This is then used systematical- ly within different subject matters at school. Italy — The 1998 ‘Progetto lettura 2000’ programme aims to promote the development of school libraries and to encourage reading among students in all kinds of school. Sweden — Parents of students aged 10 to 12 are en- couraged to spend half an hour per day reading a good book with their child. The authorities have sup- ported this initiative, providing money to buy interest- ing books that both students and parents enjoy. EUROPEAN REPORT ON THE QUALITY OF SCHOOL EDUCATION | 19
  • 21.
    3. SCIENCE Sciencegives pupils the tools to investigate their environment and to experiment, thus increasing their ability to analyse and make sense of the world around them. It promotes curiosity and critical thinking about a wide range of issues such as the environment, liv- ing things, health and other issues. Science can also help pupils to develop an awareness of the inter-relationship between people and nature, and an understanding of the finite nature of the earth’s resources. At the level of European economy, scientific disciplines are the bases for much of the core foundations of business and industry. In a national perspective, well-trained researchers are indispensable to technological progress, the im- pact of which transcends national frontiers. % of items with a correct answer 80 80 70 70 60 60 50 50 40 40 30 30 20 20 10 10 (:) (:) (:) (:) (:) 0 0 Scotland Germany England French com. Flemish com. Denmark Greece Spain France Ireland Italy Luxembourg Netherlands Austria Portugal Finland Sweden Bulgaria Czech Rep. Estonia Cyprus Latvia Lithuania Hungary Poland Romania Slovenia Slovakia USA Japan United Kingdom Belgium 7th grade 8th grade Average TEST RESULTS IN SCIENCES (13-YEAR-OLD STUDENTS), 1995 (:) Data not available Source: IEA, TIMSS. 20 | EUROPEAN REPORT ON THE QUALITY OF SCHOOL EDUCATION
  • 22.
    As with mathematics,the proposed aggregated indicator level does not necessarily imply that the school system is taken from the Third International Mathematics and is a good one; disparities between highest and lowest Science Study (TIMSS) (see the ‘mathematics’ indicator achievers in a particular country may still be very for more detail about this study). The test covers five ar- large. The gap could be linked to socioeconomic differ- eas: earth science, life science, physics, chemistry, as well ences as well as other factors (such as differences be- as environmental issues and the nature of science. Stu- tween curricula, differential selectivity, organisational dents were expected to understand simple or complex in- structure, etc.). formation, to theorise, analyse and solve problems, to use The study points to some variables which seem to be tools, routine procedures, and scientific processes and to related to the results. As concerns gender, boys per- investigate the natural world. An analysis of how the test form better than girls in all countries (fourth grade) corresponds to the curriculum in different countries has and significantly so in Austria, Hungary, Netherlands shown substantial variations in the number of items and the Czech Republic; and factors such as motiva- which each country considers appropriate. However, tion, status of scientific studies and jobs, and method- when countries’ results in the test as a whole are com- ological practices, also seem to be related to results. pared with their results in a selection of items relevant to their own curriculum, their relative positions in the study are not significantly affected. KEY POLICY ISSUES FOR DISCUSSION CONCERNING The graph shows the average scores of seventh and SCIENCES eighth grade pupils from each country. The two thick All citizens should to be able to access and use new lines show the international averages for the European technologies for their own benefit and for the eco- and pre-accession countries in seventh (lower line) and nomic and social improvement of the society. It is thus eighth grades (upper line). The gap between the two important to look not only at the average level of at- averages (6.4 %) gives an idea of the difference be- tainment, but also at the gap between higher and low- tween the performances of the seventh and the eighth er achievers. How can all students be encouraged to grades students. develop sufficient interest in science and in scien- Some caution should be taken with the data. In some tific thinking? cases, the error due to sampling may be larger than the It is crucial to distinguish between the contribution difference between the averages. Thus, for example, the made by schools, and other more fixed parameters average in Greece (grade 8) cannot be considered to be such as those resulting from social conditions. In order different from the average in Germany (grade 7). As the to reduce disparities and raise average attainment lev- average age of students was not exactly the same in each els, it is essential to focus on what schools and teach- country, the scores of countries may be slightly under- or ers can do. How can students learn to use the most- overestimated. It is also important to take into account efficient methodologies in experiencing science the fact that some countries did not meet all the sample through practical experiment? criteria for one or more of the areas concerned. In many countries, students’ interest in science, espe- The graph shows some significant differences between cially the physical sciences, is declining. As a result, the countries. Among the European countries, the differ- number of students taking science is dropping. What ence between the highest-achieving country (the Czech can we do to find out the reasons for this decline, Republic, eighth grade: 64 %) and the lowest-achieving and to increase the numbers taking science? one (Cyprus, eighth grade: 47 %) is 17 %. If we consid- er this difference in relation to the difference between average performance in the seventh grade and the EXAMPLES OF NATIONAL INITIATIVES eighth grade, we see that a gap of 17 % represents ap- proximately 2.7 years of student progress. Japan obtains (For more information see Annex 1) very high results at both levels, whilst the United States’ score is closer to the European mean, particularly at Europe — ‘Women in science’ is a mobile exhibition eighth grade. illustrating the history of science through the achieve- ments of women in different periods of history and It is important to consider the distribution of the re- current trends in the feminist approach to science. It is sults around each national average. A good average organised by European networks and the European EUROPEAN REPORT ON THE QUALITY OF SCHOOL EDUCATION | 21
  • 23.
    Commission to promoteequal opportunities at school, at university and in careers. Ireland — European Union Physics Colloquium — the colloquium examined approaches to physics education at upper secondary level in Ireland and eight other European education systems. Italy — 1999, ‘Progetto SET — SET project’ — aiming to enhance pupils’ scientific and technological culture and to raise their achievement levels, improving teach- ing quality. Slovakia — ‘Schola Ludus’ promotes science education by interactive exhibitions touring the country. Spain — The National Science Museum has a guide of school programmes for permanent exhibitions, tempo- rary exhibitions, workshops, guided visits, educational materials and courses. 22 | EUROPEAN REPORT ON THE QUALITY OF SCHOOL EDUCATION
  • 24.
    4. INFORMATION ANDCOMMUNICATION TECHNOLOGY (ICT) In all European countries there is a broad consensus on the importance of new tech- nologies. Information and communication technologies are not only having an impact now but will affect the structure of human societies even more so in the future. They are having an accelerating impact on the way we learn, live, work, consume, express and entertain ourselves. Learning will be ineffective if teachers fail to make coherent connections between learn- ing in and out of school or if they do not exploit the vast potential of new multi- sensory and interactive media. Separate subject LI Separate subject and used as a tool for other subjects CY Used as a tool for other subjects Not included in the curriculum APPROACHES TO ICT DEFINED IN THE CURRICULUM — LOWER SECONDARY EDUCATION, 1997/98 Source: Eurydice. EUROPEAN REPORT ON THE QUALITY OF SCHOOL EDUCATION | 23
  • 25.
    Data on theprovision and use of information and In the longer term, data on ICT will need to go consid- communication technology (ICT) will be a growth area erably further to say something about how ICT is being in the future. As more information becomes available deployed and exploited for more effective pupil learn- (for example through the IEA SITES study), indicators ing, for out-of-school learning (homework and study), will provide more detailed information on the effec- for professional development of teachers, for school tive deployment of ICT and skills acquired (as current- improvement and systemic change. ly in other areas such as mathematics or literacy). The map below provides a picture of uses of ICT in Euro- pean countries showing where it is not as yet included KEY POLICY ISSUES CONCERNING ICT in the curriculum, taught as a separate subject, or used as a tool for other subjects. Inclusion: With access to information freely available, those who are motivated and skilled will increasingly The map distinguishes four different uses of ICT. In most benefit while those who are not will be at an increas- of the eastern European countries ICT is treated as a sep- ing disadvantage. The gap between the ‘haves’ and the arate subject. In Norway, Sweden and Ireland it is seen as ‘have nots’ is likely to widen significantly in the future. a tool for use across the curriculum, while more typically What forms of support or intervention can be pro- in central European Member States (plus Iceland, Fin- vided for the most disadvantaged and vulnerable land and Latvia) it is both a subject and a tool. In Portu- sections of the population? gal, Cyprus and Italy it is not formally taught. In Finland, decisions are made at local level and the treatment of Special needs: Information and technology has a par- ICT may, therefore, differ widely. There will also be dis- ticularly significant role to play for children with spe- parities within other countries despite the existence of cial educational needs. What can be done to identify national curricula or guidelines. good practice in this area and to disseminate it ef- fectively for the benefit of special needs pupils, their Caution has to be exercised in the interpretation of parents and their teachers? such data given that this is an area which is changing so rapidly and in which data cease to be 100 % accu- Teacher skills: One of the obstacles to development of rate by the time they are published. Within a few years ICT skills of pupils is lack of teacher skills or resistance most, if not all, countries will be able to show that ICT to the use of ICT among teachers who see it as a threat permeates subjects across the whole curriculum and to their jobs. How can teachers in every subject area that pupils routinely use ICT for homework and study be trained in skills which help them harness ICT to in all subjects. The precedent set by Iceland, where all make for better teaching? senior pupils are provided with their own laptops, will become increasingly commonplace and such individual Pupil expertise: Expertise of children and young peo- access will carry major implications for learning and ple already far exceeds that of their teachers in many teaching. instances. What might schools do to fully exploit the skills of young people to support teachers and teach Nonetheless, the data provide an important baseline their fellow pupils? from which to monitor progress and raise policy issues for the future. Many countries have experimental and pilot projects in the use of ICT which are not repre- EXAMPLES OF NATIONAL INITIATIVES sented on this map (see ‘Examples of national initia- tives’, below). (For more information see Annex 1) Therefore, in interpreting data, caution needs to be ex- Europe — The eEurope initiative aims to make digital ercised with regard to the changing scene and wide literacy one of the basic skills of every young Euro- variations that may exist at local or school level. At pean. eLearning is intended to implement the educa- national level there may be no obvious curricular pol- tion/training part of eEurope. icy on the use of ICT. Imaginative cross-curricular ini- tiatives may still be found at individual school level Cyprus — The new ‘unified lyceum’ will have three key and these may provide cutting-edge example for objectives: upgrading the ICT skills of pupils; upgrad- countries in which ICT is more widespread and institu- ing schools’ technological equipment; and improving tionalised at national level. staff competencies. 24 | EUROPEAN REPORT ON THE QUALITY OF SCHOOL EDUCATION
  • 26.
    Estonia — Insome Estonian schools, senior pupils are required to spend four hours a week on mentoring and tutoring younger children in ICT. Hungary — Initiatives are underway to promote new methods and teaching aids that make use of ICT tech- nology in a range of school disciplines. Italy — The ‘Programma di sviluppo delle tecnologie didattiche 1997–2000’ was promoted to spread the use of information and communication technologies (ICT) and aims to improve the teaching/learning processes. The ‘Multilab’ is aimed at embracing teaching through classroom use of computers, online and multimedia technologies. More information is available on the In- ternet (http://multilab.tin.it) (www.cede.it). The Netherlands — ‘Knowledge net’ brings together pupils, parents, teachers and cultural organisations through a computer network which provides various services including information, discussion groups and technical facilities. Poland — The ‘Interkl@sa’ programme aims to prepare young people for the information society and to de- velop the school as a modern centre for innovation and creation. Slovakia — The ‘Info-age’ project (www.infovek.sk) is aimed at the improvement of ICT in primary and sec- ondary schools. Slovenia — In 1994 a long-term ICT programme ’Racunalnisko opismenjevanje’ (http://ro.zrsss.si/) was ˇ ˇ established to spread the use of information and com- munication technologies. Spain — All Spanish State schools have an Internet ac- count. More information (in Spanish) can be found on the Internet (http://www.pntic.mec.es). Sweden — The Government offers in-service training for school leaders and teacher teams to learn how to use computers as a tool. EUROPEAN REPORT ON THE QUALITY OF SCHOOL EDUCATION | 25
  • 27.
    5. FOREIGN LANGUAGES Proficiency in several Community languages has become a prerequisite if citizens of the European Union are to benefit from the professional and personal opportunities open to them in the single market. It is, to say the least, paradoxical that people and ideas cir- culate less freely within today’s Europe than capital and goods. Difficulty with foreign languages, according to a Eurobarometer survey carried out in 1997, is by far the most feared problem when young Europeans contemplate working or studying abroad. Enlargement of the European Union in the future will make proficiency in modern languages even more important. Language proficiency is a key instrument for a common understanding between citizens of Europe and for exploiting the rich cultural heritage of Europe. The decision of the European Commission to make 2001 the ‘European year of foreign languages’ underlines the political importance attached to knowledge of foreign languages. Knowledge of a foreign language (%) 40 50 60 70 80 90 100 0 I FIN S P L 10 E DK D NL EL B A 20 F IRL 30 UK 40 No wish to learn a foreign language (%) ATTITUDE TO AND SELF-ASSESSMENT OF FOREIGN LANGUAGES AMONG THE 15- TO 24-YEAR-OLD POPULATION, 1997 Source: Eurobarometer. 26 | EUROPEAN REPORT ON THE QUALITY OF SCHOOL EDUCATION
  • 28.
    It should firstbe made clear that, in the following ulation say they can hold a conversation in it). Com- paragraphs, the term ‘foreign languages’ refers to petence and interest in foreign language learning modern languages other than one’s mother tongue, thus seem to vary greatly from one country to the whether second languages, or actual foreign lan- other and to depend on social and cultural factors, guages as such. Despite the importance of learning a among others. foreign language, there is currently virtually no inter- national data available about the linguistic compe- tence of young Europeans. The next phase of the PISA KEY POLICY ISSUES FOR DISCUSSION CONCERNING survey will probably comprise a measure of the read- FOREIGN LANGUAGES ing comprehension in a foreign language as an inter- national option. It must be remembered that valid measures of young people’s proficiency in foreign languages are required. Pending more adequate information, we can use, with However, the data available indicate strongly the im- an appropriate degree of caution, the responses of portance of several issues. young Europeans to a Eurobarometer survey. In early 1997, at the request of the European Commission’s Ed- • The choice of the languages to be taught is both ucation, Training and Youth Directorate-General (XXII), politically and pedagogically very important: if every a sample of 9 400 young people, intended to be repre- European language is considered a part of cultural sentative of those aged between 15 and 24 in every wealth and just as relevant as any other, active meas- European country, was asked the following questions — ures have to be taken. How can young people’s in- ‘Apart from your mother tongue, which of these lan- terest in people of other cultural and linguistic guages can you speak well enough to take part in a communities, and in their languages, be devel- conversation?’ and ‘Which ones, if any, would you like oped? to learn?’. The 11 official languages of the European • Some strategies aimed at promoting linguistic di- Union were proposed, as well as the answers ‘other’, versity concern language teaching itself: for example, ‘none’ or ‘don’t know’. the development of young children’s interest and com- The graph shows, for each participating country, the petency in several languages instead of introducing percentage of young people claiming to be able to them to only one language (‘language awareness’ ap- speak at least one ‘foreign’ language and the percent- proach). How can teachers’ competency in these age of those who said that they did not want to learn methods be increased? a foreign language. It should be noted that the first • Within the context of lifelong learning, but also question in this survey addresses the perceived person- in order to achieve good short-term results in lan- al abilities, and not the actual capacities, of the young guage learning, it is important to increase young peo- people. ple’s interest in foreign languages. How can pupils be There seems to be a link between how widely spoken made aware of the advantages of good language a country’s official language is, and both the ability of skills? young people to speak another language and their • Some degree of self-confidence is necessary in or- desire to learn another. This leads to the formation of der to speak another language and to interact with two broad clusters seen on the graph, with countries people whose language is different to one’s own such as Denmark, Netherlands, Sweden and Finland in mother tongue. How can foreign languages be one (countries whose languages are relatively less taught in a way which promotes students’ self- widely spoken) and France, Germany, Spain, Ireland confidence? and Austria in the other (countries whose languages are widely spoken). Greece, however, appears to be an The age at which language learning starts, the amount exception to this rule. The situation in the UK is clear- of time spent on language learning in the curriculum ly more extreme, and unlikely to be the result solely and the languages which may be chosen can all play of the linguistic dominance of the English language an important part in the development of foreign lan- (English is the most widely spoken language in the guage competency. How should the curriculum be or- European Union, the mother tongue of 16 % of the ganised in order to make foreign language learning population and an additional 31 % of the adult pop- as efficient as possible? EUROPEAN REPORT ON THE QUALITY OF SCHOOL EDUCATION | 27
  • 29.
    EXAMPLES OF NATIONALINITIATIVES (For more information see Annex 1) European Union — The aim of the ‘European label’ is to help stimulate interest in language learning by highlighting innovative language learning projects at all stages of education and training. Belgium — Department of Education offers courses in 18 languages, both European and non-European. Access to these courses is made easy and very cheap. Some lan- guage courses are available as distance learning Bulgaria — In order to improve the teaching of foreign languages, the Bulgarian Ministry of Education and Science (MES) decided to create in 1996 a national network of so-called ‘teacher methodologists’. Hungary — The ‘European language portfolio’ (ELP) — a personal document in which the students can record their qualifications and other significant linguistic and cultural experiences in an internationally transparent manner. Ireland — A project aimed at increasing the range of foreign languages taken by students in secondary school. 28 | EUROPEAN REPORT ON THE QUALITY OF SCHOOL EDUCATION
  • 30.
    6. LEARNING TOLEARN The true test of the lifelong learner is the extent to which he or she is able to go on ac- quiring skills and knowledge in a wide variety of life situations, once formal education has come to an end. Effective learners know how to learn and have a repertoire of tools and strategies to serve that purpose. The flow of new information and the rise of international cooperation have increased the importance of such skills while the unpredictability and rapidity of change requires a closer connection between school education and lifelong learning. These are prerequi- sites for success in the academic world, the world of work and the society of the future. Learning to learn encompasses intellectual skills, atti- can be used as a starting point for debate at the Euro- tudes and motivation. For example, attitudes to one’s pean level. A number of countries have already estab- self, perceptions of one’s own competence, ability to lished systems to identify and measure ‘learning to think about one’s thinking (metacognition), inferring learn competencies’ or are developing them with the meaning from a text, awareness of one’s own preferred aim of understanding success and failure at school and learning style, persistence in the face of difficulty, mo- how these competencies can transfer to social and tivation to learn. professional life (see ‘Examples of national initiatives’, below). These are skills acquired and developed in various con- texts — classrooms, homework, independent study, For the purposes of inter-country comparison, there- day-to-day problem solving situations. They are em- fore, we may gather data to illustrate countries in bedded in all subjects and areas of study and integral which: to ‘cross-curricular competencies’. The challenge is to • learning to learn policies or guidelines already help people to: exist; • be reflective and self-critical learners; • there is public dissemination (e.g. Ministry web page, circulation of documents); • access tools which help them become more effi- cient and effective; • pilot initiatives are taking place; • be able to transfer learning to learn skills from • courses/programmes exist in pre-service and/or in- one context to the next; service teacher education; • equip themselves to deal with new and unpre- • no policy or initiatives yet exist. dictable situations in the future. The indicator may take the form of a map of Europe Data at European level do not as yet exist. This should, plotting policy development, for example, by degrees of however, be treated as a high priority. It is important shading to illustrate the development and penetration to identify examples of good practice and data which of policy initiatives. These data will illustrate a spectrum EUROPEAN REPORT ON THE QUALITY OF SCHOOL EDUCATION | 29
  • 31.
    of practice, showingclusters of countries that have • for curriculum design and delivery? made considerable progress in putting policy into place and from which important lessons may be learned. • for teacher knowledge and skills? In the longer term we could develop ways of gauging • for school leadership and management? learning to learn competencies at student level • for teacher education — pre- and in-service? through: • students’ own assessments of their knowledge, EXAMPLES OF NATIONAL INITIATIVES confidence, and competency in this area; (For more information see Annex 1) • performance assessment using standardised tests which provide comparable data on how students cope Belgium (Flanders) — Learning to learn skills are al- with new and unforeseen content. ready a compulsory aspect of the 6 to 18 years’ core curriculum. They are presented as a cross-curricular The effectiveness of learning to learn skills is demon- theme to be integrated and applied in as many sub- strated in situations to which students bring no prior jects as possible. content knowledge but in which they are able to demonstrate that they know what to do in order England — The Department for Education and Employ- to acquire, analyse and use new information, and to ment has published a report on thinking skills. process new data. Finland — Research has been conducted as a prelude In 2001, PISA data in this area will be available for the to developing a new form of national assessment. first time and will provide a new source of European level data. With a more informed body of data, future Germany — Widespread curriculum revision is taking indicators will identify the acquisition of learning to place and pupils are being encouraged — through texts learn skills at key stages of schooling. We can see from and questionnaires — to reflect on their working existing practice that different approaches are already habits, their learning strategies, their ability to com- in place and used at different ages and stages. In the municate and cooperate. Netherlands, for example, pilot initiatives are targeted Italy — A repertoire of instruments has been developed at 14 to15 year olds, in Italy for the 10 to 17 years’ age to measure learning to learn competencies and to pro- range, while in Flemish Belgium these skills are a part of vide teachers with simple tools which they can use for the compulsory curriculum for 6 to 18 year olds. remedial and individualised intervention. The Netherlands — A cohort study of 20 000 second- KEY POLICY ISSUES CONCERNING LEARNING TO ary students is repeated every five years using a test LEARN SKILLS developed to measure the general problem solving ca- pacities of 14- to 15-year-old pupils. Indicator data should provide a basis for considering a number of important policy questions. Significant progress is being made through pilot proj- ects in different European countries. The challenge for policy-makers is to identify, learn from and build on the best. What short-, medium- and long-term ini- tiatives will ensure that learning to learn skills be- come a policy priority? There is likely to be inertia and resistance, both at a structural and cultural level. What are the main ob- stacles to progress and how can they be overcome? There are practical implications which flow from new policy directions. What are the implications of new priorities: 30 | EUROPEAN REPORT ON THE QUALITY OF SCHOOL EDUCATION
  • 32.
    7. CIVICS Allsocieties have a continuing interest in the way their young people are prepared for citizenship, and how they learn to take part in public affairs. In most countries, a considerable number of people tend nowadays to attribute problems such as violence, unemployment and criminality to those who are different, without a deeper understanding of the root causes of the issues. The question of what effective citizenship means and the role of formal education in building a civic culture is important not only for governments and policy-makers but also for the public in general. IEA has recently assessed the attitudes and competen- nately the first report on the results of this study is cies in the domain of civics of several thousand stu- not expected until February 2001. In the meantime, no dents in the modal grade for 14 year olds (in 20 coun- recent international assessment of young peoples’ atti- tries out of those which are directly concerned by the tudes and competencies in the domain of civics is present report). The study examines young people’s available. However, Eurobarometer No 47.2, which re- knowledge, beliefs and attitudes in different areas — ports the results of a survey of young people from 15 such as democracy, political authorities, rights and to 24 years old in the 15 European Union countries, duties — in relation to citizenship, national identity, gives some interesting information in this domain. The social cohesion, equal rights and tolerance. Unfortu- opinion survey was carried out in early 1997 at the re- To be sent back (%) 20 EL B A F D 10 I DK UK P NL FIN E L IRL S 0 0 10 20 30 40 50 Glad (%) ATTITUDES OF THE 15- TO 24-YEAR-OLD POPULATION TOWARD FOREIGNERS, 1997 Source: Eurobarometer. EUROPEAN REPORT ON THE QUALITY OF SCHOOL EDUCATION | 31
  • 33.
    quest of theEuropean Commission’s then Directorate- to make a more informed analysis of social and eco- General XXII — Education, Training and Youth. nomic problems, particularly in the light of human rights considerations, among others? The graph shows the respective percentages of young- sters, in each of the 15 European countries surveyed, Social diversity may both create problems and enrich claiming that they agreed with two assertions about social life. What should be done to promote social foreigners: ‘I’m glad that foreigners live in (our coun- and cultural diversity? try)’ and ‘All foreigners should be sent back to their In some countries, civics is taught as a specific subject, country of origin’. whilst in others, civic education is an integral part of The graph shows the percentages of students agreeing the curriculum. What are the advantages and the with each assertion in each country. These are the re- drawbacks of different approaches? sults of an opinion poll and should therefore be treat- Whether or not civics is a special subject, all teachers ed with some caution, although it is difficult to find should play a part in the civic education of their stu- out about people’s attitudes without asking them and dents. How can teachers be made more sensitive to surveys offer the best option in some cases. More in- the importance of their role in students’ develop- depth information and analysis on such an important ment as citizens? topic would, however, be desirable. On average, 15 % of young people surveyed claimed that they were happy with the presence of foreigners, EXAMPLES OF NATIONAL INITIATIVES but 9 % felt that all foreigners should be sent back to (For more information see Annex 1) their country. Greece and Cyprus — The ‘Parliament of adolescents’ Although there are no clear patterns or clusters appar- is an annual project in which elected Lyceum pupils ent from the graph a negative relationship can be seen meet in the House of Parliament and discuss matters between the numbers of respondents who said they of concern of the young generation as well as matters were ‘glad’ to have foreigners and the numbers of re- of current importance to their country, Europe and the spondents who thought foreigners should be ‘sent world. back’. Italy — In all secondary schools a statute of students’ The percentages of those who said they are glad of the rights and duties was introduced in order to enhance presence of foreigners range from 7 % (Greece) to democracy in schools and widen students’ opportuni- 45 % (Finland), and at the same time the percentages ties. arguing for foreigners to be sent back range from 1 % (Sweden) to 19 % (Greece). Poland — The KOSS programme has trained 2 000 teachers to teach civics to their students. It also cre- The indicator highlights attitudes which are part of the ates and publishes civics programmes. school curriculum in a lot of countries but at the same time reflects values that might be influenced by a country’s economic situation and trends in immigra- tion. According to J. Torney-Purta et al. (1999), social diversity and the way it is understood by policy-mak- ers and the public seems to have a great influence on schools, with implications for curriculum content and methodology. KEY POLICY ISSUES FOR DISCUSSION CONCERNING CIVICS In the many countries with economic or social diffi- culties, it is often tempting to blame foreigners for the problem. What can be done to help school students 32 | EUROPEAN REPORT ON THE QUALITY OF SCHOOL EDUCATION
  • 34.
    8. DROP-OUT RATES Europe has faced considerable challenges in recent decades. The development of our economies and the demands of an increasingly competitive society continue to leave some members of society by the wayside. Today’s learning or knowledge-based society is increasingly divided into those who have adequate skills and qualifications, and those who do not. In this rapidly changing environment, it is increasingly important for indi- viduals to be able to continue to update their knowledge and skills throughout their lives. Many believe that a minimum knowledge base is required in order for this to hap- pen, and that those who finish compulsory schooling without qualifications are conse- quently less likely to be able to participate effectively in life-long learning. Young peo- ple with a negative attitude to learning, and/or who leave school without qualifications are, therefore, likely to encounter significant problems later in life as a result. Rates (%) Rates (%) 50 50 40 40 30 30 20 20 10 10 (:) (:) (:) 0 0 Belgium United Kingdom Denmark Germany Greece Spain France Ireland Italy Luxembourg Netherlands Austria Portugal Finland Sweden Bulgaria Czech Rep. Estonia Cyprus Latvia Lithuania Hungary Poland Romania Slovenia Slovakia PERCENTAGE OF THE POPULATION OF 18 TO 24 YEAR OLDS HAVING ACHIEVED LOWER SECONDARY LEVEL OF EDUCATION (ISCED 2) OR LESS AND NOT ATTENDING EDUCATION OR TRAINING, 1997 (:) Data not available Source: Eurostat, Labour force survey. EUROPEAN REPORT ON THE QUALITY OF SCHOOL EDUCATION | 33
  • 35.
    Often, those whodrop out of formal education lack (30.2 %), Spain (30.0 %) and the United Kingdom the fundamental skills needed to find employment. (31.4 %) show alarmingly high drop-out rates, while They may have received no form of vocational training drop-out rates in Germany (13.2 %), Austria (11.5 %) and are therefore likely to have difficulty in finding a and the Scandinavian countries in particular (Sweden job. In addition, since pupils who drop out of school 9.6 % and Finland 8.5 %) fall significantly below the EU without basic skills are generally less able and less will- average. All of the central and eastern European coun- ing than others to embark on a strategy of life-long tries have drop-out rates below the EU average. The learning, the threat of unemployment may be an on- highest rate among these countries is Romania (19.8 %), going factor for these people in the longer term. Life- while the Czech Republic has the lowest rate at 6.8 %. long learning is becoming essential to the employabil- ity of the individual, and the number of jobs requiring The indicator does not show, however, whether drop no formal training is decreasing. This is particularly out in individual countries is the result of pupils not passing examinations at the end of lower secondary true of industrial countries with highly developed education or whether it is caused by a lack of oppor- service sectors. In addition, young people without a tunities for vocational training following lower sec- complete education may experience greater difficulty ondary education. Nor does it illustrate regional differ- than others with regard to social integration and ac- ences in drop-out rates within individual countries. tive participation in democratic society. Those who leave school prematurely may consequently be at risk The differences between countries are related to dif- of marginalisation and social exclusion. ferences between educational systems but also to socioeconomic disparities. The better scores of some The indicator presented here is based on the 1997 northern countries, for instance, are often attributed Labour force survey (Eurostat) and is an approximation to the organisation of their educational systems, in the (proxy) of the drop-out rates from different Member sense that the less selective mechanisms in education States (5). Drop-out is defined here as the share of the systems such as the integrated Nordic model could total population of 18 to 24 year olds having achieved help to ease the transition between different school the lower secondary level of education (ISCED level 2) environments when a pupil moves from primary to or less and not attending education or training. secondary level. Such systems, which cater for pupils As with other indicators, the data provided should be of all age groups, also allow adults to enrol and are treated with caution as they are not sufficiently differ- therefore providers, to some extent, of ‘life-long learn- entiated. In particular, they include pupils who did not ing’, allowing upper secondary education to be ac- gain qualifications at the end of lower secondary educa- cessed by a wide range of people. It is thus easier for tion as well as those who did, but who were unable to school drop-outs to return to education even after the obtain further qualifications or who did not wish to pur- normal completion age for school education. Such a sue further education or vocational training. An indica- system is likely to impact on aggregate drop-out rates. tor showing the percentages of pupils who did not ob- A further explanation for the comparatively low drop- tain qualifications at the end of compulsory schooling out rates in Austria and Germany is the so-called ‘dual would be preferable. The data required for this are not, system’, whereby pupils undertake an apprenticeship however, available. within an enterprise as well as part-time vocational training. Such a system can help to allow less-able The graph shows that drop-out rates in the EU remain pupils, in particular, to obtain a vocational qualifica- relatively high, with an average drop-out rate of 22.5 %. tion, due to the high practical element involved. There are, however, notable differences between Mem- ber States. The data suggest that northern Member On the other hand, high drop-out rates might be States perform better in combating the phenomenon linked to economic factors such as high unemploy- than do other Member States. Portugal (40.7 %), Italy ment rates, or disparities between urban and rural economies or between central and peripheral regions. (5) The Community Labour force survey (LFS) is a harmonised Research suggests, for instance, that young people at- sample survey of the inhabitants of the country at the time tending school in rural areas are often indispensable of the survey. Due to the particular socioeconomic and geo- to family businesses such as farming, and that they graphical situation of Luxembourg, the data on this indica- tor are not, therefore, comparable with those of the other may be inclined to drop out of school in times of eco- countries. nomic hardship. In such regions, the skills required for 34 | EUROPEAN REPORT ON THE QUALITY OF SCHOOL EDUCATION
  • 36.
    employment are oftenseen as being passed from gen- France — A ‘new chance’ for young people who leave eration to generation rather than from teacher to school without qualifications. This programme aims to: pupil. The link between formal education and success improve procedures for identifying the young people in the labour market is often less evident in such ru- concerned and increase the available information ral economies than it is in the service-oriented about the issue of drop out. economies. Germany — Here it has proved useful to find local in- dustry partners who can give potential drop-out pupils KEY POLICY ISSUES CONCERNING SCHOOL the chance to gain experience in practical working, in DROP-OUT parallel with their school-based learning. Efforts to reduce the number of drop outs must take The Netherlands — Early school-leaving in the Nether- into account the three different sub-groups which lands is challenged by a policy of cooperation between make up drop outs. These sub-groups are: schools at a regional level. • pupils who leave school before completing com- Poland — An educational psychology service has been pulsory schooling set up and many educationalists and psychologists have been recruited to identify the individual needs of • pupils who do not achieve any qualifications at pupils, to analyse the causes of failure and to find the end of compulsory schooling ways to remedy them. • pupils who do not receive professional training Spain — Among other initiatives one is for 16 to 21 after leaving school with or without qualifications. year olds who have not finished secondary education or have no professional qualification for the labour What kind of support can be offered to each of these market. groups in order to reduce the drop-out rates? United Kingdom — ‘New deal’ is a key part of the UK What is link between drop-out rates and policies re- Government’s ‘Welfare to work’ strategy. It gives job- garding children with special educational needs? Do seekers aged 18 to 24, 25+ and those with disabilities different countries’ arrangements for SEN provision a chance to develop their potential, gain skills and ex- affect their drop-out rates? perience and find work (http://www.newdeal.gov.uk). At its extraordinary meeting in Lisbon, in March 2000, the European Council set a target to halve by 2010 the number of 18 to 24 year olds with only lower second- ary level education who are not in further education and training. How can this reduction in drop-out rates be achieved? EXAMPLES OF NATIONAL INITIATIVES (For more information see Annex 1) Bulgaria — In 1997, a project named ‘School for everybody’ was launched. Its main goals were to build up expertise for coping with this complex problem. Europe — The ‘Second chance schools’ project offers education and training to young people who lack the skills and qualifications necessary to find a job or ben- efit fully from conventional training. For further infor- mation, see the web site (http://europa.eu.int/comm/education/2chance/ homeen.html). EUROPEAN REPORT ON THE QUALITY OF SCHOOL EDUCATION | 35
  • 37.
    9. COMPLETION OFUPPER SECONDARY EDUCATION Completion rates of upper secondary education are — like low drop-out rates — impor- tant indications of successful education systems. The completion of upper secondary education is considered as increasingly important, not just for successful entry into the labour market, but also in allowing students access to the learning and training oppor- tunities offered by higher education. In addition, the contribution made by school edu- cation in helping young people deal with the demands of modern society should not be underestimated. The internationalisation of trade, the global context of technology, and above all, the rapid development of information technology have made societies increasingly complex. Successful participation in the learning society requires the basic building blocks offered by a secondary education. Rates (%) Rates (%) 100 100 80 80 60 60 40 40 20 20 (:) (:) (:) 0 0 Belgium United Kingdom Denmark Germany Greece Spain France Ireland Italy Luxembourg Netherlands Austria Portugal Finland Sweden Bulgaria Czech Rep. Estonia Cyprus Latvia Lithuania Hungary Poland Romania Slovenia Slovakia PERCENTAGE OF YOUNG PEOPLE AGED 22 WHO HAVE SUCCESSFULLY COMPLETED AT LEAST UPPER SECONDARY EDUCATION, 1997 (:) Data not available Source: Eurostat, Labour force survey. 36 | EUROPEAN REPORT ON THE QUALITY OF SCHOOL EDUCATION
  • 38.
    The indicator showsthe percentage of young people In view of the complementary nature of this indicator aged 22 who have successfully completed upper sec- and the indicator covering drop-out rates, the commen- ondary education (ISCED 3). This level of education may tary on the interpretation of the data obtained through either be ‘terminal’ (i.e. preparing students for entry di- the ‘drop-out’ indicator also applies to this one. rectly into working life) or ‘preparatory’ (i.e. preparing students for tertiary education). The figures for each country indicate the percentage of young people aged KEY POLICY ISSUES CONCERNING COMPLETION OF 22 who have successfully completed at least upper sec- UPPER SECONDARY EDUCATION ondary education. Since some students will achieve this level in later years, the percentages reported for the in- The failure to complete the upper secondary level of dividual countries may yet rise in the older age groups. education successfully cannot be considered in isola- The data shown are based on the 1997 Labour force tion from the rest of a young person’s school career. survey (6). Nor can the impact of a country’s economic situation be ignored. Measures aimed at increasing success rates A number of factors should be remembered when con- should therefore take both of these factors into ac- sidering the information presented. The chart shows count. the percentage of 22 year olds who have successfully completed upper secondary education (ISCED 3). The • What efforts can be made to make upper second- remaining group — those who have not attained this ary education more attractive to all? level — consists of two categories: those covered by the ‘drop-out rates’ indicator, and those who are con- • What are the challenges, in terms of quality of up- tinuing to work towards an equivalent level of educa- per secondary education, of the increased emphasis on tion at the age of 22. The indicator does not show the life-long learning? How should upper secondary level relative proportions of these two groups. An indicator education adapt to such developments, and to the giving information on the number of pupils without changes taking place in subsequent educational final school-leaving qualifications at the end of ‘lower stages? secondary education’ (ISCED 2; see in addition the • What are the effects of the balance between gen- ‘drop-out rates’ indicator) and an indicator describing eral education and vocational training? Should oppor- the successful completion of ‘upper secondary educa- tunities for practical learning in the business and ad- tion’ (ISCED 3) at a later point in time (for example at ministrative sectors be expanded in order to increase the age of 25), would be more suitable. The data which young people’s motivation and give them a better un- would be required for this are not, however, readily derstanding of the connection between theoretical available. learning and practical activity? The average percentage of those who successfully com- pleted upper secondary education at the age of 22 years was 71.2 % in the European Union in 1997. However, EXAMPLES OF NATIONAL INITIATIVES there are considerable differences between the various (For more information see Annex 1) countries. On the one hand, there is a group of countries whose completion rates exceed 70 %, in some cases by a Ireland — The ‘Leaving certificate applied’ — This alter- significant amount; this category includes particularly native learning programme focuses on the needs and countries such as the Czech Republic, Poland and Slove- interests of students using a range of methodologies. nia, but also the northern European countries Finland It seeks to develop in students an enterprising outlook, and Sweden. On the other hand, there is a group of self-confidence and other skills related to success in countries whose completion rates fall below 70 %; this the workplace. category includes in particular southern European countries such as Spain, Italy and Portugal and also the Spain — The ‘Educación a distancia’ programme in- United Kingdom. tends to facilitate access to education to adults and also to non-adults who due to personal, social, geo- graphical or other exceptional circumstances cannot (6) See footnote 5 on data concerning Luxembourg. follow education at school with daily attendance. EUROPEAN REPORT ON THE QUALITY OF SCHOOL EDUCATION | 37
  • 39.
    10. PARTICIPATION INTERTIARY EDUCATION The opportunities offered by tertiary education are becoming more and more important. The demands of today’s labour market are markedly different from those of even 10 or so years ago, and are continuing to evolve rapidly. If young people are to succeed in this increasingly competitive and global environment then it is crucial that they acquire the skills and competencies which will enable them to compete effectively with others. (%) (%) 35 35 30 30 25 25 20 20 15 15 10 10 5 5 (:) (:) (:) (:) (:) (:) (:) (:) (:) 0 0 Iceland Norway United Kingdom Romania Poland Slovenia Belgium Denmark Germany Greece Spain France Ireland Italy Luxembourg Netherlands Austria Portugal Finland Sweden Bulgaria Czech Rep. Estonia Liechtenstein Cyprus Latvia Lithuania Hungary Slovakia Students as a percentage of the 18 to 24 age group Students as a percentage of the 25 to 29 age group PARTICIPATION RATES IN TERTIARY EDUCATION, AS A PERCENTAGE OF TOTAL POPULATION, BY AGE GROUP — ISCED 5, 6 AND 7, 1996/97 (:) Data not available Source: Eurostat, UOE. 38 | EUROPEAN REPORT ON THE QUALITY OF SCHOOL EDUCATION
  • 40.
    In recent years,higher education institutions have re- most all cases, they are actually higher among women sponded more and more to the changing demands of than among men. the labour market, endeavouring to equip their students with the specific skills they need to succeed. Many As for other indicator areas, caution should be applied in courses have moved away from a purely academic focus drawing conclusions from the limited data available. The towards a more vocational one, and the links between very different tertiary education systems in the coun- higher education and industry have consequently be- tries from which data was collected, and the different come clearer. For this reason, tertiary education is, more characteristics of the countries themselves, make it es- than ever before, seen as the means to taking part in the pecially difficult to draw meaningful conclusions from high-value-added international industries. this data. Nevertheless, some reasons for the varying participation rates in tertiary education between coun- It is not necessarily desirable, however, to have ever tries and between men and women can be suggested. increasing levels of participation, if these are not matched to national and international needs. Of key • In some countries, training for certain occupations importance is the need to match the supply of gradu- takes place as part of upper secondary education or a ates to current demand, and to predict trends in de- further (post-secondary non-tertiary) level, whereas, in mand in the light of the development of future new other countries, training for these occupations takes technologies, employment trends etc. place at the level of tertiary education. The data presented in the graph show the proportion • In certain countries the lack of opportunities for of students in certain age groups participating in ter- undertaking vocational training pushes young people tiary education (ISCED 5, 6 and 7), as a percentage of towards tertiary education. This may be the case par- the total population of that age group. The graph ticularly for young women, as the opportunities open presents this information for two age groups: those to them outside tertiary education may be less attrac- aged up to 24, and those aged from 25 to 29 (7). tive than those open to young men. It is clear from the data that the participation rates in Participation rates may also be linked to the prevailing tertiary education vary greatly between countries. In conditions of the labour market. A weak labour market the younger age group, participation ranges from 11 % could lead to an increase in the number of students in Romania to 32 % in Belgium; in the older age group enrolling on higher education courses as those having participation varies from 3 % in Estonia to 16 % in difficulty in finding a job, or who have lost their jobs, Greece. In all countries the participation rate in the may decide to enrol instead in higher education. It younger age group is higher than in the older one. should be remembered, however, that enrolment rates and graduation rates cannot necessarily be equated. However, there are countries in which the two rates Equally, the effect of numbers enrolling in higher edu- resemble each other far more closely than in other cation may in turn impact on the labour market in a countries. In Germany in particular there is scarcely number of ways. High participation rates will ulti- any difference between the two rates (14 % and 13 % mately lead to a well-qualified workforce, making it respectively). Countries such as Germany, where the more difficult for those without a higher education duration of courses is relatively long and the age at qualification to find work in particular sectors. High which students begin tertiary education is more varied, participation rates spread across a wide age range will will not have such high participation rates for a given also have a significant impact on the proportion of the age group as countries where courses are shorter and population which is unavailable for work at any time. the age of students is more uniform. The diagram does not differentiate between participa- KEY POLICY ISSUES CONCERNING PARTICIPATION IN tion of men and women. Generally, however, it is the TERTIARY EDUCATION case that participation rates of men and women are fairly similar in the majority of countries although, in al- As a result of the very varied systems in place within the tertiary level of education, discussion of issues sur- rounding the data is of a fairly speculative nature. In (7) Due to the particular socioeconomic and geographical situ- summary, although the data collected using this indi- ation of Luxembourg, the data on this indicator are not comparable with those of the other countries. Most stu- cator provide only limited information about trends in dents study outside the country. participation in higher education, the findings raise a EUROPEAN REPORT ON THE QUALITY OF SCHOOL EDUCATION | 39
  • 41.
    number of policyissues which could be explored in more depth, in particular as follows. • The relative proportions of men and women par- ticipating in higher education. Why is the relative number of women increasing? What is the male/fe- male balance in certain subject areas (for example the sciences and the humanities)? What is the effect of in- creased participation in terms of unemployment rates among women? • The link between higher education and the labour market. To what extent is the choice of higher educa- tion a direct response to the labour market? Is a coun- try’s production of graduates well matched to its over- all needs (in terms of the labour market etc.)? Are there too many or too few graduates in particular countries? What is the effect on the labour market of the trends in participation? • The effects of high/low participation rates. What is the relationship between participation rates among older age groups and the productivity of the labour market? Can the benefits of higher education be measured in other ways, such as increased maturity, social awareness etc.? • The connection between secondary and tertiary education. What are the possibilities in secondary edu- cation for increasing the number of those — particu- larly young women — aiming to take up take up math- ematical, scientific or engineering studies? EXAMPLES OF NATIONAL INITIATIVES (For more information see Annex 1) Ireland — Universities and other tertiary institutions now have programmes which are aimed at redressing the current imbalance in the representation of the social classes in the universities and other tertiary institutions. Scotland — The ‘University of the Highlands and Is- lands’ is making extensive use of remote access teach- ing technology to link a number of centres with students across the remote rural region of northern Scotland. 40 | EUROPEAN REPORT ON THE QUALITY OF SCHOOL EDUCATION
  • 42.
    11. EVALUATION ANDSTEERING OF SCHOOL EDUCATION All educational systems require evaluation and steering. At national, local and school level evaluation serves a number of essential purposes. It measures whether the educa- tion system lives up to the objectives set. It offers diagnostic and formative information for system managers, headteachers, teachers and a wider public. It opens up dialogue and provides the basis for development planning and school improvement. Benchmarks allow schools to measure themselves against other comparable institutions. They can be used by inspectors or other external agents to compare the outcomes of individual schools. They help focus on processes intended to achieve those outcomes Evaluation may be either internal (self) or external, or a combination of the two. Both forms of evaluation carry resource and training implications. With this in mind, most European countries are seeking the best and most productive combination of the two forms of evaluation. Ideally, external and self-evaluation complement each other as vital sources of information. Publication of the overall results LI of external certificated examinations Publication of the overall results CY of external tests No publication of overall results MONITORING EDUCATION SYSTEMS AT PRIMARY AND/OR SECONDARY LEVEL — PUBLICATION OF THE OVERALL RESULTS OF EXTERNAL TESTS, 1997/98 Source: Eurydice. EUROPEAN REPORT ON THE QUALITY OF SCHOOL EDUCATION | 41
  • 43.
    As the movementfor more rigorous evaluation gathers perspectives and raise questions about whether it is momentum, more data will be forthcoming in the next preferable to account for the performance of the sys- few years. Currently we have information on the pub- tem as a whole; whether to present comparative data lication of examination and test results. These are at school level; or whether to make public data which sometimes used for diagnostic, or developmental, pur- may have been designed to serve a diagnostic purpose. poses, sometimes for accountability and reporting to parents and public. All European countries are seeking the best way in which to report school performance and to reconcile The country map shows how practice between Member diagnostic/developmental purposes with accountabili- States varies with respect to the publication of results ty objectives. This is an area where policy is changing of external tests. rapidly and in which there will be different configura- tions and more complex variations in the future as The map shows a majority of countries, mainly pre- schools and teachers become more confident in self- accession countries, where there is no publication of evaluation and external monitoring systems adapt external test results. In 10 countries, including all the their function and purpose to complement schools’ Scandinavian countries, there is publication of overall own internal evaluations. examination results. In four countries more detailed publication of attainment testing is published. How- A relatively short-term goal for the presentation of in- ever, policies and practices in these four countries dicators in the future could be to illustrate different vary considerably. patterns of internal and external evaluations for schools across Member States. Much of this informa- The UK (except Scotland), Spain, France and Belgium tion is already available through the Standing Interna- (French) are all represented by the same colour yet are tional Conference of Inspectors (SICI) but some work is very different not only in what they do but in their needed before it can be presented in the form of an policy purpose. In England, for example, results at key informative indicator profile. stages (ages 7, 9, 12, 14, 16 and 18) are published pri- marily for accountability purposes and to raise stan- A longer-term goal could be to provide data which dards through encouraging parental information and show the development of self-evaluation in Europe choice. In France, by contrast, tests are administered and its relationship to external evaluation. Such data yearly for diagnostic purposes and examination results will illustrate the nature of the balance between inter- are published as benchmarks for schools to compare nal and external evaluation and the role that each of their own performance and thereby raise standards. these plays in the steering and evaluation of school Legislation prevents parental choice of school in the systems. State sector. In Spain, individual schools make their data available but publication of results is intended to As for other indicators, the data above provide a start- provide information on standards overall and is based ing point for a closer look at policy rationale, effec- on a sample of schools. Scotland, in common with its tiveness and viability. other UK partners, publishes results of external exami- nations at 16 to 18. Attainment test scores within the national 5 to 14 programme are used both diagnosti- KEY POLICY ISSUES CONCERNING EVALUATION AND cally and for targets relevant to national standards. STEERING OF SCHOOL EDUCATION In a number of countries, for example Lithuania, Bul- Reporting of data is not a stand-alone exercise. It is garia and Portugal, piloting of new approaches is tak- related to systems of monitoring, inspection and self- ing place and policies are changing as a consequence. evaluation, implicitly or explicitly conveying messages The impact at school and classroom level cannot be about purpose, policy and priority. What are the key illustrated by a map but it is the attitudes and compe- messages which should be conveyed through the tencies of individual teachers which will put the effi- publication of school performance data? cacy of the policy to the test. Monitoring schools’ performance is critical to raising The publication of examination performance reflects a standards for all pupils but it is both expensive and belief in the importance of accountability to a wider difficult to raise standards from the outside. What public. However, the data highlight different policy powers and roles should be given to schools in the 42 | EUROPEAN REPORT ON THE QUALITY OF SCHOOL EDUCATION
  • 44.
    reporting of theirown performance and how can Scotland — In 1996, ‘How good is our school?’ was that be achieved? published. It is a toolkit for schools to use in self-eval- uation, based on a set of 33 performance indicators. As schools’ expertise in self-evaluation increases and For more information, see the web site their access to appropriate tools and strategies grows, (http://www/scotland.gov.uk/structure/hmi/default.htm). the role of inspection changes. What role is there — if any — for external monitoring systems in these cir- Spain — INCE (Instituto Nacional de Calidad y Evalu- cumstances? ación) was created to design evaluation systems for the different types of education governed by the The trend to publish performance data is likely to grow LOGSE (new law for education). rather than diminish and data will continue to serve different purposes, such as: accountability, bench- marking or informing parental choice. At what level (individual school, school clusters, regional, national) should reporting be focused in order to fulfil its purposes most effectively and economically? EXAMPLES OF NATIONAL INITIATIVES (For more information see Annex 1) Europe — Pilot project ‘Evaluating quality in school education’, see the web site (http://europa.eu.int/comm/education/poledu/ finalrep/rep.pdf). Austria — Rich resource site on the Internet has been established, for schools, allowing them to access infor- mation, ideas, procedural proposals, instruments and other support for schools’ programme development and self-evaluation (http://www.qis.at). Denmark — The Danish Evaluation Institute is a single organisation for the evaluation of all levels of educa- tion. Hungary — A new pilot project the ‘Quality develop- ment programme’ will be launched, involving more then 400 public institutions. It will focus on operation and management. The Netherlands — About 0.5 % of the budget for pri- mary and secondary education is spent on external evaluation activities. Schools also have their own sys- tems for internal evaluation of the quality of educa- tion. Portugal — PEPT (Education for every student), a programme designed to foster students’ completion of compulsory education, involves a self-evaluation plan which includes an observatory with 15 indica- tors relating to context, process, resources and out- comes. EUROPEAN REPORT ON THE QUALITY OF SCHOOL EDUCATION | 43
  • 45.
    12. PARENT PARTICIPATION POWERS OF SCHOOL-LEVEL BODIES WHICH INVOLVE PARENT REPRESENTATIVES, IN THE PREPARATION OF THE SCHOOL DEVELOPMENT PLAN — COMPULSORY EDUCATION, 1997/98 Source: Eurydice. 44 | EUROPEAN REPORT ON THE QUALITY OF SCHOOL EDUCATION
  • 46.
    Parental participation may,for example, take place of schools (for example, school governors with business through: experience and connections) the majority of parents will not be motivated to become involved at that • statutory advisory and decision-making bodies macro level of school policy/practice. The large majori- (e.g., school boards) ty will wish to be involved where issues are of direct • evaluation of their schools relevance to their own children’s welfare and progress. There are many good practices which involve a wider • voluntary associations (e.g., parent associations) group of parents at school and classroom level and • voluntary involvement in after-school activities which illustrate how parents can make a significant and clubs contribution to quality and standards. This indicator provides a good starting point for further research and • voluntary involvement in classroom activities (e.g., raises important policy questions about the role and paired reading) influence of parents. There are further implications for the role of all stakeholders and how they work togeth- • communications with the school and support of er for school quality and improvement. European their children’s learning and progress. unions of parents, teachers, school students and head- There are a number of areas in which parents may par- teachers have already, through joint conferences, laid ticipate. the groundwork for fuller and richer collaboration. The map shows one significant aspect of parental in- volvement, namely in the preparation of the school KEY POLICY ISSUES CONCERNING PARENT development plan: PARTICIPATION The data reveal that in five countries parents have de- School development planning should not simply be a cision-making powers in relation to the preparation of mechanistic operation nor one which is confined to the school development plan. This is generally through school leaders or teachers. It benefits from the in- a representative body such as a council or board. It is volvement of parents and a wider constituency of more common (18 countries) for parents to have a stakeholders. What particular insights and added- consultative or advisory function. In some countries, value do parents bring to the process of school for example the Netherlands, the council ratifies the development planning? plan developed by the authority. In four countries, parents have no powers in respect of development Parental involvement is often regarded as ‘a good thing’ but it needs to be examined in the light of its planning although in each of these four countries they relevance for different purposes and contexts. In what do have powers in other areas such as school rules, areas of consultation and decision-making are par- control or allocation of expenditure. ent powers most relevant and useful? In what re- Finland represents an exception because the powers of spects might policy-makers wish to limit parental councils vary so much between municipalities and the powers as well as to increase them? most recent legislation (1 January 1999) does not contain Extending parent participation raises questions about provisions for parental consultation in its school system. other forms of stakeholder involvement. For example, These data do not tell us about the strength and com- what steps can be taken to give greater responsibil- position of the parent constituency at school level, its ity to school students and exploit the considerable contribution or impact. Further research would be resource and expertise they offer for improving needed in order to identify the most effective forms of schools? membership and the most helpful ways in which par- ents consult and speak on behalf of their constituen- cies. Consultative bodies by their nature involve a EXAMPLES OF NATIONAL INITIATIVES minority of parents — those who volunteer and those (For more information see Annex 1) most likely to have the confidence, expertise or interest in playing a role at whole school level. While parents Europe — EPA’s ‘Training programme for parents’ is an are a valuable resource and potentially powerful allies example of how to improve quality through coopera- EUROPEAN REPORT ON THE QUALITY OF SCHOOL EDUCATION | 45
  • 47.
    tion and constructivedialogue between parents and teachers at school level. Germany — Seminars for parents aim to: inform them of new developments in learning and teaching; estab- lish consensus on areas of school; and to motivate them to participate in wider policy as aspects of school. 46 | EUROPEAN REPORT ON THE QUALITY OF SCHOOL EDUCATION
  • 48.
    13. EDUCATION ANDTRAINING OF TEACHERS Years Years 8 8 7 7 6 6 5 5 4 4 3 3 2 2 1 1 0 0 Czech. Rep. Bulgaria Liechtenstein Slovenia Lithuania Scotland Slovakia Belgium England Estonia Iceland Hungary Romania Cyprus Latvia Norway Poland Denmark Germany Greece Spain France Ireland Italy Luxembourg Netherlands Austria Portugal Finland Sweden United Kingdom DURATION OF INITIAL EDUCATION AND TRAINING OF TEACHERS FOR LOWER GENERAL SECONDARY SCHOOLS, 1999/2000 (:) Data not available Source: Eurydice. EUROPEAN REPORT ON THE QUALITY OF SCHOOL EDUCATION | 47
  • 49.
    The data shownhere are for initial teacher education Lithuania, Poland, Romania and Slovenia to the equiv- in lower general secondary schools only. Data exist for alent of almost four years in Germany. primary and upper secondary schools too (Eurydice key In addition, the time spent on pedagogic/practical train- data, 2000). The graph illustrates similarities and dif- ing in relation to the total duration of the training dif- ferences among countries in: fers widely. In Finland and the Netherlands, for example, • the length of initial training courses the equivalent of one year is spent on pedagogic and practical training. However, as a proportion of the total • the balance in training between general education length of training this represents approximately one and pedagogic practical training. sixth and one quarter of the total duration of the courses in these countries, respectively. By contrast, the For the purposes of this indicator, two key distinctions proportion of time spent on pedagogical/practical train- have been made: ing in Germany is closer to two thirds. • general or subject-based education and training: The data reveal very different patterns of provision but knowledge related to what the trainee will be required also conceal underlying complexities. They tell us to teach, as well as general education which is direct- nothing about the balance, nature or relevance of ly linked to teaching studies nor about their effectiveness in developing the core competencies required by teachers. As countries • pedagogic and practical training: practical place- develop criteria for teacher competencies, they must ments in schools, plus a range of other courses which look again at course provision and consider its rele- are related to the teaching profession (for example, vance to teachers’ needs. Nor do the data show theoretical courses on didactics, adolescent psycholo- whether practical training is higher-education-based gy, methodology, history of education, use of ICT). or school-based, a factor which has major resource In some cases it has been hard to separate the two implications. categories, for example where general and pedagogic The data relate only to lower secondary education. In training are taught together. In these cases 50 % of some, but not all countries, there will be different time has been attributed to each in the graph. arrangements for primary and upper secondary teacher training. The graph provides information on two aspects of ini- tial teacher training: firstly, the length and, secondly, the amount of time spent on pedagogic and practical KEY POLICY ISSUES CONCERNING TEACHER training. It should be noted that, for Germany and EDUCATION Austria (8), only training for teachers in Gymnasium or AHS (allgemeine höhere Schule) respectively is includ- The balance of time given to teaching of subject ed (two routes are possible, depending on the type of knowledge and pedagogy is a matter of concern to all secondary education). countries. What steps must be taken to ensure that teacher training institutions achieve the optimum With regard to the first aspect, the data show that the balance in their teaching, taking into account cost- most common length of course is five years (eight effectiveness? countries) or four years (14 countries). In Germany, Luxembourg and Italy, initial courses are longer than The continuing professional development of teachers average, while in Belgium and Liechtenstein they are will be an increasing priority in the immediate and long-term future. What provision should now be shorter. made to ensure that teachers update their knowl- The graph also shows the amount of time spent on edge and practice? pedagogic and practical training. This varies greatly, Teacher recruitment and retention is more of a prob- from the equivalent of less than a year in Ireland, lem in some countries than others but the situation is liable to change as social and economic conditions (8) In Austria, teacher training for the Hauptschule, which rep- change. What can be learned from countries with a resents around 70 % of teachers, is a three-year non-uni- versity education where theoretical and practical elements surplus of teachers, and from others with a shortage, are integrated and cannot be displayed separately. in order to plan for the future? 48 | EUROPEAN REPORT ON THE QUALITY OF SCHOOL EDUCATION
  • 50.
    As teacher retentionbecomes a more pressing priority, issues of separate pay and promotion arrangements for particularly effective or ‘expert’ teachers will be- come a more pressing policy issue. What can be done to reward and retain particularly effective teachers? EXAMPLES OF NATIONAL INITIATIVES (For more information see Annex 1) Hungary — The in-service teacher training system — The Act on Public Education has declared that each teacher should participate in at least 120 contact- hours of in-service teacher training during seven years of practice. Portugal — ‘Sailing through the Portuguese language’ is the name given to an initiative of the Department of Secondary Education of the Portuguese Ministry of Education, designed to provide teaching training using Internet facilities. EUROPEAN REPORT ON THE QUALITY OF SCHOOL EDUCATION | 49
  • 51.
    14. PARTICIPATION INPRE-PRIMARY EDUCATION Pre-primary education is significant in many different respects. Firstly, it makes an im- portant contribution to the emotional and cognitive development of children and to their social integration, thereby helping to prepare them for the school environment and reducing the likelihood of failure at school later on. Secondly, it plays an important part in supporting families. The changing role of the family as a social institution often means that parents are no longer at home full time and that, as a result, they are un- able to provide an adequate educational and social environment for their children. Pre-primary education is defined as the initial stage of Even if the significance of pre-primary education is structured teaching. It is usually centre- or school- acknowledged across Europe, opinions as to its educa- based, designed to meet the educational and develop- tional function differ. Some believe that children mental needs of children of at least three years of age, should play as long as possible, while others argue that and provided by adequately trained staff. pre-school education is essential in order to facilitate Number of years Number of years 4 4 3 3 2 2 1 1 (:) (:) (:) 0 0 Belgium United Kingdom Denmark Germany Greece Spain France Ireland Italy Luxembourg Netherlands Austria Portugal Finland Sweden Bulgaria Czech Rep. Estonia Cyprus Latvia Lithuania Hungary Poland Romania Slovenia Slovakia ISCED 0 ISCED 1 AVERAGE DURATION OF ATTENDANCE BY CHILDREN AGED THREE TO SIX AT AN EDUCATION-ORIENTED INSTITUTION, 1996/97 (:) Data not available Source: Eurostat, UOE. 50 | EUROPEAN REPORT ON THE QUALITY OF SCHOOL EDUCATION
  • 52.
    a child’s transitionto primary school. Regardless of KEY POLICY ISSUES CONCERNING PARTICIPATION IN these different approaches of individual countries, it is PRE-PRIMARY EDUCATION the case that participation rates have been increasing markedly during the last 30 to 40 years in almost all As participation in pre-primary education increases European countries. across Europe, it is increasingly important to ensure that the links between pre-primary and primary insti- The indicator provides information about the average tutions are strengthened. It is widely acknowledged attendance of children aged three to six years at pre- that early measures can play a significant part in re- primary (ISCED 0) and primary (ISCED 1) education- ducing school ‘failure’ in later years. What measures oriented institutions during 1996/97. The data used are can be taken in order to facilitate successful learn- based on information compiled by Eurostat using the ing at primary level and beyond, and to ensure that results of the UOE data collection and population statis- the transition from playful learning in the pre- tics. They take into account the fact that compulsory primary setting to more formal learning within the primary education begins earlier in some countries than school setting is successful? in others. The graph does not, however, provide infor- mation about whether attendance at the institution is EXAMPLES OF NATIONAL INITIATIVES full time (all day) or part-time (half a day). (For more information see Annex 1) The diagram shows that a considerable number of countries are able to offer children a place for three Italy — In Italy, three initiatives concerning quality in full years of pre-primary education. Belgium, Denmark, infant education have been promoted by the Ministry France, Italy, Hungary and Sweden are among these of Education and by the National Institute for the countries. In many countries (including Austria, Ger- Evaluation of Education Systems. many and the Netherlands), pre-primary places for Luxembourg — All children aged between four and six children aged over three are only available for two to years are obliged to attend institutions of pre-primary three years. In other countries (such as Finland, Greece education. In addition, a third of three-year-olds cur- and Portugal), however, a child would, on average, rently attend these institutions. spend less than two years in the pre-primary sector. In Netherlands — In the Netherlands, two experimental evaluating the differences between countries, it must programmes have been implemented for early child- be taken into account that in some, primary education hood education with a view to stimulating the cogni- begins at a comparatively very early age, meaning that tive, social–emotional and linguistic development of that fewer pre-primary places are required. This applies disadvantaged children aged between three and six particularly to the United Kingdom. years. The information presented in the chart does not show whether pre-primary provision in each country corre- sponds to parental demand. Theoretically it is conceiv- able that in countries with comparatively low partici- pation, supply meets demand more closely than in some of the countries with high participation. The data illustrated in the chart show that the major- ity of the countries attach high importance to pre- primary education. Even if attendance at institutions is generally voluntary among this age group, there is an emerging trend for childcare to be provided for almost all children of three years and older. This indicator does not provide information about the educational content of the programmes offered by institutions in the various countries. EUROPEAN REPORT ON THE QUALITY OF SCHOOL EDUCATION | 51
  • 53.
    15. NUMBER OFSTUDENTS PER COMPUTER The information society will not only open up new channels of communication amongst people, but it is likely to have a considerable impact on the way we live, work, consume, interact with government as well as express and entertain ourselves. If every European citizen is to be able to use computers effectively, schools must offer all students the opportunity of learning to use them. Moreover, if the potential of the Internet and educational software is to be fully exploited by teachers and students, a sufficient number of effective and sufficiently up-to-date computers must be available. It should not be forgotten, however, that infrastructure in itself does not guarantee the development of high-level competencies by students. Schools’ organisation, the man- agement of technology, the use of high-quality software, and above all teachers’ com- petencies are all important factors (see also the indicator about ICT). Number of students Number of students per computer 880 per computer 339 238 216 150 150 120 120 90 90 60 60 30 30 (:) (:) (:) (:) (:) (:) (:) (:) (:) (:) (:) (:) (:) (:) (:) (:) (:) (:) (:) (:) 0 0 French Com. Flemish Com. Scotland England Denmark Germany Greece Spain France Ireland Italy Luxembourg Netherlands Austria Portugal Finland Sweden Bulgaria Czech Rep. Estonia Cyprus Latvia Lithuania Hungary Poland Romania Slovenia Slovakia Japan USA United Kingdom Belgium 1995 TIMSS 1998 SITES NUMBER OF STUDENTS PER COMPUTER — LOWER SECONDARY SCHOOL, 1995 AND 1998 (:) Data not available Source: IEA, TIMSS (OECD–OCTO) & SITES. 52 | EUROPEAN REPORT ON THE QUALITY OF SCHOOL EDUCATION
  • 54.
    The number ofstudents per computer in the schools United States also have a high number of computers: where eighth grade students are enrolled was measured Japan (27; 14) and United States (16; –). both in 1995 (IEA–TIMSS) and in 1998 (IEA–SITES). According to SITES, central and eastern European The above graph shows the number of computers at a countries (Bulgaria, Lithuania, the Czech Republic, particular time (in a domain in which changes are tak- Slovenia and Hungary) are less well-equipped than ing place very rapidly). The information about the most others. However, Cyprus also ranks very low, but number of computers was derived in different ways in the situation seems to be changing very fast in those different surveys. In TIMSS, the issue addressed was areas: between 1995 and 1998, the decrease in num- the number of computers ‘available for use by teach- ber of students per computer ranged from 23 % ers or students’ in the school, whereas in SITES it was (Lithuania) to 70 % (Slovenia). the number of computers ‘available for use by stu- It is important to emphasise that the indicator repre- dents in the entire school’. The ratios may be seen as sents an average, concealing very different situations fairly close and comparable, although not strictly iden- in individual schools: a fairly similar level of equip- tical. OECD (1998) underlines that, in TIMSS, the indi- ment in all schools, or possibly very well-equipped cator may apply to a slightly different population. In schools alongside schools without any access to new addition, it should be noted that some countries did technologies. not satisfy the IEA sampling requirements. The data clearly show a trend towards an improvement The statistics illustrated do not provide information of ICT resources in lower secondary schools. The resourc- about the adequacy of computers in relation to cur- ing of schools appears to depend on the wealth of the rent requirements — for example connection to Inter- country, but the relation is not a simple one: major net, or ability to run powerful software — nor about progress made by several countries between 1995 and their actual use. Moreover, the indicator could vary ac- 1998 shows that solutions to a lack of resources can be cording to the level of the education system: the ratio found, in some cases, through partnership. of students to computers is considerably more favourable at upper secondary level than at lower sec- ondary education (nine countries provided information about both levels). KEY POLICY ISSUES FOR DISCUSSION CONCERNING THE NUMBER OF STUDENTS PER COMPUTER The graph shows that the range of countries’ scores is very large in both studies: from nine (Scotland) to 880 Faced with the necessity of providing expensive equip- (Romania) in TIMSS, and from 9 (Denmark) to 238 ment to a large number of schools, some educational (Bulgaria) in SITES. systems turn to a partnership approach, in which the partner organisation must benefit in some way from In every country which took part in both surveys, the its contribution but must respect national rules re- availability of computers in schools rose between 1995 garding school education. (It may not, for example, in- and 1998. In those European or pre-accession coun- terfere with the curriculum.) Exchange of experiences tries which took part in both surveys, the number of in this area could eventually help countries less well- students per computer decreased from 90 to 55 on av- equipped to find a means of improving their resources. erage, that is 39 % in less than four years. It may be How would it be possible to create partnership with assumed that a similar decrease also took place in the institutions or organisations which could help to in- other countries. crease the availability of computers in schools? How can schools be guaranteed a real long-term benefit Eight of the participating countries, among which from such an approach? three are northern, had fewer than 20 students per computer in at least one survey. The number of stu- As technology changes rapidly, it is wise to bear in dents per computer is shown in brackets, according to mind from the outset the need to upgrade computers, TIMSS; then SITES; ‘–’ means that the country did not replace outdated models, or repair faulty machines. It take part in the survey): United Kingdom (11 for Eng- may be preferable to provide the schools with a small- land and 9 for Scotland; –), Denmark (17; 9), Austria er number of computers in the first instance, in order (19; –), Sweden (19; –), Finland (–; 10), Luxembourg (–; to ensure that the hardware remains usable and at a 12), Italy (–; 16) and France (29;17). Japan and the suitable level of performance over time. How can EUROPEAN REPORT ON THE QUALITY OF SCHOOL EDUCATION | 53
  • 55.
    schools ensure thattheir equipment remains appro- priate while costs are kept at a manageable level? Hardware alone cannot guarantee efficient use of ICT in schools; teachers must be able to use ICT effective- ly themselves. How should teacher training in this field be organised? The importance of computer skills in today’s society is widely recognised. How should the use of computers in primary and secondary schools be organised in order to ensure that pupils acquire these skills? EXAMPLES OF NATIONAL INITIATIVES (For more information see Annex 1) Belgium (French) — 1998 partnership offering all pri- mary and secondary school a ‘cyber centre’: computers and facilities to connect to Internet. Estonia — The ‘Tiger leap’ programme is a national tar- get programme with the overall objective of improving the educational system in Estonia through the intro- duction of modern information and communication technologies (http://www.tiigrihype.ee/english). Italy — 1999, companies and banks provided schools with their old (but perfectly working) computers. Portugal — New regulations on school administration and management, issued in 1998, created clusters of schools (agrupamentos) which allow for the sharing of human as well as material resources. 54 | EUROPEAN REPORT ON THE QUALITY OF SCHOOL EDUCATION
  • 56.
    16. EDUCATIONAL EXPENDITUREPER STUDENT The share of total financial resources devoted to education is a key decision for nation- al governments. It is an investment with long-term returns, and most governments con- sider it to be something which impacts on several key political challenges such as social cohesion, international competition, and sustainable growth. The chart summarises educational expenditure per stu- meals, transport and other welfare services, but do not dent, differentiated according to level of education, generally include expenditure on student fees. Expen- namely primary (ISCED 1), lower and upper secondary diture for research is not included if it is carried out by (ISCED 2, 3 and 4) and tertiary education (ISCED 5 and separate research institutions with a purely adminis- 6). The information is based on the UOE finance data trative link to universities. provided by countries for the financial year 1997; in- formation is presented for EU countries only, as data A straightforward comparison of expenditure per pupil for the remaining countries were unavailable. is problematic on the basis of these figures. It would not, for example, take into account national variations The data cover only expenditure on public institutions. in the costs of educational resources of comparable They include expenditure for ancillary services such as quality. A teacher in one country could incur greater PPS index PPS index 12 000 12 000 10 000 10 000 8 000 8 000 6 000 6 000 4 000 4 000 2 000 2 000 (:) (:) 0 0 Japan USA United Kingdom Belgium Denmark Germany Greece Spain France Ireland Italy Luxembourg Netherlands Austria Portugal Finland Sweden Primary education Secondary education Tertiary education EXPENDITURE PER PUPIL/STUDENT (PPS) IN PUBLIC INSTITUTIONS BY LEVEL OF EDUCATION, 1997 (:) Data not available Source: Eurostat, UOE. EUROPEAN REPORT ON THE QUALITY OF SCHOOL EDUCATION | 55
  • 57.
    expenditure than ateacher in another country as a re- A number of observations, beyond those already dis- sult of higher salary costs. However, the work of a cussed, can be made on the basis of the data shown. teacher in the first country is not necessarily of better Even taking into account the differences in prosperity quality than that of a teacher in the second country. between countries, the priority given to education The reason for differences in expenditure can be at- seems to vary considerably. Wealthier countries seem tributed largely to differences in salary levels. Howev- to be able to ‘afford’ to make education a priority. It is er, factors such as the number of students enrolled and clear that different countries pursue different strate- the different duration of studies also have a decisive gies regarding expenditure on education. In the major- influence in the amount of educational expenditure ity of countries, expenditure per student increases in per student. line with the age of students. The variation in funding levels between the different levels of education within The graph shows clearly that expenditure per head dif- individual countries is quite marked. In Denmark, for fers greatly between individual countries. Greece, for example, expenditure on each of the three stages is example, has rather low levels of expenditure, while quite similar, whereas there are clear differences in the countries such as Austria have above average expendi- funding allocated to the three stages in the Nether- ture. The extent of the differences between the coun- lands, where the difference between secondary and tries can be demonstrated clearly by taking the exam- tertiary level is explained by the inclusion of research ple of secondary education. Greece spends 2 150 PPS expenditure. (purchasing power standards expressed in ecus) on each pupil, whereas Luxembourg spends 10 009 PPS. Between these two extremes lies a group of countries KEY POLICY ISSUES CONCERNING EDUCATION with relatively low levels of expenditure, including EXPENDITURE countries such as Ireland (3 637 PPS) and the United Kingdom (3 808 PPS), as well as a group of countries This comparative overview of expenditure on educa- with comparatively high levels of expenditure on sec- tion, combined with a knowledge of the situation of ondary education, such as Austria (7 676 PPS), Den- the economies of the different countries, gives rise to mark (6 699 PPS) and France (6 501 PPS). With respect the following questions regarding the financing of to the comparatively very low level of expenditure in education: Germany (4 196 PPS) it must be taken into account • How, and according to which criteria, should that training within the dual system of the upper sec- priorities be set — particularly with respect to the ondary level is financed to a considerable extent by different levels of education? business, and the expenditure is not, therefore, includ- ed here. Under the dual system, approximately one • How can we make sure that expenditure on third of students’ training takes place in schools which education is an investment? are financed by the State, and two thirds in companies • What is the role of the private sector in funding which are not normally publicly funded. education, especially in the context of life-long The differences between countries can be explained in learning? Is the contribution of private sector fund- part by their differing levels of prosperity. Neverthe- ing an opportunity or a danger, particularly for the less, it is interesting that in those countries which had less wealthy countries? very high levels of expenditure per pupil, expenditure • What is the implication of the expansion of life- also represents a relatively large proportion of the long learning on education expenditure? Who will gross domestic product per head of the population. In meet the costs of this expansion: the State, the in- Denmark and Austria, expenditure per pupil on educa- dividual participant, the private sector? tion comprised 28 % and 33 % respectively of the gross domestic product per head of the population in • Is the balance of expenditure between the dif- 1995, taking into account the higher prosperity of ferent educational levels right? What are the priori- these countries, whereas it represented 16 % in ties in terms of funding? What are the consequences Greece, 19 % in Ireland and 24 % in the United King- of increasing funding at local/regional level? How dom in that year (source: Education at a Glance, could this affect the quality of educational estab- 1998). lishments? 56 | EUROPEAN REPORT ON THE QUALITY OF SCHOOL EDUCATION
  • 58.
    EXAMPLES OF NATIONALINITIATIVES (For more information see Annex 1) Scotland — New public–private partnership arrange- ments allow local authorities to fund school re-build- ing programmes, which they otherwise would not have been able to fund on such a scale. EUROPEAN REPORT ON THE QUALITY OF SCHOOL EDUCATION | 57
  • 60.
    ANNEXES EUROPEAN REPORT ONTHE QUALITY OF SCHOOL EDUCATION | 59
  • 62.
    1. EXAMPLES OFNATIONAL INITIATIVES France 1. MATHEMATICS In France a national ‘observatory’ for mathematics Austria teaching and achievement has been developed jointly by the Mathematics Teachers Association (APMEP) and In Austria, as a consequence of the poor results of the National Institute for Pedagogical Research (INRP). Austrian upper secondary students — different from Surveys carried out over 10 years have produced many the students of the seventh and eighth grades — the assessments tools and teaching references for pupils Austrian Ministry of Education has begun a project from grade 6 to grade 12. These are already used by with two principal objectives: hundreds of teachers and are now available on the In- ternet, and on CD-ROM, for all teachers. • to establish measures for the further development of instructional methods in mathematics; Germany • to develop a methodology for the use of materials relevant to TIMSS in mathematics instruction. In Germany, materials have been developed for math- ematics teachers, in which the TIMSS results are ex- These materials will serve as a tool in voluntary self- plained and suggestions for the improvement of math- evaluation of schools. The project is intended to be a ematics teaching are presented. These materials first step in relating international studies of student include a CD-ROM containing excerpts from a study achievement to practical work in schools. video, produced in the context of TIMSS, on the teach- ing of mathematics in Germany, Japan and the USA. Cyprus United Kingdom The Mathematical Society of Cyprus, in cooperation with the Ministry of Education and Culture, has initi- Launch of the Maths Year 2000 in January to raise ex- ated mathematical contests covering all areas of the pectations, promote a ‘can do’ attitude towards maths country and all ages of pupil. The response from and get rid of the national fear of figures. Maths Year pupils has been very high. The contests are helping to 2000 will make maths fun and accessible for everyone. build a culture which promotes excellence in mathe- And most importantly, Maths Year 2000 will support matics. the efforts of primary teachers to drive up standards in EUROPEAN REPORT ON THE QUALITY OF SCHOOL EDUCATION | 61
  • 63.
    maths through thegovernment’s national numeracy newspaper is integrated in different subject matters at strategy. Some 27 000 teachers from schools with the school. After four weeks of reading the local news- biggest challenges will receive intensive maths train- paper and getting familiar with structure, special lan- ing. guage and different types of texts (report, comment, etc.), the pupils also receive other newspapers (trans- As a response to the Unesco initiative to declare 2000 regional and weekly papers). The guided comparative ‘the year of mathematics’, most countries have set up reading also makes a remarkable contribution to polit- an agenda and projects which can be consulted ical education and to media-education in general. The (http://wmy2000.math.jussieu.fr/). As an example, the project is an excellent instrument to stimulate interest United Kingdom has organised a high-profile cam- in reading, in public affairs and promotes critical paign promoting mathematics as an enjoyable and judgement. The project is financed by the publishers interesting topic. The campaign is being led by a high- and by industry-sponsors. The participation rate is profile media personality famous for her numerical high. skills. For more information go to the web site (www.mathsyear2000.org). Italy In 1998, the Ministry of Education launched the ‘Prog- etto lettura 2000’ programme aiming to promote the 2. READING development of school libraries and to encourage reading among students of all kind of schools. Among Denmark the initiatives proposed by the schools, two are to be mentioned: The results from the IEA reading literacy survey from 1991 showed that Denmark was not at a high or na- Students (last year of lower secondary schools and all tionally acceptable level. Since then, Denmark has grades of upper secondary) can take part in their own made efforts to increase the reading level in compul- school in a jury which has to select the 20 most impor- sory education. One of the projects has been to tant books of 20th century from 100 youth books pro- strengthen educational/pedagogical research in the posed by a group of writers. The selected books must be field. Furthermore, the in-service training of school reviewed explaining the reasons of the choice; the re- teachers has been expanded and municipalities have views can be considered as a credit. The list of the most decided to increase the amount of lessons in reading favourite books at national level will be presented at the and writing. Teacher training colleges have, in accor- Book Fair (May 2000) and discussed with the students. dance with the latest ministerial order, upgraded the importance of Danish as a subject. A web site on reading ‘Giovani lettori protagonisti — Young readers are protagonists’, wholly addressed to The Ministry of Education, the National Association of pupils of primary and lower secondary schools will be Local Authorities and the Danish Union of Teachers ready next April as a ‘virtual’ online library. There will have together launched a big national programme be also a section for teachers with suggestions and di- ‘Folkeskolen 2000’. The aims of the programme include dactic proposals in order to motivate pupils toward setting standards for core knowledge and proficiency book reading (www.galassia.org). for each subject. Additionally, a project named Quality in Education, was introduced by the Danish Govern- ment in 1998 with the aim of strengthening qualifica- Sweden tions in Danish, mathematics and English. Research has shown that young people improve their reading skills when they participate in joint reading Germany experiences with a close friend or relative. Based on this finding, regional and local school authorities in Newspapers in schools — A large number of local and Sweden have asked and actively encouraged parents of regional newspapers in Germany take part in this proj- students aged 10 to 12 to spend half an hour per day ect: pupils receive over the period of three months reading a good book with their child. Half the time, ‘their’ daily newspaper (without paying for it). The the student reads aloud to the parent and the other 62 | EUROPEAN REPORT ON THE QUALITY OF SCHOOL EDUCATION
  • 64.
    half the childlistens to the parent reading. The au- the social relevance of science and technology; the thorities have supported this programme by funding strategic role of multimedia, telematics and informa- the purchase of interesting books that both students tion technologies; the interdisciplinary meaning of the and parents enjoy. content areas proposed by the programme. An initiative has been carried out aiming to improve teaching/learning processes in science and to prevent learning difficulties during the last year of primary 3. SCIENCE school (fifth grade) by means of individualised learning units and materials. The experience was based on the Europe DIVA model of individualised teaching (Didattica individ- ualizzata con valutazione analogica/Individualised ‘Women in Science’ is a mobile exhibition, obtainable teaching with analogical assessment): using analogy, this on request from the Member States’ Education Min- approach allows diagnostic tests to be developed which istry departments, which deals with equal opportuni- identify potential learning difficulties regarding specific ties and gender-related issues to be shown in the subject content. In this way remedial action can be secondary schools. planned before failure has actually happened and indi- It illustrates the history of science through the vidualised learning/teaching units can be prepared. The achievements of women in different periods of history content area selected for this innovative initiative deals and current trends in the feminist approach to science, with physical, chemical and biological phenomena. accompanied by figures and bibliographies, and also illustrates initiatives organised by European networks and by the European Commission to promote equal Slovakia opportunities at school, at university and in careers. ‘Schola Ludus’, launched by scientists of Comenius The content of the exhibition can be put to use by University, is an NGO operated, and MoE supported, teachers as a platform for discussing equal opportuni- programme commemorating Jan Amos Comenius’ be- ties in schools and perhaps for getting more girls to lief in the effectiveness of learning by playing. ‘Schola opt for scientific and technical subjects. Ludus’ promotes science education by interactive exhi- bitions touring the country. Ireland Spain European Union Physics Colloquium — The Colloquium on Attainment in Physics at 16+ was held in 1998 and The National Science Museum has a guide of school involved Ireland and eight other European education programmes for permanent exhibitions, temporary ex- systems. The colloquium examined approaches to hibitions, workshops, guided visits, didactical materials physics education at upper secondary level in the par- and courses. ticipating countries. Each country prepared a detailed The ‘Consejo Superior de Investigaciones Científicas’ or- paper on physics education. The outcome of the collo- ganises guided visits for groups to several scientific insti- quium was a report on the principal issues in physics tutes to acquaint young people with scientific research. education in upper secondary education in Europe. Italy 4. ICT In 1999, a national four-year programme ‘Progetto SET — SET project’ was launched, aiming to enhance pupils’ Europe scientific and technological skills and to raise their achievement levels. The programme is based on four One of the objectives of President Prodi’s eEurope ini- basic assumptions: a unified vision of science and tiative is to make digital literacy one of the basic skills technology; a wider concept of laboratory skills in- of every young European. eLearning is intended to im- cluding experimental skills and capacity to evaluate plement the education/training part of eEurope. This EUROPEAN REPORT ON THE QUALITY OF SCHOOL EDUCATION | 63
  • 65.
    initiative has fourcomponents: to equip schools with ment. A scheme to offer tax reductions for the purchase of multimedia computers; to train European teachers in home computers is currently being developed along with digital technologies; to develop European educational support schemes for teachers to acquire PCs for home use. services and software and to speed up the networking of schools and teachers. Italy Most of the resources to be mobilised will be national, but they should be backed by European Structural A large-scale programme, the PSTD ‘Programma di Fund assistance in the eligible regions, mobilisation of sviluppo delle tecnologie didattiche 1997–2000’, was the Community programmes to promote digitalisation promoted to spread information and communication and development of partnerships between public au- technologies (ICT) and aims to improve the thorities and industry. teaching/learning processes. The programme has defined three large categories of Cyprus objectives: From the school year 2000–01, the new type of lyceum 1. to promote students’ mastery of multimedia in — ‘the unified lyceum’ (upper secondary education) — terms of understanding and using different tools, or will be introduced in Cyprus. Following an extensive adopting new cognitive styles in the study, design and four-year pilot, the new lyceum will have three key the conduct of experiments in communication. new elements: 2. to improve the effectiveness of the • upgrading the ICT skills of pupils by introducing teaching/learning processes and the pedagogical or- curricular changes that provide for more teaching pe- ganisation eTwer regarding subject-bound competen- riods in ICT; cies or the acquisition of cross-curricular skills. • upgrading schools’ technological equipment; 3. to develop the professionalism of teachers not on- ly through education, but also by giving them tools • developing the skills of staff to enable the provi- and services for their daily job. sion of a more flexible programme of studies to suit the needs and aspirations of all pupils. An experimental teaching project called ‘Multilab’ (multimedia laboratory) aims to revolutionise teaching through the use of computers in classrooms. A net- Estonia work of seven schools has been set up in each of the 20 cities involved in the project and one of the upper In some Estonian schools, senior pupils are required to secondary schools selected is responsible for the coor- spend four hours a week on mentoring and tutoring dination and implementation of the initial in-service younger children in ICT, acting as a mediator between training phase for the teachers. them and their teachers. The benefits to older pupils are seen to be as significant as those for the younger Multilab does not, however, propose a single model for children who gain from working with peers whose ex- methods of teaching. The project is presented to the perience is more relevant. This takes place as part of a schools as an offer of the necessary structure and wide national initiative to increase the use of ICT and equipment. develop the expertise of teachers. The Newerlands Hungary The Dutch ‘knowledge net’ is a project of the Ministry In Hungary, initiatives are underway to promote new of Education bringing togewer pupils, parents, teach- methods and teaching aids that make use of ICT technol- ers and cultural organisations. It is a computer net- ogy in a range of school disciplines. Successful applicants work which also provides services: information, discus- are expected, in exchange for funds for equipment and sion groups, and technical facilities. Business firms re- software, to develop and test computer-assisted se- ceive tax benefits if they provide computers to schools. quences of lessons and give reports on student develop- Pupils (and teachers) receive a qualification, called the 64 | EUROPEAN REPORT ON THE QUALITY OF SCHOOL EDUCATION
  • 66.
    ‘digital educational driver’slicence’ (digitaal rijbewijs) count for e-mail and access to Internet. Around which sets a standard for basic ICT skills. 65 000 teachers have an account. More information (in Spanish) is available on the Internet (http://www,pntic.mec.es/). Poland The ‘Interkl@sa’ programme aims to prepare young Sweden people for work in the information society and to de- velop schools as modern centres for innovation and In Sweden the government offers in-service training creation. It also brings together two projects: the first for school leaders and teacher teams to learn how to establishing an Internet workshop in each commune, use computers as a tool. Money has been allocated by and the second planning an Internet workshop in each the government to supply 60 000 teachers with a per- secondary school. sonal computer. A specific State allowance is given to each school so that they can link up to the Internet. Within a few years all Swedish students will have their Slovakia own personal e-mail address. Info-age — Infovek, in Slovak (www.infovek.sk) — is a non-profit-making NGO operated programme aimed at the improvement of ICT in primary and secondary 5. FOREIGN LANGUAGES schools. Reflecting US and EU activities of this type, access to Internet, at least one multimedia laboratory and training of teachers is to be provided for all pri- Europe mary and secondary schools. The programme was The aim of the ‘European label’ is to help stimulate in- launched in 1999. It is supported by MoE and backed terest in language learning by highlighting innovative by the President of the Parliament. It continues the ef- language learning projects at all stages of education forts of Dutch–Czechoslovak project Comenius from and training. The European label was launched in the early 1990s and the recent ‘Open society fund’ pro- context of the Commission’s 1995 white paper ‘Teach- gramme which have already provided Internet access ing and learning: towards the learning society’, which to 138 schools. set the objective of helping all EU citizens to be profi- cient in three European languages. Slovenia The label can be awarded to any initiative in the field of language teaching and learning, whatever type of The objective of the ‘Developing computer literacy’ organisation is responsible and whatever the age of programme (http://ro.zrsss.si/) is to: train teachers and the learners involved. Some projects will involve the pupils for the use of information technology; imple- use of new technologies, but that is not essential. ment a standardisation of computer supported trans- What is important is that a project makes good use of fer of data between schools and other institutions; the resources available to it. unify the computer software used for teaching and administration purposes in schools; supply schools with up-to-date computer and data equipment; and Belgium provide the possibilities for research and development in the field of implementing new information tech- Due to the limited international importance of Dutch nologies in schools. (the mother tongue in Flanders), foreign language learning has a prominent position in Flanders. An im- pressive number of people attend foreign language Spain courses, not only in compulsory education (from age 12 to 18), but mainly in all kinds of adult education. All Spanish State schools have an official Internet ac- count and space to publish a web page. Many schools The most important provider is the Department of Ed- have created their own website. All teachers of State ucation, which offers courses in 18 languages (both, schools have the opportunity to ask for a personal ac- European and non-European). Access to these courses EUROPEAN REPORT ON THE QUALITY OF SCHOOL EDUCATION | 65
  • 67.
    is made easyand very cheap. Some language courses They have half-time classroom work. They have addi- are on offer as distance learning. In addition, specific tional duties, aimed at regular training of other FL types of work-related language training courses are teachers in several neighbouring municipalities in offered in the sector of occupational (VDAB) and self- state-of-the-art teaching methods; analysing the employment training (VIZO). Finally, many companies needs of in-service training for the municipalities for invest in modern foreign language training. which they are responsible, planning and managing the in-service training jointly with the regional inspec- The wish to interrelate the general and vocational lan- tors in FL. This cascade model of teacher training is guage offer has resulted in developments on the proving very successful, and currently similar consider- macro-level. The educational authorities have decided ations are under way for all other subjects. to work out a qualification structure in which both types of language offer are integrated. To that end the Department for Educational Develop- Hungary ment (DED) has worked out a common tool for build- Hungary, as other countries, has been participating in ing user-friendly and transparent language learning an experience of the Council of Europe (Modern Lan- curricula. It is a common framework to describe the guages Division) concerning a European language entire language offer (both general and occupational) portfolio (ELP) since its launch in 1998. The ELP is a provided by the Department of Education. This frame- personal document in which students can record their work uses a European-level indication as described in qualifications and other significant linguistic and cul- the common European framework of the Council of tural experiences in an internationally transparent Europe ‘Breakthrough up to effectiveness’. The frame- manner, thus motivating learners and acknowledging work: their efforts to extend and diversify their language • is based on the need for effective communication; learning at all levels in a life-long perspective. • meets the demands of society and the world of work by describing final objectives in terms of lan- Ireland guage tasks. These tasks are described in a systematic way, using a fixed set of building blocks. The final ob- In Ireland, a project has commenced aimed at increas- jectives are then clustered into certified modules. ing the range of foreign languages taken by students in secondary school. At present, French has by far been The first new curricula based on this framework will be the dominant foreign language taught in Irish schools on offer by September 2000 (basic level to Break- with the number of students taking German less than through); higher levels of proficiency will be intro- one-third of the number taking French. Very few stu- duced in 2001. dents take Spanish and far fewer take Italian. The project is aimed at increasing the numbers taking Spanish and Italian by increasing the number of Bulgaria schools which offer these languages. It is also intend- Improving foreign language (FL) teaching through cre- ed to introduce Japanese to the school curriculum. In ation of a network of ‘methodology teachers’ In order its initial stage the project is exploring how best this to improve FL teaching, the Bulgarian Ministry of Edu- extension of foreign languages may take place. cation and Science (MES) decided to create in 1996 a national network of so-called ‘teacher methodologists’. After a highly competitive selection process, over 150 candidates in four languages (English, German, French 6. LEARNING TO LEARN and Russian) were appointed to attend one- to two- year special part-time ‘training of trainers’ pro- Belgium (Flanders) grammes, and sat exams to become teacher methodol- ogists. In 1998, corresponding legislative changes were In Flemish Belgium, learning to learn skills are already a made and the position of ‘teacher methodologist’ was compulsory aspect of the 6 to 18 core curriculum. They introduced in the school system. About 150 teacher are presented as a cross-curricular theme to be integrated methodologists took this position all over the country. and applied in as many subjects as possible. Skills include 66 | EUROPEAN REPORT ON THE QUALITY OF SCHOOL EDUCATION
  • 68.
    the ability toreflect on your own learning, choose appro- naires have been developed for two age groups. One, for priate strategies for solving problems, being aware of students of 10 to 15 years of age, covers four main ar- feelings and be able to channel these effectively, and to eas: learning strategies; learning styles; awareness of make informed choices about subjects and careers. learning (‘metacognition’); and attitudes to school and learning. The second, aimed at students aged 14 to 17 in general and vocational education, has 14 scales, seven England of which tap cognitive, or thinking, skills while the other seven tap into affective, or feeling, aspects such as test In England, the Department for Education and Em- performance anxiety, self explanations for success and ployment (DfEE) has commissioned and published a re- failure, perceptions of one’s own competence or ability. port on thinking skills (McGuinness, Thinking Skills, DfEE, 1999) and made a Ministerial press release indi- The Netherlands cating the importance of this is an emerging govern- ment priority. At the level of practice level there are In the Netherlands, a cohort study of 20 000 second- numerous authorities and schools undertaking training ary students is repeated every five years using a test and examples of large-scale initiatives such as the developed to measure the general problem solving ca- University of the First Age, in Birmingham, which holds pacities of 14- to 15-year-old pupils. summer schools in which schoolchildren of secondary age practice accelerated learning techniques. 7. CIVICS Finland In Finland, research has been conducted as a prelude to Greece and Cyprus developing a new form of national assessment. The re- In Greece and Cyprus, the ‘Parliament of adolescents’ is search analysed factors which cut across and permeate an annual project in which elected Lyceum pupils act school subjects and came to be called ‘learning to learn as representatives of all other pupils living in all areas competencies’. Identification of these factors will, it is of the two countries. They meet in the House of Par- hoped, help to explain relative success and failure in liament and discuss matters of concern of the young general and in specific subjects. The national study of generation as well as matters of current importance to sixth graders in 1996 has provided a national norm for Greece and Cyprus. In their discussions they follow the later testing, leading in 1997 to a study of ninth graders, rules and regulations of the real Parliament. The proj- similarly furnishing a national norm. Further extensions ect has been successful in providing pupils with rich and developments are now building on this work. experiences in civics education. Germany Italy In Germany, widespread curriculum revision is taking In all secondary schools a ‘Statute of students’ rights place, encouraging pupils through the use of texts and and duties’ was introduced in order to enhance questionnaires to reflect on their working habits, their democracy in schools and widen students’ opportuni- learning strategies, their ability to communicate and ties (i.e., the right to be informed about learning goals cooperate. Teachers are given criteria for the measure- and assessment criteria, to participate in support ac- ment of self-regulated, cross-curricular work, in order tivities to prevent drop out; the duty of the schools to to certificate competencies in these areas. respect cultural and religious values of foreign stu- dents and to organise intercultural activities etc.). Italy The following are examples of courses and initiatives of ‘cross-curricular education’ dealing with civics at In Italy, a repertoire of instruments has been developed both curricular and extra curricular level: to measure learning to learn competencies and to pro- vide teachers with simple tools which they can use for • peace and human rights education: Amnesty In- remedial and individualised intervention. Question- ternational organised in-service teachers’ training and EUROPEAN REPORT ON THE QUALITY OF SCHOOL EDUCATION | 67
  • 69.
    elaborated students’ andteachers’ materials and In the field of ‘Education for Europe’, the National teaching units for schools in Rome and other Italian Centre for Teachers’ Improvement has trained 1 200 towns (http://www.amnesty.it/edu/index.html); teachers using a multimedia methodological tool ‘An educational package on the European integration’. • environmental education and education for cul- tural heritage: at national level many schools are in- volved in initiatives for the ‘adoption’ of monuments and local areas allowing students to develop a sense of 8. DROP-OUT RATES belonging to their local communities. See the web site (http://www.legambiente.com/scuola/index.html), which is in Italian; Europe • intercultural education: Peter Pan is a European At European level, the ‘Second chance schools’ project multilingual school magazine, on paper and online. offers education and training to young people who The online version (http://www.geocities.com/ lack the skills and qualifications necessary to find a job CollegePark/Theater/8153/index.html) and chat-line or benefit fully from conventional training. The project (http://members.xoom.it/PeterPanNews/chat.html) can aims to set up long-term partnerships between all be found on the Internet; those concerned, at local level, with the social and economic integration of young people at risk of social • education for lawfulness: the national cultural asso- exclusion. More information can be found on the In- ciation LIBERA (Associations, names and numbers against ternet (http://europa.eu.int/comm/education/2chance/ mafias) signed an agreement with the Italian Ministry of homeen.html). Education in order to carry out a plan of action-research in schools aiming to define specific competencies in this area. The agreement provides for the collaboration of all Bulgaria provincial representative councils of students. In 1997, a Phare project was launched to cope with the increase in school drop outs as a result of the un- stable economic situation. The project was named Poland ‘School for everybody’. Its main goals were to build ex- In accordance with the requirements and needs of the pertise for coping with this complex problem through education reform taking place in the country, the appropriate training, involving all concerned stake- holders, and building centres of expertise and aid KOSS programme has trained 2 000 teachers to teach throughout the country. As a result of the project, 13 civics to their students. It also creates and publishes project centres were established countrywide, three of civics programmes. which are resource centres for teacher training, and ‘Law and civics education in secondary schools’ is a the rest are centres for school dialogue. Considerable programme which deals with the creation of courses in training of teachers, headmasters and other stakehold- cooperation with the pupils. Within the framework of ers took place too. At the end of the project the 13 this programme, lessons are developed and conducted centres officially became part of the educational sys- with the active participation of pupils. tem. They offer various expertise and training in meth- ods, curriculum design, psychology training, advice, An estimated 200 000 pupils from primary and sec- pupil consultancy services, and support to schools, ondary school (the ‘Gymnasium’ system, implemented municipalities, parents and pupils to cope with the following educational reform) have learned and are drop-out problem. They are obliged to train staff for learning civics through the KOSS programme. other such centres to be created in each of the 28 re- gions of the country. ‘Young citizens are active’ is a project aiming to teach young people to participate in everyday life in an ac- tive and productive way. Pupils have to try to find so- France lutions to the most important problems they feel exist within their society and to convince the local authori- A ‘New chance’ for young people who leave school ties to develop their ideas. without qualifications. Each year some 57 000 young 68 | EUROPEAN REPORT ON THE QUALITY OF SCHOOL EDUCATION
  • 70.
    people leave theeducational system in France without for schools to report early school-leavers to the qualifications and therefore risk social and profession- municipality. al exclusion. The French Government takes the view that schools are not only responsible for education and training of the young people attending them, but Poland also for the future of those who leave school where no arrangements for transition are in place. This new ac- To help reduce the numbers of those dropping out in tion: Poland, an educational psychology service was set up and, in 1998/99, 7 646 school educationalists were re- • encourages responses for each young person cruited by schools to identify pupils’ individual needs, rather than general solutions; to analyse the causes of failure and to find ways of remedying them. In the same year, 978 psychologists • facilitates initiatives and supports innovation; were hired by schools to look at the potential difficul- • acts together with partners, particularly enterprises. ties facing pupils and to organise different forms of psychological therapy. In addition, they provide advice The programme, which was launched in May 1999, has to students and teachers and cooperate with the edu- a number of objectives. It aims to: improve procedures cationalists and parents in order to prevent behaviour- for identifying the young people concerned and in- al disorders and initiate educational assistance inside crease the available information about the issue of and outside schools. drop out; prevent disaffection in upper secondary schools; enrich training up to the level of CAP; and de- velop a European dimension (the integration of the Spain European ‘Second chance schools’ projects into the ‘New chance’ programme is explicitly mentioned). Three different initiatives, two of them depending on the Ministry of Education or the autonomous commu- nity, the other depending on the Ministry of Labour or Germany the autonomous community. Some pupils will become drop outs because they lose • ‘Programmas de garantía social’ for 16 to 21 year olds interest in theoretical learning at school. In Germany it who have not finished secondary education or have no has proved useful to find local industry partners who professional qualification to the labour market. These can give those pupils the chance to gain experience in programmes are described (in Spanish) on the Internet practical working, in parallel with their school-based (http://www.mec.es/cnrop/portada_cnrop_40.htm). learning. It has been shown that a relatively large • ‘Formación profesional ocupacional’ provided by number of pupils gain new motivation for education the Ministry of Labour and funded by the European So- at school as a result of this approach. cial Fund. Details, in Spanish, can be found on the Inter- net (http://www.inem.es/ciudadano/p_formacion.html). The Netherlands • Secondary education for adults (ESPA). Early school-leaving in the Netherlands is challenged by a policy of cooperation between schools at a re- United Kingdom gional level. Early school-leavers are registered and are put back into schools as much as possible in order to ‘New deal’ is a key part of the UK Government’s ‘Wel- give them the opportunity to achieve an upper sec- fare to work’ strategy. It gives jobseekers aged 18 to ondary qualification. To achieve this, 39 regional cen- 24, 25 + and those with disabilities a chance to devel- tres (RMC) have been formed with responsibility for op their potential, gain skills and experience and find registering early school-leavers and coordinating ac- work. It also provides an opportunity for businesses to tions. These regional centres take into account the dif- make use of the untapped energies and talents of a ferent responsibilities of the stakeholders in the region new labour force. More than 67 000 companies have (school, employment agencies, justice, youth care, mu- signed ‘New deal’ employer agreements so far. Partner- nicipalities, etc.) in deciding how best to act. A law is ship between the Employment Service and a wide currently being prepared which will make it obligatory range of organisations is crucial to the success of ‘New EUROPEAN REPORT ON THE QUALITY OF SCHOOL EDUCATION | 69
  • 71.
    deal’. ‘New deal’was created to help unemployed peo- institutions. These are organised at institutional level ple into work by closing the gap between the skills and between institutions, in line with Government pol- employers want and the skills people can offer. icy, and are supported in different ways by the State. One example is the ‘Accessing college education’ proj- ect. Sixty students were accepted into the project and while at school they benefited from extra classes and 9. COMPLETION OF UPPER SECONDARY supervised study and also tuition in study skills. As the EDUCATION students are encouraged to forgo paid employment while at school, they are each given money each month by the project. They are also provided with academic, Ireland personal and financial support while they are in college. In Ireland, one of the most important aims of educa- tion policy is to maximise the numbers of students who complete upper secondary education. To that end Scotland an alternative programme, the ‘Leaving certificate ap- In Scotland, the ‘Open University’ and ‘Open College’ plied’, has been devised for students for whom the are interesting examples of making tertiary education mainstream programmes are not suitable. This pro- more available to mature students and those in remote gramme focuses on the needs and interests of students areas. Perhaps more topical is the development of the using a range of methodologies. It also seeks to devel- new ‘University of the Highlands and Islands’, which is op in the students an enterprising outlook, self-confi- making extensive use of remote access teaching tech- dence and other skills related to success in the work- nology to link a number of centres with students place. Students are required to perform tasks during across the remote rural region of northern Scotland. the two years of the ‘Leaving certificate applied’, which are assessed and count towards the student’s fi- nal examination. Work experience and preparation for the world of work are also important aspects of the 11. EVALUATION AND STEERING OF SCHOOL programme. EDUCATION Spain Austria The ‘Centro para la Innovación y Desarrollo de la Edu- In advance of the general introduction of compulsory cación a Distancia’ (CIDEAD) organises and coordinates school planning and self-evaluation, a rich resource site ‘Educación a distancia’ intending to facilitate access to on the Internet has been established for schools, allowing education to adults and also to non-adults who due to them to access information, ideas, procedural proposals, personal, social, geographical or other exceptional cir- instruments and other support for schools programme cumstances cannot follow education at school with development and self-evaluation (http://www.qis.at). daily attendance. It provides primary education, sec- ondary, and secondary for adults and non-compulsory post-secondary education. Denmark Denmark launched the Danish Evaluation Institute, in August 1999, a single organisation for the evaluation of all levels of education. The mandate of the institute 10. PARTICIPATION IN TERTIARY EDUCATION is internationally unique, because it is given the task by Parliament to undertake systematic and mandatory Ireland evaluation of teaching and learning at all levels of the educational system from kindergarten classes to post- In Ireland, many of the universities and other tertiary in- graduate courses. stitutions now have programmes which are aimed at re- dressing the current imbalance in the representation of In order to understand the expectations of Government the social classes in the universities and other tertiary and Parliament it is necessary to point to two highly vis- 70 | EUROPEAN REPORT ON THE QUALITY OF SCHOOL EDUCATION
  • 72.
    ible elements inthe recent Danish political debate on Portugal education. Firstly, there has been much concern about the transition from one level to the next in the educa- Evaluation and steering of schools is now seen in Por- tional system, whether it be the transition from primary tugal as very much connected with the definition of to secondary or from secondary to tertiary education. educational plans which schools are required to elabo- Secondly, OECD surveys during the 1990s have ques- rate and follow. tioned the skill levels of Danish primary school pupils in PEPT (Education for every student), a programme de- elementary reading and mathematics. signed in 1991 to foster students completion of com- Europe pulsory education, made it obligatory for every school to structure a self-evaluation plan which includes an The European pilot project ‘Evaluating quality in observatory with 15 indicators relating to context, school education’, a self-evaluation profile, provided a process, resources and outcomes. highly stimulating starting activity and influenced pol- icy developments in a number of countries and in Similarly the Institute of Educational Innovation (IIE), some, for example Italy and Portugal, the pilot has is currently taking forward work on self-evaluation of been extended to involve a wider group of schools. quality education in schools first developed and fi- nanced by the European Commission. For the full report see the web site (http://europa.eu.int/comm/education/poledu/ finalrep/rep.pdf). Scotland Scotland has a well-developed approach to promoting Hungary self-evaluation in schools, backed up by publication of examination results and a regular programme of inde- The improvement of quality has a prominent place in pendent inspections of individual establishments. ‘How the strategy of the Ministry of Education in Hungary. good is our school?’ was published in 1996. It is a A comprehensive programme of quality development toolkit for schools to use in self-evaluation, based on a has been initiated by the Ministry. A new pilot project set of 33 performance indicators. These were organised will be launched with more then 400 public institutes, into seven key areas. In the latest development of this nursery schools (pre-primary education institutes), approach many schools across the country (in some primary and secondary schools (including the voca- cases schools within a local authority) are beginning to tional training schools) and hostels. The programme publish their own self-evaluation reports (standards focuses on the operation and management of the and quality reports) in which they summarise their schools, thus internal development work will be car- own evaluation of their performance in each of the ried out by the institutions themselves. The success of key areas for their stakeholders. Development of the the quality development programme is largely based self-evaluation approach in Scotland is being taken on the cooperation of teachers, providers, and those forward through the nationally coordinated ‘Quality responsible for quality assurance in the domain of in- initiative in Scottish schools’. dustry. One of the most important elements of pro- fessional support is the Manual of Quality Improve- ment, published by the Ministry, which is available for Spain each institution. • INCE (Instituto Nacional de Calidad y Evaluación) was created to design evaluation systems for the dif- The Netherlands ferent types of education governed by the LOGSE (new law for education). About 0.5 % of the budget for primary and secondary education is spent on external evaluation activities • Self-evaluation of schools is mandatory in Spain; such as tests, examinations, evaluations by the inspec- schools are free to follow their own model of self- torate, and large-scale evaluation research. School also evaluation. The Ministry of Education has published have their own systems for internal evaluation of the the ‘Modelo Europeo de Gestión de Calidad’, but train- quality of education. ing is needed to put the model into practice. EUROPEAN REPORT ON THE QUALITY OF SCHOOL EDUCATION | 71
  • 73.
    The Ministry ofEducation holds an annual contest for service teacher training during seven years of practice. an award of quality in education, the objectives of The courses could be supplied by any kind of training which are to foster quality improvement in education organisation including HE institutions, pedagogical in- through quality in the management of schools and to stitutions, schools, training firms, NGOs or even private foster use of the ‘Modelo europeo de gestión de cali- individuals. The courses should go through an accredi- dad’ as a systematic tool of self-evaluation for im- tation process which includes two phases: first, the provement. professional accreditation of the programme and, sec- ond, the accreditation of the local implementation of the programme — this allows organisations to imple- ment programmes created by others if they agree. 12. PARENT PARTICIPATION Each programme is required to have an internal quali- ty assurance and quality management system. All edu- cation institutions receive per capita funding based on Europe the number of teachers employed form the state EPA’s ‘Training programme in partnership’ is an exam- budget to cover the costs of the courses (tuition and ple of how to improve quality through cooperation other expenses). and constructive dialogue between parents and teach- ers at the school level. Portugal Many parents do not come to the school — through fear, lack of knowledge, lack of time or lack of aware- ‘Sailing through the Portuguese language’ is the name ness. EPA’s training course targets these parents and given to an initiative of the Department of Secondary highlights their important role and responsibility in Education of the Portuguese Ministry of Education, de- the education of their own child. It provides them with signed to provide teaching training using Internet facil- the confidence to communicate effectively with ities. This initiative started in October 1999 and is in- teachers. tended for teachers of the Portuguese language who work with 11th grade students. There are now 158 teachers following this initiative. ‘Sailing through the Germany Portuguese language’ offers a range of opportunities including glossary, activities and solutions to problems In Germany, seminars for parents are provided at both and participating in a group discussion through the classroom and school level with three primary aims: Internet. • to inform them of new developments in learning and teaching and the part they can play in supporting their children’s learning; 14. PARTICIPATION RATES IN PRE-PRIMARY • to establish consensus on areas of school life, such EDUCATION as social education and values education; • to motivate them to participate in wider aspects Italy of school policy such as school rules and policies on violence, drugs, etc. In Italy, three initiatives concerning quality in infant education have been promoted by the Ministry of Ed- ucation and by the National Institute for the Evalua- tion of Education Systems. 13. EDUCATION AND TRAINING OF TEACHERS A four-year national programme of in-service teacher training aims to: Hungary • promote a process of action research and imple- The in-service teacher training system — the Act on ment innovations in four areas: curriculum, education- Public Education has declared that each teacher al organisation, life contexts of children, professional should participate in at least 120 contact-hours of in- identity of teachers; 72 | EUROPEAN REPORT ON THE QUALITY OF SCHOOL EDUCATION
  • 74.
    encourage and record innovative experiences; 15. NUMBER OF STUDENTS PER COMPUTER • disseminate relevant results and practices at re- gional and national level; Belgium (French) • enhance teachers’ expertise; In 1998, a partnership was signed between the French Community of Belgium (responsible for education and • set up a network of professional resources able to teachers training), Walloon or Brussels Capital regions support innovative processes and to meet new de- (responsible for technology and equipment) and the Fed- mands of teacher training. eral State (responsible for telecommunications) in order A project entitled ‘Special actions to evaluate quality to offer to each primary and secondary school a ‘cyber in infant schools’ aims to: centre’: computers and facilities to connect to Internet. • carry out a national survey of schools’ experiences of self-evaluation in the context of factors which con- Estonia tribute to children’s learning and development; The Estonian ‘Tiger leap’ programme is a national tar- • develop a scale to be used by teachers for evalu- get programme with the overall objective of improving ating the quality of different aspects of the school the educational system in Estonia through the intro- setting. duction of modern information and communication technologies. The programme is aimed at general edu- The project QUASI (Quality of infant school) is a study cation systems, but it also involves vocational educa- aiming to define a repertoire of quality indicators rel- tion. Further information can be found on the Internet evant to infant schools. (http://www.tiigrihype.ee/english). Italy Luxembourg In 1999, many important companies and banks (Tele- In Luxembourg, all children aged between four and six com, Enel, Alitalia, Benetton, Banca di Roma, etc.) pro- years are obliged to attend institutions of pre-primary vided schools with their old (but perfectly working) education. In addition, a third of three-year-olds at- computers. In March 2000, the Italian Government tend these institutions. Pre-primary education places launched a national plan for spreading the use of considerable emphasis on language development in a computers among students at home, based on an multilingual environment. agreement with the Italian Association of Banks. The initiative provides an interest-free loan for purchasing a computer. The Netherlands In the Netherlands, the Ministry of Education and the Ministry of Health have implemented two experimen- Portugal tal programmes for early childhood education (Pi- Computers have been provided to schools in recent ramide and Kaleidoscope) with a view to stimulating years and, currently, every school, from 5th through to the cognitive, social-emotional and linguistic develop- 12th grade, has a least one computer with access to ment of disadvantaged children aged between three the Internet. The new regulations on school adminis- and six years. The programme aims to give these chil- tration and management, issued in 1998, created clus- dren a better start in primary education. The pro- ters of schools (agrupamentos) which allow for the grammes are implemented in close cooperation with sharing of human as well as material resources. both childcare centres and schools for pre-primary ed- ucation, and allow the children to receive more per- FOCO — the Portuguese programme for teacher train- sonal attention. Evaluation shows that there is a sig- ing — defined the area of technology information and nificant (initial) effect, especially on the cognitive de- communication as one of its first priorities. FOCO is velopment of these children, and also on their vocab- developed in the 150 teacher training centres created ulary and thought processes. by the association of several schools. EUROPEAN REPORT ON THE QUALITY OF SCHOOL EDUCATION | 73
  • 75.
    16. EDUCATIONAL EXPENDITURE PER STUDENT Scotland In Scotland, the Government has encouraged the use of new public–private partnership arrangements to al- low local authorities to fund school rebuilding pro- grammes which they otherwise would not have been able to fund on such a scale. These arrangements make it attractive for private investors to put the money up front for major building programmes. In Glasgow, for example, this is allowing the authority to create sever- al completely refurbished schools at once, thus ratio- nalising inefficient, under-capacity schools and replac- ing poor-quality buildings. This sort of initiative allow major quality improvements in education to be funded efficiently without capital funds all having to come from the public purse. 74 | EUROPEAN REPORT ON THE QUALITY OF SCHOOL EDUCATION
  • 76.
    2. REFERENCES ANDFURTHER READING Mathematics Union. Studies, Office for Official Publications of the European Communities, Luxembourg, 1999. Black, P., Atkin, M., Changing the subject: Innova- tions in science, mathematics, and technology edu- Lafontaine, D., ‘From comprehension to literacy: cation, London and Paris, 1996. thirty years of reading assessment’, in OECD, Net- work A 2000, OECD, Paris (not yet published). Keitel, C., Kilpatrick, J., ‘The Rationality and irra- tionality of international comparative studies’, in: Postlethwaite, T. N. and Ross, K. N., Effective schools Kaiser, G., Luna, E., Huntley, I., International com- in reading. Implications for educational planners, parisons in mathematics education, London, 1998, The International Association for the Evaluation of pp. 241–257. Educational Achievement, La Haye, 1992. For more information on the TIMSS study visit For more information about the IEA Reading Litera- http://timss.bc.edu cy study visit: http://uttou2.to.utwente.nl/rl/iea-rl.htm Reading Science Dombey, H. (coord.), Early literacy teaching and learning. Innovative practice in four different na- Adey, P., The science of thinking, and science for tional contexts: a thematic network, European thinking: A description of cognitive acceleration Commission, Brussels, 1998. through science education (CASE), International Bu- reau of Education (Unesco), 1999. Elley, W. B., How in the world do students read?, The International Association for the Evaluation of Edu- Beaton, A. E., Martin, M. O., Mullis, I. V. S, Gonzalez, cational Achievement, La Haye, 1992. E. J., Smith, T. A. and Kelly, D. L., ‘Science achieve- ment in the middle school years’, IEA’s third inter- Elley, W. B. (ed.), The IEA study of reading literacy: national mathematics and science study (TIMSS), achievement and instruction in thirty-two school Boston College, Chestnut Hill (Ma.), 1996. systems, Pergamon, Oxford, 1994. Coughlan, R. (ed.), Attainment in physics — Pro- European Commission (Education, Training, Youth ceedings of the colloquium on attainment in DG), Initial teaching of reading in the European physics at 16+, Stationery Office, Dublin, 1999. EUROPEAN REPORT ON THE QUALITY OF SCHOOL EDUCATION | 75
  • 77.
    Martin, M. O.,Mullis, I. V. S., Gonzalez, E. J., Smith, T. project, Eburon Publishers, Delft (Netherlands), A. and Kelly, D. L., ‘School contexts for learning and 1999. instruction’, IEA’s third international mathematics and science study,. Boston College, Chestnut Hill INRA (Europe) – European coordination office, (Ma.), 1999. ‘Young Europeans’, Eurobarometer, No 47.2, Euro- pean Commission, Directorate-General XXII, Brus- Séré, M. G. (coord.), Improving science education: sels, 1997. Issues and research on innovative empirical and computer-based approaches to labwork in Europe, For more information on the Eurobarometer surveys European Communities, Brussels, 1998. visit http://europa.eu.int/comm/dg10/epo/eb/ surveys.html or for IEA civic education study, visit Wise, K. C. and Okey, J. R., ‘A meta-analysis of the http://www2.hu-berlin.de/empir_bf/iea_e.html. effects of various science teaching strategies on achievement’, Journal of Research Science Teaching, 20 (5), 1983, pp. 419–435. Drop-out rates For more information on the TIMSS study visit: http://timss.bc.edu Bucchi, M. — IARD (Istituto di Ricerca), Dropping out and secondary education, European Commission, Directorate-General XXII, Brussels. Foreign languages Colson, D., Gérard, Fr.-M., Guitard, Cl. and. Mar- Blondin, C. (coord. and ed.), European Commission tynow, N. (Bureau d’Ingénierie en Education et en (Education, Training, Youth DG), Learning modern Formation, Louvain-la-Neuve), Getting on with languages at school in the European Union. Studies training, European Commission, Directorate General — No 6, Office for Official Publications of the Euro- XXII, Brussels. pean Communities, Luxembourg, 1997. Eurydice, Measures to combat failure at school. A Bonnet, G. (ed.), The effectiveness of the teaching challenge for the construction of Europe, Brussels, of English in the European Union. Report of the col- 1994. loquium. Background documents (October 1997), Ministère de l’Education Nationale, Direction de l’é- Institut de la Méditerranée, Colloque de Marseille, valuation et de la prospective, Paris, 1998. See also: L’école de la deuxième chance, Editions de l’Aube, http://www.education.gouv.fr/dpd/colloq/ Saint-Etienne, 1997. INRA (Europe) — European coordination office, Ides Nicaise (ed), Success for all? Educational ‘Young Europeans’, Eurobarometer, No 47.2, Euro- strategies for socially disadvantaged youth in six pean Commission, Directorate-General XXII, Brus- European countries, Leuven, 1999. sels, 1997. OECD, Venir à bout de l’échec scolaire, OECD, Paris, For more information on the Eurobarometer surveys 1998. visit: http://europa.eu.int/comm/dg10/epo/eb/surveys.html Serrano Pascual, A., Ouali, N. and Desmarez, P. (Cen- tre de sociologie du travail, de l’emploi ed de la for- For details of DIA-LANG, a diagnostic computer- based assessment project funded by the European mation (TEF), Université Libre de Bruxelles), Prevent- Commission under the Socrates programme, visit: ing failure at school and in professional life in Eu- http://www.jyu.fi/DIALANG/general.html rope, European Commission, Directorate-General XXII, Brussels. Civics Evaluation and steering of school education Torney-Purta, J., Schwille, J. and Amadeo, J. A. (eds.), Civic education across countries: Twenty-four na- SICI, Inspectorates of education in Europe — A de- tional case studies from the IEA civic education scriptive study, Brussels, 1999. 76 | EUROPEAN REPORT ON THE QUALITY OF SCHOOL EDUCATION
  • 78.
    Parents’ participation Jacques Delors, L’Education — Un trésor est caché dedans, Unesco, Paris, 1996. Eurydice, The role of parents in the education sys- tems of Europe, Brussels, 1997. European Commission, Accomplishing Europe through education and training, Office for Official Publications of the European Communities, Luxem- Number of students per computer bourg, 1997. Pelgrum, W. J. and Andersen, R. E., ICT and the European Commission, Education across Europe — emerging paradigm for life long learning: A world- Statistics and Indicators 1999, Office for Official wide educational assessment of infrastructure, Publications of the European Communities, Luxem- goals and practices, OCTO, Enschede (the Nether- bourg, 2000 lands), 1999. European Commission, Evaluating quality in school For more information on the TIMSS study, visit education — A European pilot project, Office for Of- http://timss.bc.edu ficial Publications of the European Communities, Luxembourg, 1999. For more information on the IEA/SITES study, visit: http://www.mscp.edte.utwente.nl/sitesm1/ European Commission/Eurydice/Eurostat, Key data on education in Europe 1999–2000, Office for Offi- cial Publications of the European Communities, General Luxembourg, 2000. Centre for Educational Research and Innovation (CERI), ‘Education at a glance’, OECD indicators, OECD, Paris, 1996, 1997 and 1998. Centre for Educational Research and Innovation (CERI), Education Policy Analysis, OECD, Paris, 1997 and 1999. EUROPEAN REPORT ON THE QUALITY OF SCHOOL EDUCATION | 77
  • 80.
    3. LIST OFPARTICIPANTS IN THE WORKING COMMITTEE ON QUALITY INDICATORS BELGIUM GERMANY Mrs Martine HERPHELIN Frau Ministerialrätin Helga HINKE Directrice générale adjointe Bayerisches Staatsministerium für Unterricht und Kultus Direction de la Recherche en éducation et pilotage in- terréseaux Administration générale de l’Enseignement et de la GREECE Recherche scientifique Ministère de la Communauté française Prof Nikitas PATINIOTIS Laboratory of Sociology and Education Mrs Fanny CONSTANT University of Patras Attachée Direction de la Recherche en éducation et du Pilotage interréseaux SPAIN Administration générale de l’Enseignement et de la Recherche scientifique Mrs María L. MORENO MARTINEZ Ministère de la Communauté française Technical Advisor Instituto Nacional de Calidad y Evaluación Mr Etienne GILLIARD Attaché Administration générale de l’Enseignement et de la FRANCE Recherche scientifique Ministère de la Communauté française Mr Gérard BONNET Chargé de mission auprès du directeur de la program- Mr Roger STANDAERT mation et du développement Directeur Direction de la programmation et du développement Ministerie van de Vlaamse Gemeenschap Dienst voor Onderwijsontwikkeling Ministère de l’éducation nationale Mr Jacques PERRIN DENMARK Inspecteur général Mrs Birgitte BOVIN Ministère de l’éducation nationale Head of Section Uddannelsesstyrelsen Undervisningsministeriet EUROPEAN REPORT ON THE QUALITY OF SCHOOL EDUCATION | 79
  • 81.
    IRELAND AUSTRIA Dr Carl Ó DÁLAIGH Dr Herbert PELZELMAYER Deputy Chief Inspector Leiter der Abt. I/3 des Bundesministeriums für Bildung, Department of Education and Science Wissenschaft und Kultur; Bildungsforschung, Planung, Kooperation Mr Richard COUGHLAN Senior Inspector Dr Werner SPECHT Evaluation Support & Research Unit ZSEII — Zentrum für Schulentwicklung Department of Education and Science Abt.II: Evaluation und Schulforschung Mag. Erich SVECNIK ITALY Researcher ZSEII — Zentrum für Schulentwicklung Prof. Benedetto VERTECCHI Abt.II: Evaluation und Schulforschung President C.E.D.E. — Centro Europeo Dell’Educazione Istituto Nazionale per la Valutazione del Sistema del- PORTUGAL l’Istruzione Mrs Gloria RAMALHO Prof. Vega SCALERA Directora Researcher Gabinete de Avaliação Educacional C.E.D.E.— Centro Europeo Dell’Educazione Istituto Nazionale per la Valutazione del Sistema del- FINLAND l’Istruzione Mr Simo JUVA Director LUXEMBOURG General Education Division Ministry of Education Mr Dominique PORTANTE Directeur Service de Coordination de la Recherche et de l’Inno- SWEDEN vation pédagogiques et technologiques Mr Ulf P. LUNDGREN Ministère de l’Education nationale, de la formation Director General professionnelle et des Sports National Agency for Education Mr Mats EKHOLM THE NETHERLANDS Director General Mr Jan van RAVENS National Agency for Education Head Mrs Eva EDSTRÖM-FORS Unit Multilateral Affairs and Knowledge Director Department of International Relations Ministry of Education and Science Ministry of Education, Culture and Science Mr Staffan LUNDH Mr Jaco van RIJN Director Researcher National Agency for Education Unit Information Policy and Forecasting Ministry of Education, Culture and Science UNITED KINGDOM Mr Ruud ABELN Head Ms Chloe WEST Unit Information Policy and Forecasting Team Leader Department of Financial Economic Affairs Pupil Performance and Research Team Ministry of Education, Culture and Science Department for Education and Employment 80 | EUROPEAN REPORT ON THE QUALITY OF SCHOOL EDUCATION
  • 82.
    Mr Chris WORMALD HUNGARY Team Leader Mr Zoltàn BOGDÁNY Excellence in Cities Initiative, Standards & Effective- Deputy Head ness Unit The Minister’s Cabinet Department for Education and Employment Ministry of Education UNITED KINGDOM (SCOTLAND) Mrs Katalin HERNECZKI Director of Comenius 2000 Dr Wray BODYS Quality Improvement Programme Bureau Lead Officer HM Inspector of Schools/Audit Unit LATVIA Education Department Scottish Executive Mr Nils SAKSS Mission of Latvia to the European Commission Dr Bill MAXWELL Lead Officer Dr Andrejs RAUHVARGERS Quality, Standards and Audit Division Deputy Head of State Secretary for HM Inspectors of Schools Education Strategy & Int. Cooperation Scottish Executive Education Department Ministry of Education and Science LITHUANIA BULGARIA ˇ Mr Ricardas ALISAUSKAS ˇ Mr Pencho MIHNEV Head Senior Expert Education Development Division Department ‘General Education’ Ministry of Education and Science Ministry of Education and Science ˇ Mr Arûnas PLIKSNYS Director CYPRUS General Education Department Dr Kyriacos PILLAS Ministry of Education and Science Head Research & Evaluation Unit POLAND Pedagogical Institute Ministry of Education & Culture Mrs Aldona HILDEBRANDT Chief Inspector Mr Vasilis PHILIPPOU Department of Teachers’ Improvement Secretary A Ministry of National Education Permanent Delegation of the Republic of Cyprus to the Mrs Ewa KOLASINSKA European Union Senior Inspector Department of Teachers’ Improvement CZECH REPUBLIC Ministry of National Education Dr Jan SOKOL Former Minister of Education ROMANIA Ministry of Education, Youth & Sports Mr Alexandru MODRESCU Head ESTONIA Department for Documentation and Education Analysis Socrates National Agency Mrs Epp. REBANE Head Mr Mircea MANIU General Education Department General Director of the International Relations Department Ministry of Education Ministry of National Education EUROPEAN REPORT ON THE QUALITY OF SCHOOL EDUCATION | 81
  • 83.
    SLOVAKIA EXPERTS Dr Juraj VANTUCH Mrs Christiane BLONDIN Faculty of Education Service de pédagogie expérimentale Comenius University Université de Liège Mr Marc DEMEUSE SLOVENIA Maître de Conférences Mr Janez KREK Service de pédagogie expérimentale Assistant Université de Liège Faculty of Education Prof. Dr Klaus KLEMM University of Ljubljana Fachbereich 2 Universität/Gesamthochschule Essen EUROPEAN COMMISSION Prof. John MACBEATH Mr Anders J. HINGEL Quality in Education Centre Head of Unit University of Strathclyde Directorate-General for Education and Culture Development of education policies OECD – Organisation for Economic Cooperation and Mr Lars Bo JAKOBSEN Development Detached national expert Directorate-General for Education and Culture Mr Andreas SCHLEICHER Development of education policies Deputy Head Statistics on Indicators Division Mr Ben ROLLES Trainee Mr Tom SMITH Directorate-General for Education and Culture Statistics on Indicators Division Development of education policies Miss Kate LYONS Trainee Directorate-General for Education and Culture Development of education policies Miss Liliane LAUBACH Secretary Directorate-General for Education and Culture Development of education policies Mr Spyridon PILOS Education and training statistics Coordination Eurostat UNITE EUROPEENNE D’Eurydice Madame Luce PEPIN Directrice Madame Arlette DELHAXHE Directrice adjointe/Etudes et analyses Mr Patrice BREL Graphiste 82 | EUROPEAN REPORT ON THE QUALITY OF SCHOOL EDUCATION
  • 84.
    European Commission European reporton the quality of school education Sixteen quality indicators Luxembourg: Office for Official Publications of the European Communities 2001 — 82 pp. — 21 x 29.7 cm ISBN 92-894-0536-8
  • 86.
    16 NC-30-00-851-EN-C EN ISBN 92-894-0536-8 OFFICE FOR OFFICIAL PUBLICATIONS EUR OF THE EUROPEAN COMMUNITIES L-2985 Luxembourg 9 789289 405362