This document describes an experiment to measure changes in respiratory parameters in response to different physiological challenges: breath holding, rapid breathing, and exercise. The experiment uses a spirometer interfaced with a computer to collect tidal volume data before, during, and after each challenge. Key respiratory measurements - tidal volume, respiratory rate, and minute ventilation - are recorded and compared between the different conditions to observe how respiration is altered to maintain homeostasis in response to changes in carbon dioxide levels.
Dental implant courses are an excellent way to expand your current dental practice.. Dr. John Minichetti explains the current bone grafting techniques that are critical to a good dental implant course. Make sure the dental implant course you choose includes these key bone grafting techniques.
enpaK, une organisation haïtienne non-gouvernementale, de développement basée sur les droits humains, a supporté la participation de Jefferson Belizaire a la 1ere édition du Parlement Francophone des Jeunes des Amériques. Cette activité s’accorde avec le programme Gouvernance et Citoyenneté de enpaK.
Indian Dental Academy: will be one of the most relevant and exciting training
center with best faculty and flexible training programs for dental
professionals who wish to advance in their dental practice,Offers certified
courses in Dental implants,Orthodontics,Endodontics,Cosmetic Dentistry,
Prosthetic Dentistry, Periodontics and General Dentistry.
1. Computer
20
Respiratory Response to
Physiologic Challenges
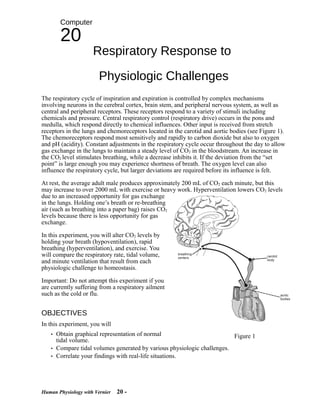
The respiratory cycle of inspiration and expiration is controlled by complex mechanisms
involving neurons in the cerebral cortex, brain stem, and peripheral nervous system, as well as
central and peripheral receptors. These receptors respond to a variety of stimuli including
chemicals and pressure. Central respiratory control (respiratory drive) occurs in the pons and
medulla, which respond directly to chemical influences. Other input is received from stretch
receptors in the lungs and chemoreceptors located in the carotid and aortic bodies (see Figure 1).
The chemoreceptors respond most sensitively and rapidly to carbon dioxide but also to oxygen
and pH (acidity). Constant adjustments in the respiratory cycle occur throughout the day to allow
gas exchange in the lungs to maintain a steady level of CO2 in the bloodstream. An increase in
the CO2 level stimulates breathing, while a decrease inhibits it. If the deviation from the “set
point” is large enough you may experience shortness of breath. The oxygen level can also
influence the respiratory cycle, but larger deviations are required before its influence is felt.
At rest, the average adult male produces approximately 200 mL of CO2 each minute, but this
may increase to over 2000 mL with exercise or heavy work. Hyperventilation lowers CO2 levels
due to an increased opportunity for gas exchange
in the lungs. Holding one’s breath or re-breathing
air (such as breathing into a paper bag) raises CO2
levels because there is less opportunity for gas
exchange.
In this experiment, you will alter CO2 levels by
holding your breath (hypoventilation), rapid
breathing (hyperventilation), and exercise. You
will compare the respiratory rate, tidal volume,
and minute ventilation that result from each
physiologic challenge to homeostasis.
Important: Do not attempt this experiment if you
are currently suffering from a respiratory ailment
such as the cold or flu.
OBJECTIVES
In this experiment, you will
• Obtain graphical representation of normal Figure 1
tidal volume.
• Compare tidal volumes generated by various physiologic challenges.
• Correlate your findings with real-life situations.
Human Physiology with Vernier 20 -
2. Computer 20
MATERIALS
computer disposable mouthpiece
Vernier computer interface disposable bacterial filter
Logger Pro nose clip
Vernier Spirometer
PROCEDURE
Part I Tidal Volume Response to Breath Holding
1. Connect the Spirometer to the Vernier computer interface. Open the file
“20 Respiratory Response” from the Human Physiology with Vernier folder.
2. Attach the larger diameter side of the disposable bacterial filter to the “Inlet” side of the
Spirometer head. Attach a disposable Spirometer mouthpiece to the other end of the bacterial
Figure 2
filter (Figure 2).
3. Hold the Spirometer in one or both hands. Brace your arm(s) against a solid surface, such as
a table, and click to zero the sensor. Note: The Spirometer must be held straight up
and down (as in Figure 2) during data collection.
4. Collect inhalation and exhalation data.
a. Put on the nose clip.
b. Click to begin data collection.
c. Taking normal breaths, begin data collection with an
inhalation and continue to breathe in and out. After
4 cycles of normal inspirations and expirations fill
your lungs as deeply as possible (maximum
inspiration) and hold your breath for 40 s.
d. After 40 s of breath holding, resume normal
breathing. Data will be collected for 120 s.
5. Click the Next Page button, , to see the volume data.
If the baseline on your volume graph has drifted, use
the Baseline Adjustment feature to bring the baseline
volumes closer to zero, as in Figure 3. Figure 3
20 - Human Physiology with Vernier
3. Respiratory Response to Physiologic Challenges
6. Select a representative peak and valley in the portion of your graph prior to the onset of
breath holding. Place the cursor on the peak and click and drag down to the valley that
follows it. Enter the Δy value displayed in the lower left corner of the graph to the nearest
0.1 L as the Before Challenge Tidal Volume in Table 1.
7. Select two adjacent peaks in the portion of your graph prior to the onset of breath holding.
Click and drag the cursor from one peak to the next. Use the Δx value displayed in the lower
left corner of the graph to calculate the respiratory rate in breaths/minute. Enter this value to
the nearest 0.1 breaths/min as the Before Challenge Respiratory Rate in Table 1.
8. Repeat Steps 6 and 7, selecting regions in the portion of your graph after normal breathing
had been resumed (between 60–80 s). Enter the values in the After Challenge section in
Table 1.
9. Calculate the Minute Ventilation values for before and after the challenge and enter the
results to the nearest 0.1 L in Table 1.
(Tidal Volume)(Respiration Rate) = Minute Ventilation
Part II Tidal Volume Response to Rapid Breathing
10. Clear the data from Part I by choosing Clear All Data from the Data menu.
11. Hold the Spirometer in one or both hands. Brace your arm(s) against a solid surface, such
as a table, and click . Note: The Spirometer must be held straight up and down (see
Figure 2) during data collection.
12. Collect inhalation and exhalation data.
a. Put on the nose plug.
b. Click to begin data collection.
c. Taking normal breaths, begin data collection with an inhalation and continue to breathe in
and out. After 4 cycles of normal inspirations and expirations, begin breathing deeply and
rapidly for 40 s. Note: If you begin to feel faint, slow your breathing rate.
d. After 40 s of rapid breathing, resume normal breathing. Data will be collected for 120 s.
13. Click the Next Page button, , to see the volume data. If the baseline on your graph has
drifted, use the Baseline Adjustment feature to bring the baseline volumes closer to zero.
14. Select a representative peak and valley in the portion of your graph prior to the onset of
rapid breathing. Place the cursor on the peak and click and drag down to the valley that
follows it. Enter the Δy value displayed in the lower left corner of the graph to the nearest 0.1
L as Before Challenge Tidal Volume in Table 1.
15. Select two adjacent peaks in the portion of your graph prior to the onset of rapid
breathing. Click and drag the cursor from one peak to the next. Use the Δx value displayed in
the lower left corner of the graph to calculate the respiratory rate in breaths/minute. Enter this
value to the nearest 0.1 breaths/min as Before Challenge Respiratory Rate in Table 1.
16. Repeat Steps 14 and 15, selecting regions in the potion of your graph after normal
breathing had been resumed (between 60–80 s). Enter the values in the After Challenge
section in Table 1.
17. Calculate the Minute Ventilation values for before and after the challenge and enter the
results to the nearest 0.1 L in Table 1. Return to Page 1 to prepare for Part III.
Part III Tidal Volume Response to Exercise
18. Clear the data from Part II by choosing Clear All Data from the Data menu.
Human Physiology with Vernier 20 -