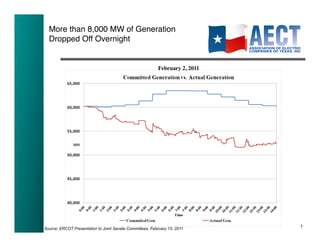
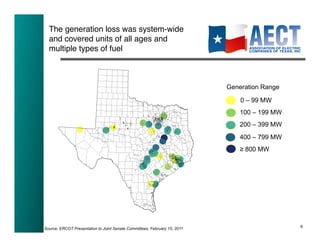
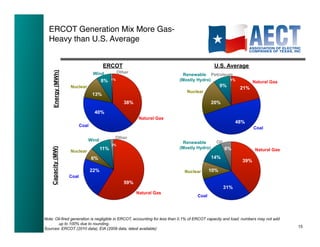
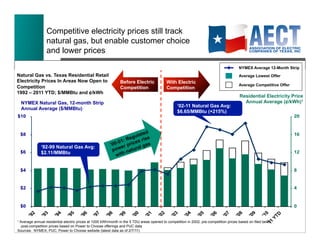
Update on the Electric
                         Industry in Texas
                                        Legislative Staff Briefing!
                                          February 18, 2011   !


Legislative advertising paid for by: John W. Fainter, Jr. • President and CEO Association of Electric Companies of Texas, Inc.
           1005 Congress, Suite 600 • Austin, TX 78701 • phone 512-474-6725 • fax 512-474-9670 • www.aect.net
AECT Principles!


 • AECT is an advocacy group composed of member companies committed to:

            - Ensuring a modern, reliable infrastructure for the supply & delivery of
              electricity.

            - Supporting efficient competitive markets that are fair to customers and
              market participants.

            - Supporting consistent and predictable oversight and regulation that will
              promote investment and ensure the stability of Texas’ electric industry.

            - Promoting an economically strong and environmentally healthy future for
              Texas, including conservation and efficient use of available resources.

 • AECT member companies remain dedicated to providing Texas customers with
   reliable service and are committed to the highest standards of integrity.

 The Association of Electric Companies of Texas, Inc. (AECT) is a trade organization of investor-
 owned electric companies in Texas. Organized in 1978, AECT provides a forum for member
 company representatives to exchange information about public policy, and to communicate with
 government officials and the public. For more information, visit www.aect.net.
                                                                                                    2
AECT Member Companies!
Within ERCOT!


                                Retail Electric Providers


                         Transmission and Distribution Utilities


                                Generation Companies


                                                               3
AECT Companies!
Outside of ERCOT!


                    SERC Reliability Corporation


                    Southwest Power Pool (SPP)


                    Western Electricity Coordinating
                           Council (WECC)


                                                       4
February Outages
               !


                   5
February 2:!
Controlled Outages Throughout Texas!


•  On February 2, a day when each major city in Texas faced
   morning temperatures below 25 degrees, 82 generation units
   either went offline or were unable to start.

•  At the height of the outages, over 8,000 MW of generation was
   unavailable.

•  ERCOT, the electric grid operator that covers most of the state,
   and each utility have procedures governing emergencies like this,
   and as the problem rapidly worsened, Texans faced a series of
   controlled outages.

•  As designed, the controlled outages prevented much more
   widespread and long-lasting blackouts.


                                                                       6!
More than 8,000 MW of Generation
  Dropped Off Overnight!


                                                           February 2, 2011	


                                                                                 7!
Source: ERCOT Presentation to Joint Senate Committees, February 15, 2011
Learning from the Power Outages!


Severe Weather Was the Cause
•  February 2-4 saw the coldest sustained temperatures in Texas in 20
   years.
•  From mechanical failures to pressure drops in natural gas supply lines to
   inoperable equipment, each reported cause of a generation outage or
   reduction in output was related to the severe cold.

Different Types of Power Plants Were Affected
•  Coal and natural gas power plants were among the units affected.

Plants Were Affected Throughout the State
•  Power plants were affected throughout the state, and the power supply
   was constrained to the Rio Grande Valley all the way to El Paso.
•  Plants affected were operated by both competitive and regulated owners.


                                                                               8!
The generation loss was system-wide
  and covered units of all ages and
  multiple types of fuel!


                                                                           Generation Range

                                                                               0 – 99 MW
                                                                               100 – 199 MW
                                                                               200 – 399 MW
                                                                               400 – 799 MW
                                                                               ≥ 800 MW


                                                                                              9!
Source: ERCOT Presentation to Joint Senate Committees, February 15, 2011
Learning from the Power Outages!


Rolling Outage Protocols Successfully Protected the Grid
•  The ERCOT and utility rolling outage protocols are designed to prevent
   the entire grid from failing.
      –  ERCOT directs the utility to shed load; the utility then select customer areas (feeders) to
         perform rolling outages.

•    The protocols attempt to minimize the impact on individual consumers
     while ensuring the electric grid remains stable, resulting in no further
     harm.

There Are Lessons to Be Learned
•  Winterization procedures, communications protocol and regulatory
   oversight of natural gas for power generation have all been discussed at
   recent hearings.


                                                                                                       10!
Prices in the Competitive Electric
        Market in ERCOT  !


                                     11
Potentially High Winter !
Electric Bills!


•  Typically, the largest portion of customers’ electric bills are
   calculated based on the price of electricity and the amount
   consumed.

•  So even though electric prices have declined substantially in
   recent years, residents may still see increased electric bills due to
   higher consumption.


                                                                           12!
Lower Bills Through!
Choice and Energy Efficiency!


•  Customers in the competitive retail electric market can visit
   www.powertochoose.org to learn more about available options.

•  All customers can contact their electric utility to find out what
   programs are available, or to find a contractor or vendor who
   participates in the state energy efficiency programs.

•  Customers can also call 2-1-1, the Texas Health and Human
   Service Commission's information and referral network to learn
   about programs available in the area.

•  Additional resources
    –  Texas Department of Housing and Community Affairs:
       www.tdhca.state.tx.us/assist_repair.htm
    –  Texas Is Hot: www.texasishot.org
    –  U.S. Department of Energy: www.energy.gov/energyefficiency
    –  Get Energy Active: www.getenergyactive.org
                                                                       13!
Natural Gas Prices Have Been Volatile
Since 2000!


•    Through 1999, natural gas prices were relatively stable, but the cost of this key
     commodity has fluctuated greatly since 2000, with three exceptionally large peaks
     during the past decade.’
•    While prices have fallen over the past 18 months, natural gas prices today are still
     double the price of gas in 1999.
•    Despite this volatility, consumers have offers available in the market lower than
     before competition began.                                                              14!
ERCOT Generation Mix More Gas-
  Heavy than U.S. Average!


                                         ERCOT                                               U.S. Average
                                                   Other
     Energy (MWh)


                                   Wind                                     Renewable Petroleum
                                        8%    1%                           (Mostly Hydro)     1%
                                                                                                                 Natural Gas
                    Nuclear                                                                     9%        21%
                                                                              Nuclear
                                  13%
                                                      38%                                   20%

                                   40%
                                                             Natural Gas
                                                                                                         48%
                           Coal
                                                                                                                 Coal

                                               Other
                              Wind                                                           Oil
                                              2%
                                                                            Renewable
                                        11%                                (Mostly Hydro)          6%
    Capacity (MW)


                    Nuclear                                                                                       Natural Gas
                                  6%                                                        14%
                                                                                                           39%

                                  22%                                        Nuclear      10%
                    Coal
                                                      59%
                                                                                                   31%
                                                            Natural Gas
                                                                                   Coal


Note: Oil-fired generation is negligible in ERCOT, accounting for less than 0.1% of ERCOT capacity and load; numbers may not add
        up to 100% due to rounding.
                                                                                                                                   15!
Sources: ERCOT (2010 data), EIA (2009 data, latest available)
Regions Outside ERCOT Part of !
Larger, Multi-State Grids!


                         (ERCOT)


                                   16!
ERCOT far More Dependent !
On Gas Than Neighboring Power!
Regions!


  % MWh from Natural Gas
  % MWh from Coal
  % MWh from Nuclear
  % MWh from Hydro
  % MWh from Other


                                 17!
Competitive electricity prices still track
                  natural gas, but enable customer choice
                  and lower prices
                                                                                                                                         NYMEX Average 12-Month Strip
Natural Gas vs. Texas Residential Retail                                                                                                 Average Lowest Offer
Electricity Prices In Areas Now Open to                        Before Electric              With Electric
                                                                                                                                         Average Competitive Offer
Competition                                                    Competition                  Competition
1992 – 2011 YTD; $/MMBtu and ¢/kWh
                                                                                                                                         Residential Electricity Price
    NYMEX Natural Gas, 12-month Strip                                                                                                      Annual Average (¢/kWh)1
                                                                                                   ‘02-11 Natural Gas Avg:
    Annual Average ($/MMBtu)
                                                                                                   $6.65/MMBtu (+215%)


              ‘92-99 Natural Gas Avg:
              $2.11/MMBtu


1Average annual residential electric prices at 1000 kWh/month in the 5 TDU areas opened to competition in 2002; pre-competition prices based on filed tariffs;
  post-competition prices based on Power to Choose offerings and PUC data                                                                                            18 !
                                                                                                                                                                       18
Sources: NYMEX, PUC, Power to Choose website (latest data as of 2/7/11)
CENTS PE R KWH


                                                                                                                           5
                                                                                                                               7
                                                                                                                                   9
                                                                                                                                         11
                                                                                                                                                                  13
                                                                                                                                                                       15
                                                                                                                                                                            17
                                                                                                                                                                                                 19
                                                                    LOWEST	
  DALLAS/FT	
  WORTH	
  PRICE	
  
                                                                              LOWEST	
  HOUSTON	
  PRICE	
  
                                                                          LOWEST	
  LEWISVILLE	
  PRICE	
  
                                                                        LOWEST	
  ABILENE	
  -­‐	
  1	
  YR	
  FIXED	
  
                                                                                LOWEST	
  ABILENE	
  PRICE	
  
                                                                                                               Idaho	
  
                                                                      LOWEST	
  CORPUS	
  CHRISTI	
  PRICE	
  
                                                                                             North	
  Dakota	
  
                                                                                                                Utah	
  
                                                                                               Washington	


                                                                                                                                              Na;onal	
  Average	
  
                                                                    LOWEST	
  DALLAS/FT	
  WORTH	
  -­‐	
  1	
  YR	
  
                                                                     LOWEST	
  LEWISVILLE	
  -­‐	
  1	
  YR	
  FIXED	
  
                                                                                   FIXED	
  
                                                                                                      Louisiana	
  
                                                                                                      Nebraska	
  
                                                                                                         Arkansas	
  
                                                                      LOWEST	
  HOUSTON	
  -­‐	
  1	
  YR	
  FIXED	
  
                                                                                                     Wyoming	
  
                                                                                                          Oregon	
  
                                                                      LOWEST	
  CORPUS	
  CHRISTI	
  -­‐	
  1	
  YR	
  
                                                                                    FIXED	
              Missouri	
  
                                                                                             South	
  Dakota	
  
                                                                                             West	
  Virginia	
  
                                                                                                       Kentucky	
  
                                                                                                    Oklahoma	
  
                                                                                                       Montana	
  
                                                                                                          Georgia	
  
                                                                                              New	
  Mexico	
  
                                                                                                           Kansas	
  
                                                                                                          Arizona	
  
                                                                                                                                                                                                                                      Every Competitive Area in ERCOT Has


                                                                                          North	
  Carolina	


Sources: Energy Information Administration, www.powertochoose.org
                                                                                                    Tennessee	
  
                                                                                                                                                                                                                                      Variable and 1-Year Lock Offers Available


                                                                                                          Indiana	
  
                                                                                                          Virginia	
  
                                                                                                        Colorado	
  
                                                                                                   Mississippi	
  
                                                                                                                Iowa	
  
                                                                                                                                                                                                                                      that are Lower than the National Average Price


                                                                                                    Minnesota	
  
                                                                                                         Alabama	
  
                                                                                          South	
  Carolina	
  
                                                                                                                Ohio	
  
                                                                                              US	
  AVERAGE	
  
                                                                                                           Florida	
  
                                                                                                                                                                                      All	
  Data	
  from	
  November	
  2010	


                                                                                                           Illinois	
  
                                                                                                       Michigan	
  
                                                                                                          Nevada	
  
                                                                                             Pennsylvania	
  
                                                                                                                                                                                 RESIDENTIAL	
  RETAIL	
  ELECTRICITY	
  PRICES	


                                                                                                    Wisconsin	
  
                                                                                   District	
  of	
  Columbia	
  
                                                                                                     Maryland	
  
                                                                                                     Delaware	
  
                                                                                          MassachuseTs	
  
                                                                                                     California	
  
                                                                                                           Maine	
  
                                                                                                         Vermont	
  
                                                                                             Rhode	
  Island	
  
                                                                                                New	
  Jersey	
  
                                                                                                           Alaska	
  
                                                                                        New	
  Hampshire	
  
                                                                                                     New	
  York	
  
                                                                                               ConnecVcut	
  
                                                                                                           Hawaii	
  
                                                       19!
Texas competitive electric prices compare
well to the rest of the nation


                          2001 State Ranking (Pre-Competition)
¢/kWh


                              November 2010 (Latest Available)
                                                                                                    State Price Rank
                Average lowest offer in                                                           Improved by 8 Spots
              Texas competitive areas in                                                            with Competition
¢/kWh


               February ‘11 – 6.7¢/kWh

                   Average lowest offer
                  November‘10 – 7.3¢/kWh


Sources: EIA average annual residential rates for 2001 & Nov. 2010 monthly data (latest available information). Average of lowest
available prices in the 5 competitive TDU areas from www.powertochoose.org (11/16/10 and 2/14/11) for residential customers using
an average of 1,000 kWh per month                                                                                                   20!
Web:     AECT.net

Blog:    AECTnet.wordpress.com

Twitter: twitter.com/AECTnet

Facebook: Association of Electric Companies of
          Texas, Inc.

Email:   info@aect.net
                                                 21!

Update on the Electric Industry in Texas

  • 1.
    Update on theElectric Industry in Texas Legislative Staff Briefing! February 18, 2011 ! Legislative advertising paid for by: John W. Fainter, Jr. • President and CEO Association of Electric Companies of Texas, Inc. 1005 Congress, Suite 600 • Austin, TX 78701 • phone 512-474-6725 • fax 512-474-9670 • www.aect.net
  • 2.
    AECT Principles! •AECT is an advocacy group composed of member companies committed to: - Ensuring a modern, reliable infrastructure for the supply & delivery of electricity. - Supporting efficient competitive markets that are fair to customers and market participants. - Supporting consistent and predictable oversight and regulation that will promote investment and ensure the stability of Texas’ electric industry. - Promoting an economically strong and environmentally healthy future for Texas, including conservation and efficient use of available resources. • AECT member companies remain dedicated to providing Texas customers with reliable service and are committed to the highest standards of integrity. The Association of Electric Companies of Texas, Inc. (AECT) is a trade organization of investor- owned electric companies in Texas. Organized in 1978, AECT provides a forum for member company representatives to exchange information about public policy, and to communicate with government officials and the public. For more information, visit www.aect.net. 2
  • 3.
    AECT Member Companies! WithinERCOT! Retail Electric Providers Transmission and Distribution Utilities Generation Companies 3
  • 4.
    AECT Companies! Outside ofERCOT! SERC Reliability Corporation Southwest Power Pool (SPP) Western Electricity Coordinating Council (WECC) 4
  • 5.
  • 6.
    February 2:! Controlled OutagesThroughout Texas! •  On February 2, a day when each major city in Texas faced morning temperatures below 25 degrees, 82 generation units either went offline or were unable to start. •  At the height of the outages, over 8,000 MW of generation was unavailable. •  ERCOT, the electric grid operator that covers most of the state, and each utility have procedures governing emergencies like this, and as the problem rapidly worsened, Texans faced a series of controlled outages. •  As designed, the controlled outages prevented much more widespread and long-lasting blackouts. 6!
  • 7.
    More than 8,000MW of Generation Dropped Off Overnight! February 2, 2011 7! Source: ERCOT Presentation to Joint Senate Committees, February 15, 2011
  • 8.
    Learning from thePower Outages! Severe Weather Was the Cause •  February 2-4 saw the coldest sustained temperatures in Texas in 20 years. •  From mechanical failures to pressure drops in natural gas supply lines to inoperable equipment, each reported cause of a generation outage or reduction in output was related to the severe cold. Different Types of Power Plants Were Affected •  Coal and natural gas power plants were among the units affected. Plants Were Affected Throughout the State •  Power plants were affected throughout the state, and the power supply was constrained to the Rio Grande Valley all the way to El Paso. •  Plants affected were operated by both competitive and regulated owners. 8!
  • 9.
    The generation losswas system-wide and covered units of all ages and multiple types of fuel! Generation Range 0 – 99 MW 100 – 199 MW 200 – 399 MW 400 – 799 MW ≥ 800 MW 9! Source: ERCOT Presentation to Joint Senate Committees, February 15, 2011
  • 10.
    Learning from thePower Outages! Rolling Outage Protocols Successfully Protected the Grid •  The ERCOT and utility rolling outage protocols are designed to prevent the entire grid from failing. –  ERCOT directs the utility to shed load; the utility then select customer areas (feeders) to perform rolling outages. •  The protocols attempt to minimize the impact on individual consumers while ensuring the electric grid remains stable, resulting in no further harm. There Are Lessons to Be Learned •  Winterization procedures, communications protocol and regulatory oversight of natural gas for power generation have all been discussed at recent hearings. 10!
  • 11.
    Prices in theCompetitive Electric Market in ERCOT ! 11
  • 12.
    Potentially High Winter! Electric Bills! •  Typically, the largest portion of customers’ electric bills are calculated based on the price of electricity and the amount consumed. •  So even though electric prices have declined substantially in recent years, residents may still see increased electric bills due to higher consumption. 12!
  • 13.
    Lower Bills Through! Choiceand Energy Efficiency! •  Customers in the competitive retail electric market can visit www.powertochoose.org to learn more about available options. •  All customers can contact their electric utility to find out what programs are available, or to find a contractor or vendor who participates in the state energy efficiency programs. •  Customers can also call 2-1-1, the Texas Health and Human Service Commission's information and referral network to learn about programs available in the area. •  Additional resources –  Texas Department of Housing and Community Affairs: www.tdhca.state.tx.us/assist_repair.htm –  Texas Is Hot: www.texasishot.org –  U.S. Department of Energy: www.energy.gov/energyefficiency –  Get Energy Active: www.getenergyactive.org 13!
  • 14.
    Natural Gas PricesHave Been Volatile Since 2000! •  Through 1999, natural gas prices were relatively stable, but the cost of this key commodity has fluctuated greatly since 2000, with three exceptionally large peaks during the past decade.’ •  While prices have fallen over the past 18 months, natural gas prices today are still double the price of gas in 1999. •  Despite this volatility, consumers have offers available in the market lower than before competition began. 14!
  • 15.
    ERCOT Generation MixMore Gas- Heavy than U.S. Average! ERCOT U.S. Average Other Energy (MWh) Wind Renewable Petroleum 8% 1% (Mostly Hydro) 1% Natural Gas Nuclear 9% 21% Nuclear 13% 38% 20% 40% Natural Gas 48% Coal Coal Other Wind Oil 2% Renewable 11% (Mostly Hydro) 6% Capacity (MW) Nuclear Natural Gas 6% 14% 39% 22% Nuclear 10% Coal 59% 31% Natural Gas Coal Note: Oil-fired generation is negligible in ERCOT, accounting for less than 0.1% of ERCOT capacity and load; numbers may not add up to 100% due to rounding. 15! Sources: ERCOT (2010 data), EIA (2009 data, latest available)
  • 16.
    Regions Outside ERCOTPart of ! Larger, Multi-State Grids! (ERCOT) 16!
  • 17.
    ERCOT far MoreDependent ! On Gas Than Neighboring Power! Regions! % MWh from Natural Gas % MWh from Coal % MWh from Nuclear % MWh from Hydro % MWh from Other 17!
  • 18.
    Competitive electricity pricesstill track natural gas, but enable customer choice and lower prices NYMEX Average 12-Month Strip Natural Gas vs. Texas Residential Retail Average Lowest Offer Electricity Prices In Areas Now Open to Before Electric With Electric Average Competitive Offer Competition Competition Competition 1992 – 2011 YTD; $/MMBtu and ¢/kWh Residential Electricity Price NYMEX Natural Gas, 12-month Strip Annual Average (¢/kWh)1 ‘02-11 Natural Gas Avg: Annual Average ($/MMBtu) $6.65/MMBtu (+215%) ‘92-99 Natural Gas Avg: $2.11/MMBtu 1Average annual residential electric prices at 1000 kWh/month in the 5 TDU areas opened to competition in 2002; pre-competition prices based on filed tariffs; post-competition prices based on Power to Choose offerings and PUC data 18 ! 18 Sources: NYMEX, PUC, Power to Choose website (latest data as of 2/7/11)
  • 19.
    CENTS PE RKWH 5 7 9 11 13 15 17 19 LOWEST  DALLAS/FT  WORTH  PRICE   LOWEST  HOUSTON  PRICE   LOWEST  LEWISVILLE  PRICE   LOWEST  ABILENE  -­‐  1  YR  FIXED   LOWEST  ABILENE  PRICE   Idaho   LOWEST  CORPUS  CHRISTI  PRICE   North  Dakota   Utah   Washington   Na;onal  Average   LOWEST  DALLAS/FT  WORTH  -­‐  1  YR   LOWEST  LEWISVILLE  -­‐  1  YR  FIXED   FIXED   Louisiana   Nebraska   Arkansas   LOWEST  HOUSTON  -­‐  1  YR  FIXED   Wyoming   Oregon   LOWEST  CORPUS  CHRISTI  -­‐  1  YR   FIXED   Missouri   South  Dakota   West  Virginia   Kentucky   Oklahoma   Montana   Georgia   New  Mexico   Kansas   Arizona   Every Competitive Area in ERCOT Has North  Carolina   Sources: Energy Information Administration, www.powertochoose.org Tennessee   Variable and 1-Year Lock Offers Available Indiana   Virginia   Colorado   Mississippi   Iowa   that are Lower than the National Average Price Minnesota   Alabama   South  Carolina   Ohio   US  AVERAGE   Florida   All  Data  from  November  2010   Illinois   Michigan   Nevada   Pennsylvania   RESIDENTIAL  RETAIL  ELECTRICITY  PRICES   Wisconsin   District  of  Columbia   Maryland   Delaware   MassachuseTs   California   Maine   Vermont   Rhode  Island   New  Jersey   Alaska   New  Hampshire   New  York   ConnecVcut   Hawaii   19!
  • 20.
    Texas competitive electricprices compare well to the rest of the nation 2001 State Ranking (Pre-Competition) ¢/kWh November 2010 (Latest Available) State Price Rank Average lowest offer in Improved by 8 Spots Texas competitive areas in with Competition ¢/kWh February ‘11 – 6.7¢/kWh Average lowest offer November‘10 – 7.3¢/kWh Sources: EIA average annual residential rates for 2001 & Nov. 2010 monthly data (latest available information). Average of lowest available prices in the 5 competitive TDU areas from www.powertochoose.org (11/16/10 and 2/14/11) for residential customers using an average of 1,000 kWh per month 20!
  • 21.
    Web: AECT.net Blog: AECTnet.wordpress.com Twitter: twitter.com/AECTnet Facebook: Association of Electric Companies of Texas, Inc. Email: info@aect.net 21!