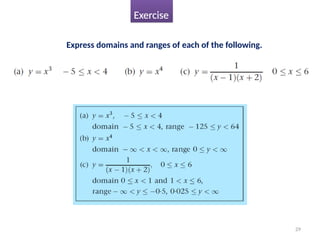
6
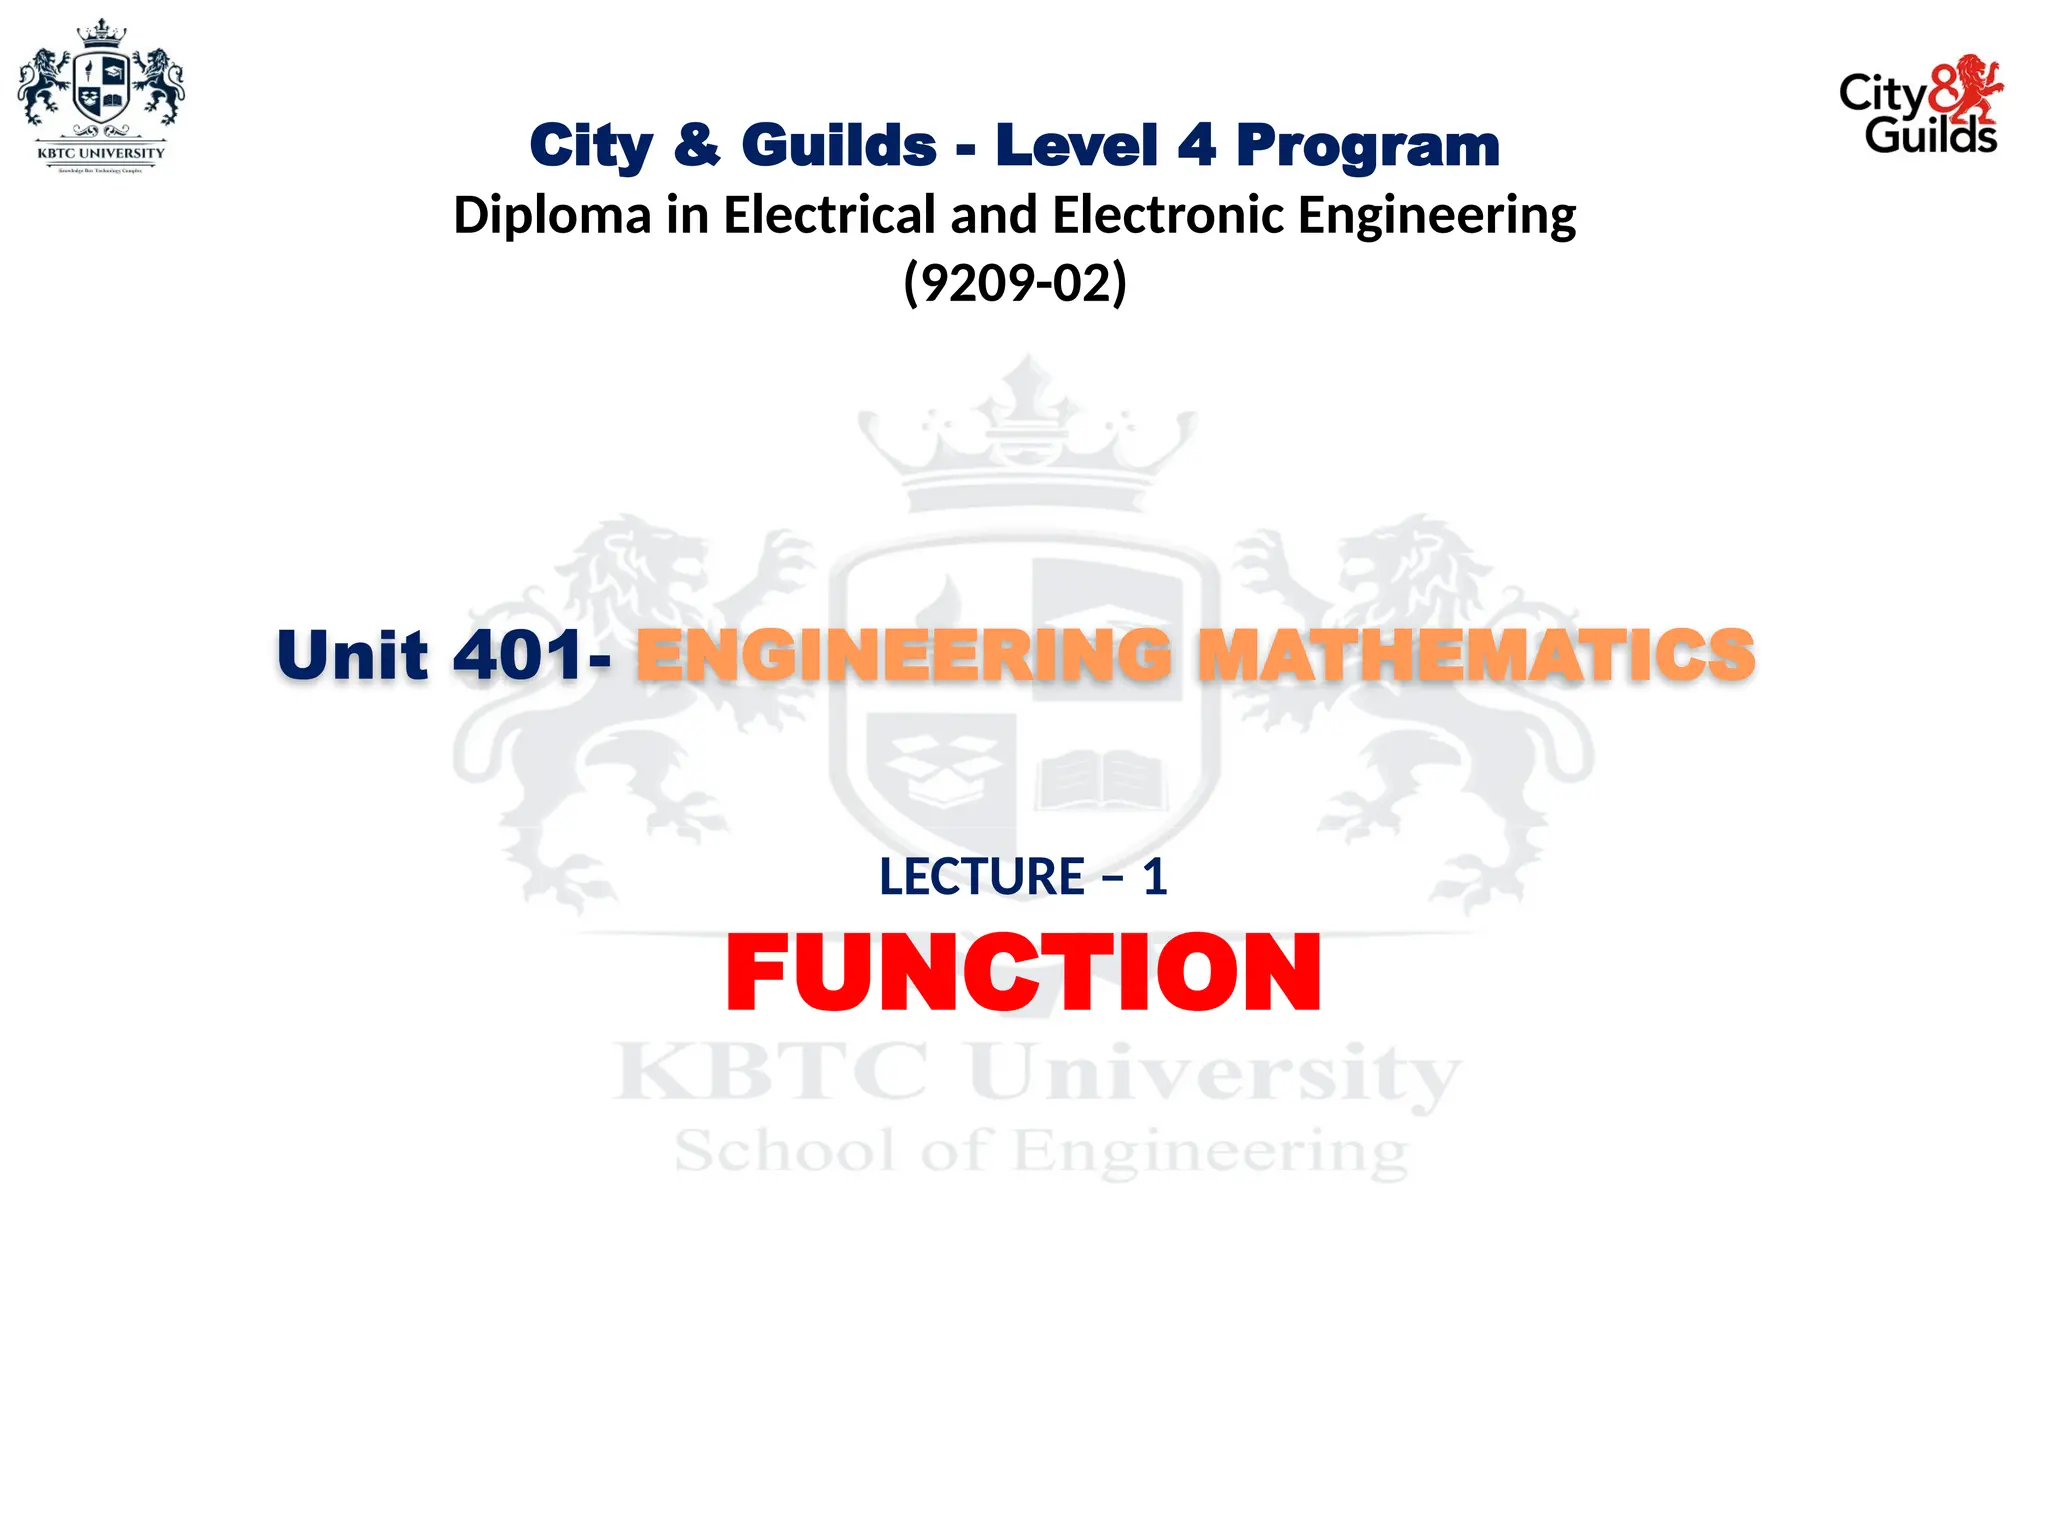
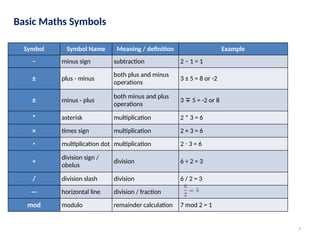
Basic Maths Symbols
SymbolSymbol Name Meaning / definition Example
= equals sign equality 5 = 2+3 (5 is equal to 2+3)
≠ not equal sign inequality 5 ≠ 4 (5 is not equal to 4)
≈
approximately
equal
approximation
sin(0.01) ≈ 0.01,
x ≈ y means x is approximately equal to y
> strict inequality greater than 5 > 4 (5 is greater than 4)
< strict inequality less than 4 < 5 (4 is less than 5)
≥ inequality
greater than or equal
to
5 ≥ 4,
x ≥ y means x is greater than or equal
to y
≤ inequality less than or equal to
4 ≤ 5, (x ≤ y means x is less than or equal
to y)
( ) parentheses
calculate expression
inside first
2 × (3+5) = 16
[ ] brackets
calculate expression
inside first
[(1+2)×(1+5)] = 18
+ plus sign addition 1 + 1 = 2
7.
7
Basic Maths Symbols
SymbolSymbol Name Meaning / definition Example
− minus sign subtraction 2 − 1 = 1
± plus - minus
both plus and minus
operations
3 ± 5 = 8 or -2
± minus - plus
both minus and plus
operations
3 5 = -2 or 8
∓
* asterisk multiplication 2 * 3 = 6
× times sign multiplication 2 × 3 = 6
⋅ multiplication dot multiplication 2 3 = 6
⋅
÷
division sign /
obelus
division 6 ÷ 2 = 3
/ division slash division 6 / 2 = 3
— horizontal line division / fraction
mod modulo remainder calculation 7 mod 2 = 1
9
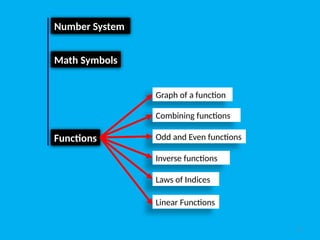
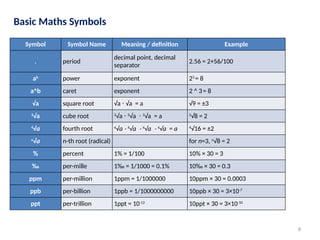
Algebra Symbols
Symbol SymbolName Meaning / definition Example
x x variable unknown value to find when 2x = 4, then x = 2
≡ equivalence identical to
≜ equal by definition equal by definition
:= equal by definition equal by definition
~ approximately equal weak approximation 11 ~ 10
≈ approximately equal approximation sin(0.01) ≈ 0.01
{ } braces set
x! exclamation mark factorial 4! = 1*2*3*4 = 24
| x | vertical bars absolute value | -5 | = 5
f (x) function of x maps values of x to f(x) f (x) = 3x+5
(f ∘ g) function composition (f ∘ g) (x) = f (g(x))
f (x)=3x,g(x)=x-1
⇒(f ∘ g)(x)=3(x-1)
10.
10
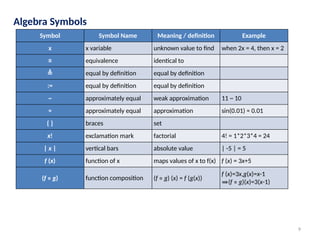
Algebra Symbols
Symbol SymbolName Meaning / definition Example
(a,b) open interval (a,b) = {x | a < x < b} x∈ (2,6)
[a,b] closed interval [a,b] = {x | a ≤ x ≤ b} x ∈ [2,6]
∆ delta change / difference ∆t = t1 - t0
∆ discriminant Δ = b2
- 4ac
∑ sigma
summation - sum of all
values in range of series
∑ xi= x1+x2+...+xn
∑∑ sigma double summation
∏ capital pi
product - product of all
values in range of series
∏ xi=x1 x
∙ 2 ... x
∙ ∙ n
e e constant / Euler's number e = 2.718281828... e = lim (1+1/x)x
, x→∞
γ Euler-Mascheroni constant γ = 0.5772156649...
π pi constant
π = 3.141592654... is the
ratio between the
circumference and
diameter of a circle
c = π⋅d = 2⋅π⋅r
11.
11
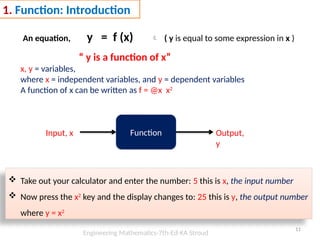
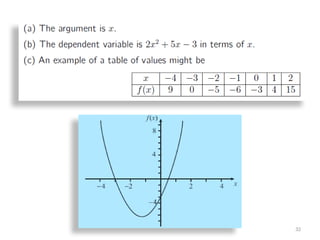
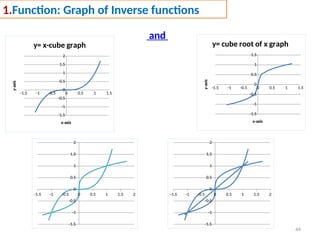
1. Function: Introduction
Anequation, y = f (x) ( y is equal to some expression in x )
“ y is a function of x”
x, y = variables,
where x = independent variables, and y = dependent variables
A function of x can be written as f = @x x2
Function
Input, x Output,
y
Take out your calculator and enter the number: 5 this is x, the input number
Now press the x2
key and the display changes to: 25 this is y, the output number
where y = x2
Engineering Mathematics-7th-Ed-KA Stroud
12.
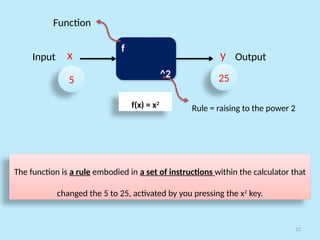
12
f
^2
x y
5 25
InputOutput
Function
Rule = raising to the power 2
The function is a rule embodied in a set of instructions within the calculator that
changed the 5 to 25, activated by you pressing the x2
key.
f(x) = x2
13.
13
Key Point
Afunction is a rule (a set of instruction) that maps a number to
another unique number.
The input to the function is called the independent variable, and is
also called the argument of the function.
The output of the function is called the dependent variable.
14.
14
Exercise
Use diagrams anddescribe the functions appropriate to each of
the following equations:
(a) y = 1/x (b) y = x – 6 (c) y = 4x (d) y = Sin x
Graph a function
“Using Microsoft Excel Spreadsheet”
“Using Window Calculator - Graphing”
15.
15
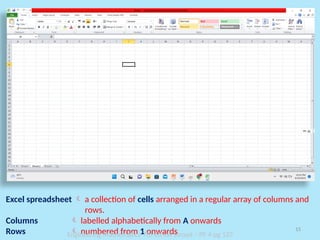
Excel spreadsheet a collection of cells arranged in a regular array of columns and
rows.
Columns labelled alphabetically from A onwards
Rows numbered from 1 onwards
Engineering Mathematics-7th-Ed-KA Stroud – PF 4-pg 137
16.
16
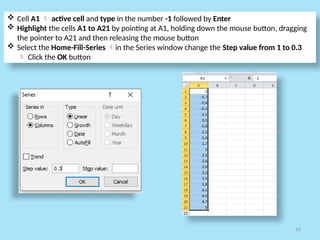
Cell A1 active cell and type in the number -1 followed by Enter
Highlight the cells A1 to A21 by pointing at A1, holding down the mouse button, dragging
the pointer to A21 and then releasing the mouse button
Select the Home-Fill-Series in the Series window change the Step value from 1 to 0.3
Click the OK button
17.
17
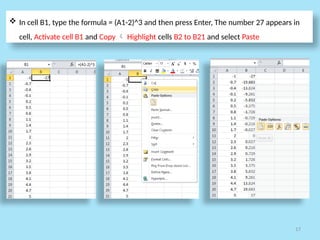
In cellB1, type the formula = (A1-2)^3 and then press Enter, The number 27 appears in
cell, Activate cell B1 and Copy Highlight cells B2 to B21 and select Paste
18.
18
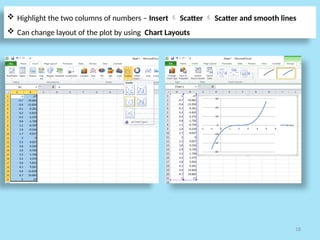
Highlight thetwo columns of numbers – Insert Scatter Scatter and smooth lines
Can change layout of the plot by using Chart Layouts
19.
19
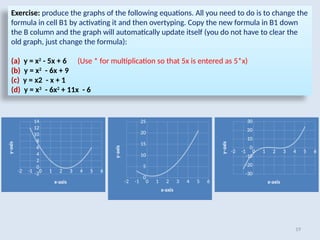
Exercise: produce thegraphs of the following equations. All you need to do is to change the
formula in cell B1 by activating it and then overtyping. Copy the new formula in B1 down
the B column and the graph will automatically update itself (you do not have to clear the
old graph, just change the formula):
(a) y = x2
- 5x + 6 (Use * for multiplication so that 5x is entered as 5*x)
(b) y = x2
- 6x + 9
(c) y = x2 - x + 1
(d) y = x3
- 6x2
+ 11x - 6
-2 -1 0 1 2 3 4 5 6
-2
0
2
4
6
8
10
12
14
x-axis
y-axis
-2 -1 0 1 2 3 4 5 6
0
5
10
15
20
25
x-axis
y-axis
-2 -1 0 1 2 3 4 5 6
-30
-20
-10
0
10
20
30
x-axis
y-axis
20.
20
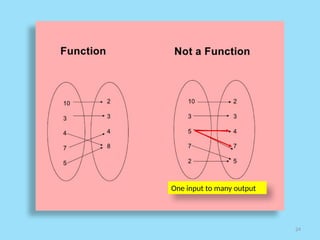
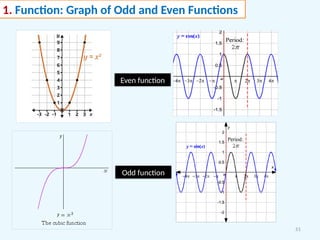
1.Function: Functions arerules but not all rules are functions
y = 2x + 3 (a linear/straight line function)
where, rule (or) instruction “multiply the value of x by 2 and add 3”
Different value of x Different value of y
One input only one value of y (singled value ) thus one to one function
Another equation y =
But y = is the same as y =
where, rule (or) instruction “take the positive and negative square roots of
the value x”
One value of x two values of y (when x > 0)
One to many the rule is not a function
* Input numbers are all real numbers
y = How to become a function change its rule “take the positive or negative
square roots of the value of x”
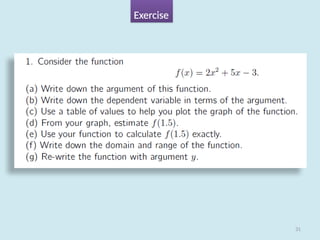
21.
21
Graph of y=
[each value of x two values of y] Not a function
x > 0 y
1 +1, -1
2 ± 1.4
3 ± 1.7
4 ± 2
5 ± 2.2
6 ± 2.4
7 ± 2.6
8 ± 2.8
9 ± 3
25
Exercise
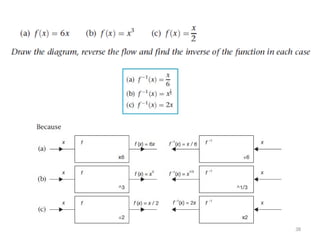
Which of thefollowing equations express rules that are functions?
(a) y = 5x2
+ 2x-1/4
(b) y = 7x1/3
- 3x-1
(a) y = 5x2
+ 2x-1/4
does not express a function because to each value of x (x > 0)
there are two values of x-1/4
, positive and negative because x-1/4
= (x-1/2
)1/2.
= ±
Indeed, any even root produces two values.
(b) y = 7x1/3
- 3x-1
does express a function because to each value of x (x ≠ 0) there is
just one value of y.
28
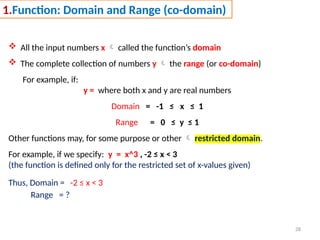
1.Function: Domain andRange (co-domain)
All the input numbers x called the function’s domain
The complete collection of numbers y the range (or co-domain)
For example, if:
y = where both x and y are real numbers
Domain = -1 ≤ x ≤ 1
Range = 0 ≤ y ≤ 1
Other functions may, for some purpose or other restricted domain.
For example, if we specify: y = x^3 , -2 ≤ x < 3
(the function is defined only for the restricted set of x-values given)
Thus, Domain = -2 ≤ x < 3
Range = ?
34
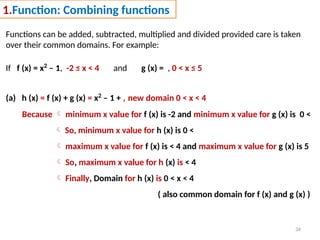
1.Function: Combining functions
Functionscan be added, subtracted, multiplied and divided provided care is taken
over their common domains. For example:
If f (x) = x2
– 1, -2 ≤ x < 4 and g (x) = , 0 < x ≤ 5
(a) h (x) = f (x) + g (x) = x2
– 1 + , new domain 0 < x < 4
Because minimum x value for f (x) is -2 and minimum x value for g (x) is 0 <
So, minimum x value for h (x) is 0 <
maximum x value for f (x) is < 4 and maximum x value for g (x) is 5
So, maximum x value for h (x) is < 4
Finally, Domain for h (x) is 0 < x < 4
( also common domain for f (x) and g (x) )
35.
35
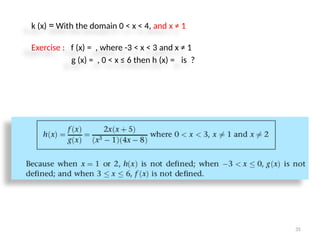
k (x) =With the domain 0 < x < 4, and x ≠ 1
Exercise : f (x) = , where -3 < x < 3 and x ≠ 1
g (x) = , 0 < x ≤ 6 then h (x) = is ?
36.
36
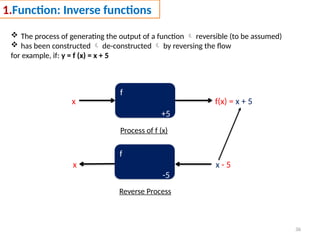
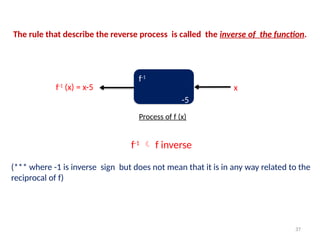
1.Function: Inverse functions
The process of generating the output of a function reversible (to be assumed)
has been constructed de-constructed by reversing the flow
for example, if: y = f (x) = x + 5
f
+5
x f(x) = x + 5
f
-5
x x - 5
Process of f (x)
Reverse Process
37.
37
f-1
-5
f-1
(x) = x-5x
Process of f (x)
The rule that describe the reverse process is called the inverse of the function.
f-1
f inverse
(*** where -1 is inverse sign but does not mean that it is in any way related to the
reciprocal of f)
39
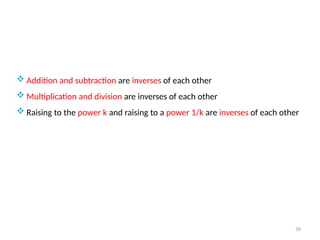
Addition andsubtraction are inverses of each other
Multiplication and division are inverses of each other
Raising to the power k and raising to a power 1/k are inverses of each other
40.
40
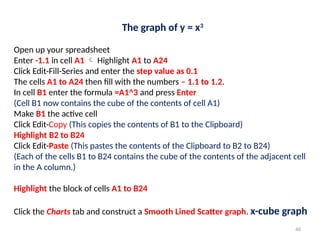
The graph ofy = x3
Open up your spreadsheet
Enter -1.1 in cell A1 Highlight A1 to A24
Click Edit-Fill-Series and enter the step value as 0.1
The cells A1 to A24 then fill with the numbers – 1.1 to 1.2.
In cell B1 enter the formula =A1^3 and press Enter
(Cell B1 now contains the cube of the contents of cell A1)
Make B1 the active cell
Click Edit-Copy (This copies the contents of B1 to the Clipboard)
Highlight B2 to B24
Click Edit-Paste (This pastes the contents of the Clipboard to B2 to B24)
(Each of the cells B1 to B24 contains the cube of the contents of the adjacent cell
in the A column.)
Highlight the block of cells A1 to B24
Click the Charts tab and construct a Smooth Lined Scatter graph. x-cube graph
41.
41
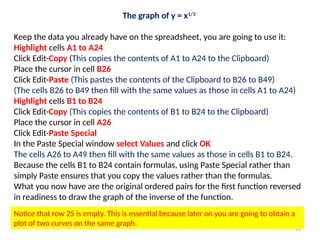
The graph ofy = x1/3
Keep the data you already have on the spreadsheet, you are going to use it:
Highlight cells A1 to A24
Click Edit-Copy (This copies the contents of A1 to A24 to the Clipboard)
Place the cursor in cell B26
Click Edit-Paste (This pastes the contents of the Clipboard to B26 to B49)
(The cells B26 to B49 then fill with the same values as those in cells A1 to A24)
Highlight cells B1 to B24
Click Edit-Copy (This copies the contents of B1 to B24 to the Clipboard)
Place the cursor in cell A26
Click Edit-Paste Special
In the Paste Special window select Values and click OK
The cells A26 to A49 then fill with the same values as those in cells B1 to B24.
Because the cells B1 to B24 contain formulas, using Paste Special rather than
simply Paste ensures that you copy the values rather than the formulas.
What you now have are the original ordered pairs for the first function reversed
in readiness to draw the graph of the inverse of the function.
Notice that row 25 is empty. This is essential because later on you are going to obtain a
plot of two curves on the same graph.
42.
42
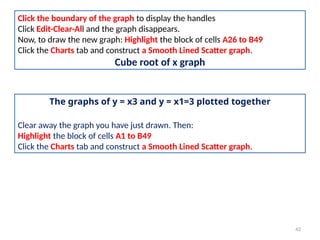
Click the boundaryof the graph to display the handles
Click Edit-Clear-All and the graph disappears.
Now, to draw the new graph: Highlight the block of cells A26 to B49
Click the Charts tab and construct a Smooth Lined Scatter graph.
Cube root of x graph
The graphs of y = x3 and y = x1=3 plotted together
Clear away the graph you have just drawn. Then:
Highlight the block of cells A1 to B49
Click the Charts tab and construct a Smooth Lined Scatter graph.
43.
43
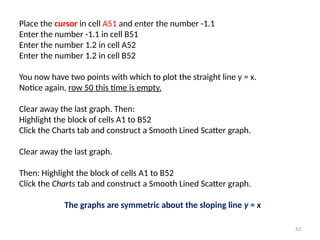
Place the cursorin cell A51 and enter the number -1.1
Enter the number -1.1 in cell B51
Enter the number 1.2 in cell A52
Enter the number 1.2 in cell B52
You now have two points with which to plot the straight line y = x.
Notice again, row 50 this time is empty.
Clear away the last graph. Then:
Highlight the block of cells A1 to B52
Click the Charts tab and construct a Smooth Lined Scatter graph.
Clear away the last graph.
Then: Highlight the block of cells A1 to B52
Click the Charts tab and construct a Smooth Lined Scatter graph.
The graphs are symmetric about the sloping line y = x
45
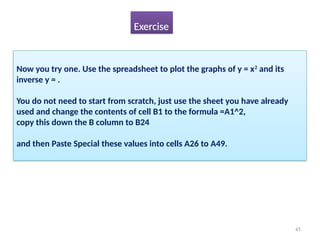
Now you tryone. Use the spreadsheet to plot the graphs of y = x2
and its
inverse y = .
You do not need to start from scratch, just use the sheet you have already
used and change the contents of cell B1 to the formula =A1^2,
copy this down the B column to B24
and then Paste Special these values into cells A26 to A49.
Exercise
46.
46
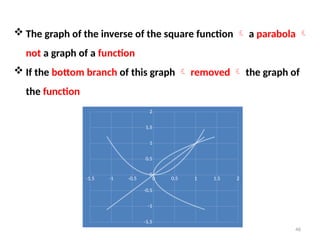
The graphof the inverse of the square function a parabola
not a graph of a function
If the bottom branch of this graph removed the graph of
the function
-1.5 -1 -0.5 0 0.5 1 1.5 2
-1.5
-1
-0.5
0
0.5
1
1.5
2
47.
47
Review Summary
1. Afunction is a rule expressed in the form y = f (x) with the proviso that for
each value of x there is a unique value of y.
2. The collection of permitted input values to a function is called the domain
of the function and the collection of corresponding output values is called
the range.
3. The inverse of a function is a rule that associates range values to domain
values of the original function.
50
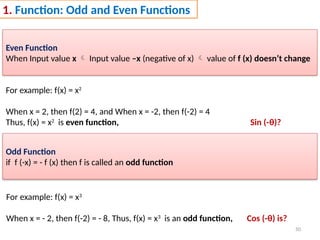
1. Function: Oddand Even Functions
Even Function
When Input value x Input value –x (negative of x) value of f (x) doesn’t change
For example: f(x) = x2
When x = 2, then f(2) = 4, and When x = -2, then f(-2) = 4
Thus, f(x) = x2
is even function, Sin (-θ)?
Odd Function
if f (-x) = - f (x) then f is called an odd function
For example: f(x) = x3
When x = - 2, then f(-2) = - 8, Thus, f(x) = x3
is an odd function, Cos (-θ) is?
52
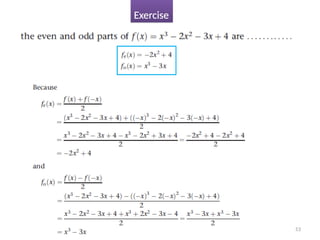
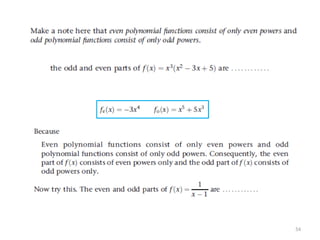
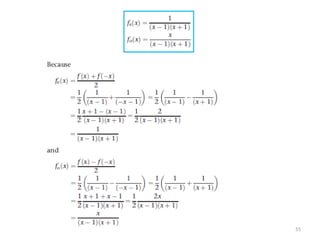
1. Function: Oddand Even Parts
Not every function is either even or odd
Can be written as the sum of an even part and an odd part
(x) = is even part of f(x) and
(x) = is odd part of f(x)
56
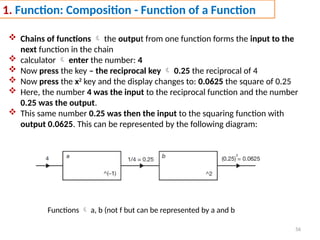
1. Function: Composition- Function of a Function
Chains of functions the output from one function forms the input to the
next function in the chain
calculator enter the number: 4
Now press the key – the reciprocal key 0.25 the reciprocal of 4
Now press the x2
key and the display changes to: 0.0625 the square of 0.25
Here, the number 4 was the input to the reciprocal function and the number
0.25 was the output.
This same number 0.25 was then the input to the squaring function with
output 0.0625. This can be represented by the following diagram:
Functions a, b (not f but can be represented by a and b
57.
57
the totalprocessing by f 4 was input and 0.0625 was output
So the function f is composed of the two functions a and b
where a(x) = , f(x) = ( )2
It is said that f is the composition of a and b, written as: f = b o a
and read as b of a. (1/x is input number for b(x))
Notice a and b the reverse order (given in the diagram)
f (x) = b o a(x) f(x) = b [a(x)] (f of x equals b of a of x)
f = a function of a function
58.
58
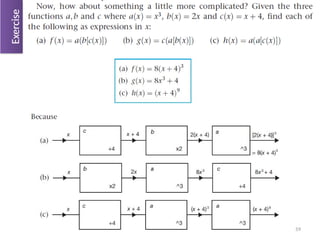
Given that a(x)= x + 3, b(x) = 4x find the functions f and g where:
(a) f (x) = b[a(x)]
(b) g(x) = a[b(x)]
Example
67
Linear Functions andtheir Gradient
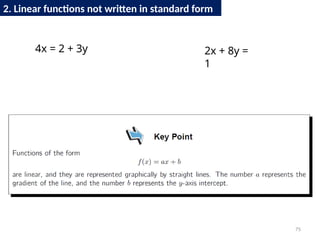
1. Linear Functions
2. Linear functions not written in standard form
68.
68
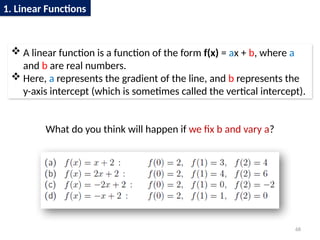
A linearfunction is a function of the form f(x) = ax + b, where a
and b are real numbers.
Here, a represents the gradient of the line, and b represents the
y-axis intercept (which is sometimes called the vertical intercept).
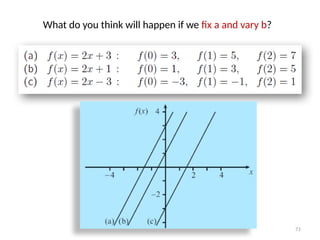
What do you think will happen if we fix b and vary a?
1. Linear Functions
70
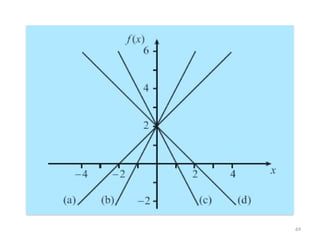
You canclearly see from our diagram that the graphs of all of
the functions cross the y-axis at y = 2.
This is because b is fixed as 2, and b represents the y-axis
intercept.
You can see that if a > 0 then the straight line goes up as x
increases, and the bigger a is the faster the line goes up.
Similarly, if a < 0 then the line goes down as x increases, and the
bigger a is in absolute terms, the faster the line goes down.
72
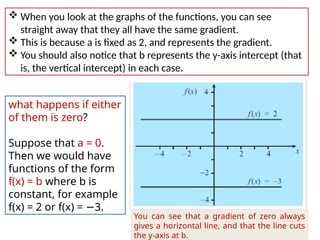
When youlook at the graphs of the functions, you can see
straight away that they all have the same gradient.
This is because a is fixed as 2, and represents the gradient.
You should also notice that b represents the y-axis intercept (that
is, the vertical intercept) in each case.
what happens if either
of them is zero?
Suppose that a = 0.
Then we would have
functions of the form
f(x) = b where b is
constant, for example
f(x) = 2 or f(x) = −3.
You can see that a gradient of zero always
gives a horizontal line, and that the line cuts
the y-axis at b.
73.
73
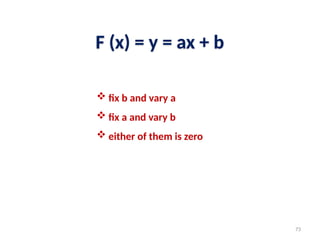
fix band vary a
fix a and vary b
either of them is zero
F (x) = y = ax + b
74.
74
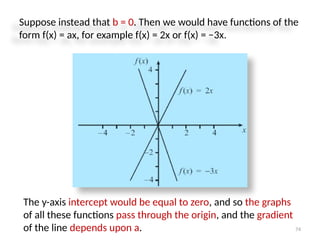
Suppose instead thatb = 0. Then we would have functions of the
form f(x) = ax, for example f(x) = 2x or f(x) = −3x.
The y-axis intercept would be equal to zero, and so the graphs
of all these functions pass through the origin, and the gradient
of the line depends upon a.
77
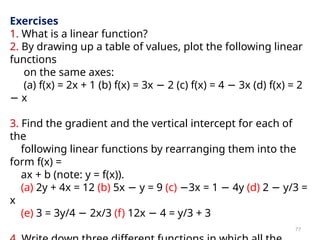
Exercises
1. What isa linear function?
2. By drawing up a table of values, plot the following linear
functions
on the same axes:
(a) f(x) = 2x + 1 (b) f(x) = 3x − 2 (c) f(x) = 4 − 3x (d) f(x) = 2
− x
3. Find the gradient and the vertical intercept for each of
the
following linear functions by rearranging them into the
form f(x) =
ax + b (note: y = f(x)).
(a) 2y + 4x = 12 (b) 5x − y = 9 (c) −3x = 1 − 4y (d) 2 − y/3 =
x
(e) 3 = 3y/4 − 2x/3 (f) 12x − 4 = y/3 + 3

![6
Basic Maths Symbols
Symbol Symbol Name Meaning / definition Example
= equals sign equality 5 = 2+3 (5 is equal to 2+3)
≠ not equal sign inequality 5 ≠ 4 (5 is not equal to 4)
≈
approximately
equal
approximation
sin(0.01) ≈ 0.01,
x ≈ y means x is approximately equal to y
> strict inequality greater than 5 > 4 (5 is greater than 4)
< strict inequality less than 4 < 5 (4 is less than 5)
≥ inequality
greater than or equal
to
5 ≥ 4,
x ≥ y means x is greater than or equal
to y
≤ inequality less than or equal to
4 ≤ 5, (x ≤ y means x is less than or equal
to y)
( ) parentheses
calculate expression
inside first
2 × (3+5) = 16
[ ] brackets
calculate expression
inside first
[(1+2)×(1+5)] = 18
+ plus sign addition 1 + 1 = 2](https://image.slidesharecdn.com/439appliedmathematicsforcivilengineeringlecture1function-250407070023-7fe13201/85/439_Applied_Mathematics_for_Civil_Engineering_LECTURE_1-Function-pptx-6-320.jpg)
![10
Algebra Symbols
Symbol Symbol Name Meaning / definition Example
(a,b) open interval (a,b) = {x | a < x < b} x∈ (2,6)
[a,b] closed interval [a,b] = {x | a ≤ x ≤ b} x ∈ [2,6]
∆ delta change / difference ∆t = t1 - t0
∆ discriminant Δ = b2
- 4ac
∑ sigma
summation - sum of all
values in range of series
∑ xi= x1+x2+...+xn
∑∑ sigma double summation
∏ capital pi
product - product of all
values in range of series
∏ xi=x1 x
∙ 2 ... x
∙ ∙ n
e e constant / Euler's number e = 2.718281828... e = lim (1+1/x)x
, x→∞
γ Euler-Mascheroni constant γ = 0.5772156649...
π pi constant
π = 3.141592654... is the
ratio between the
circumference and
diameter of a circle
c = π⋅d = 2⋅π⋅r](https://image.slidesharecdn.com/439appliedmathematicsforcivilengineeringlecture1function-250407070023-7fe13201/85/439_Applied_Mathematics_for_Civil_Engineering_LECTURE_1-Function-pptx-10-320.jpg)
![21
Graph of y =
[each value of x two values of y] Not a function
x > 0 y
1 +1, -1
2 ± 1.4
3 ± 1.7
4 ± 2
5 ± 2.2
6 ± 2.4
7 ± 2.6
8 ± 2.8
9 ± 3](https://image.slidesharecdn.com/439appliedmathematicsforcivilengineeringlecture1function-250407070023-7fe13201/85/439_Applied_Mathematics_for_Civil_Engineering_LECTURE_1-Function-pptx-21-320.jpg)

![57
the total processing by f 4 was input and 0.0625 was output
So the function f is composed of the two functions a and b
where a(x) = , f(x) = ( )2
It is said that f is the composition of a and b, written as: f = b o a
and read as b of a. (1/x is input number for b(x))
Notice a and b the reverse order (given in the diagram)
f (x) = b o a(x) f(x) = b [a(x)] (f of x equals b of a of x)
f = a function of a function](https://image.slidesharecdn.com/439appliedmathematicsforcivilengineeringlecture1function-250407070023-7fe13201/85/439_Applied_Mathematics_for_Civil_Engineering_LECTURE_1-Function-pptx-57-320.jpg)
![58
Given that a(x) = x + 3, b(x) = 4x find the functions f and g where:
(a) f (x) = b[a(x)]
(b) g(x) = a[b(x)]
Example](https://image.slidesharecdn.com/439appliedmathematicsforcivilengineeringlecture1function-250407070023-7fe13201/85/439_Applied_Mathematics_for_Civil_Engineering_LECTURE_1-Function-pptx-58-320.jpg)
![60
1. Function: Composition - Decomposition
Decomposition of f (x) = 6x - 4
Thus, a(x) = 6x , b(x) = x – 4 b[a(x)] = 6x - 4](https://image.slidesharecdn.com/439appliedmathematicsforcivilengineeringlecture1function-250407070023-7fe13201/85/439_Applied_Mathematics_for_Civil_Engineering_LECTURE_1-Function-pptx-60-320.jpg)
![62
1. Function: Inverse of Composition
f (x) = (3x – 5)^ (1/3)
Decomposing multiply by 3, minus 5, ^(1/3)
3x, x-5, x^(1/3)
a(x) b(x) c(x) c(b[a(x)]) =(3x – 5)^ (1/3)
a-1
= x/3 b-1
= x+5 c-1
= x^3](https://image.slidesharecdn.com/439appliedmathematicsforcivilengineeringlecture1function-250407070023-7fe13201/85/439_Applied_Mathematics_for_Civil_Engineering_LECTURE_1-Function-pptx-62-320.jpg)