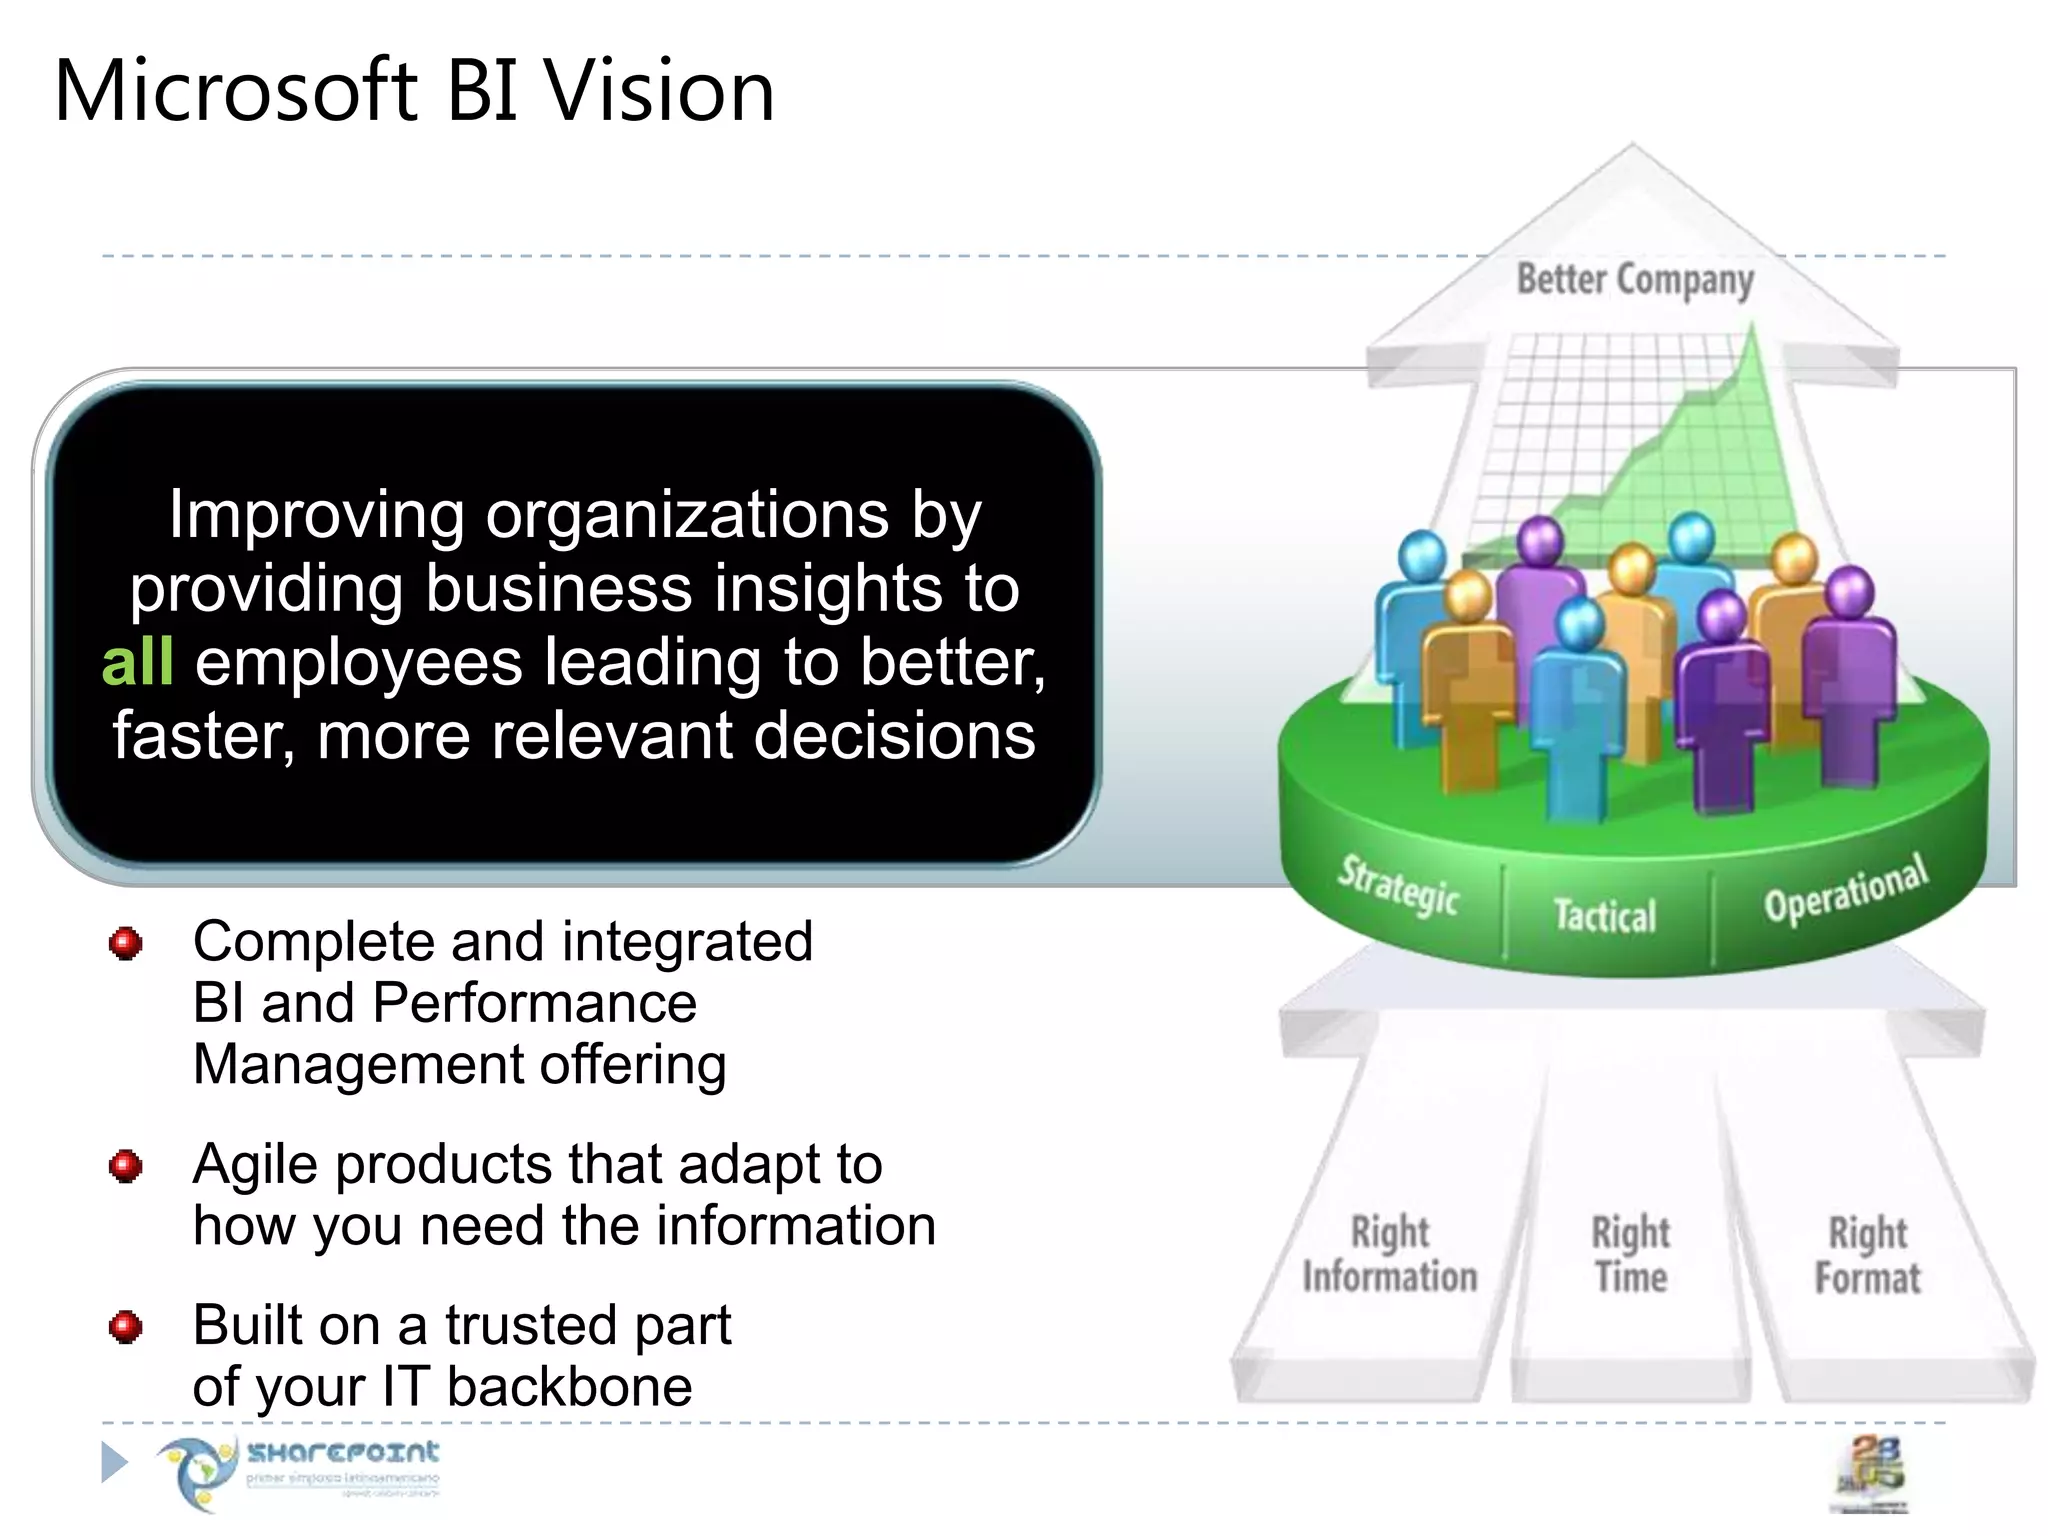
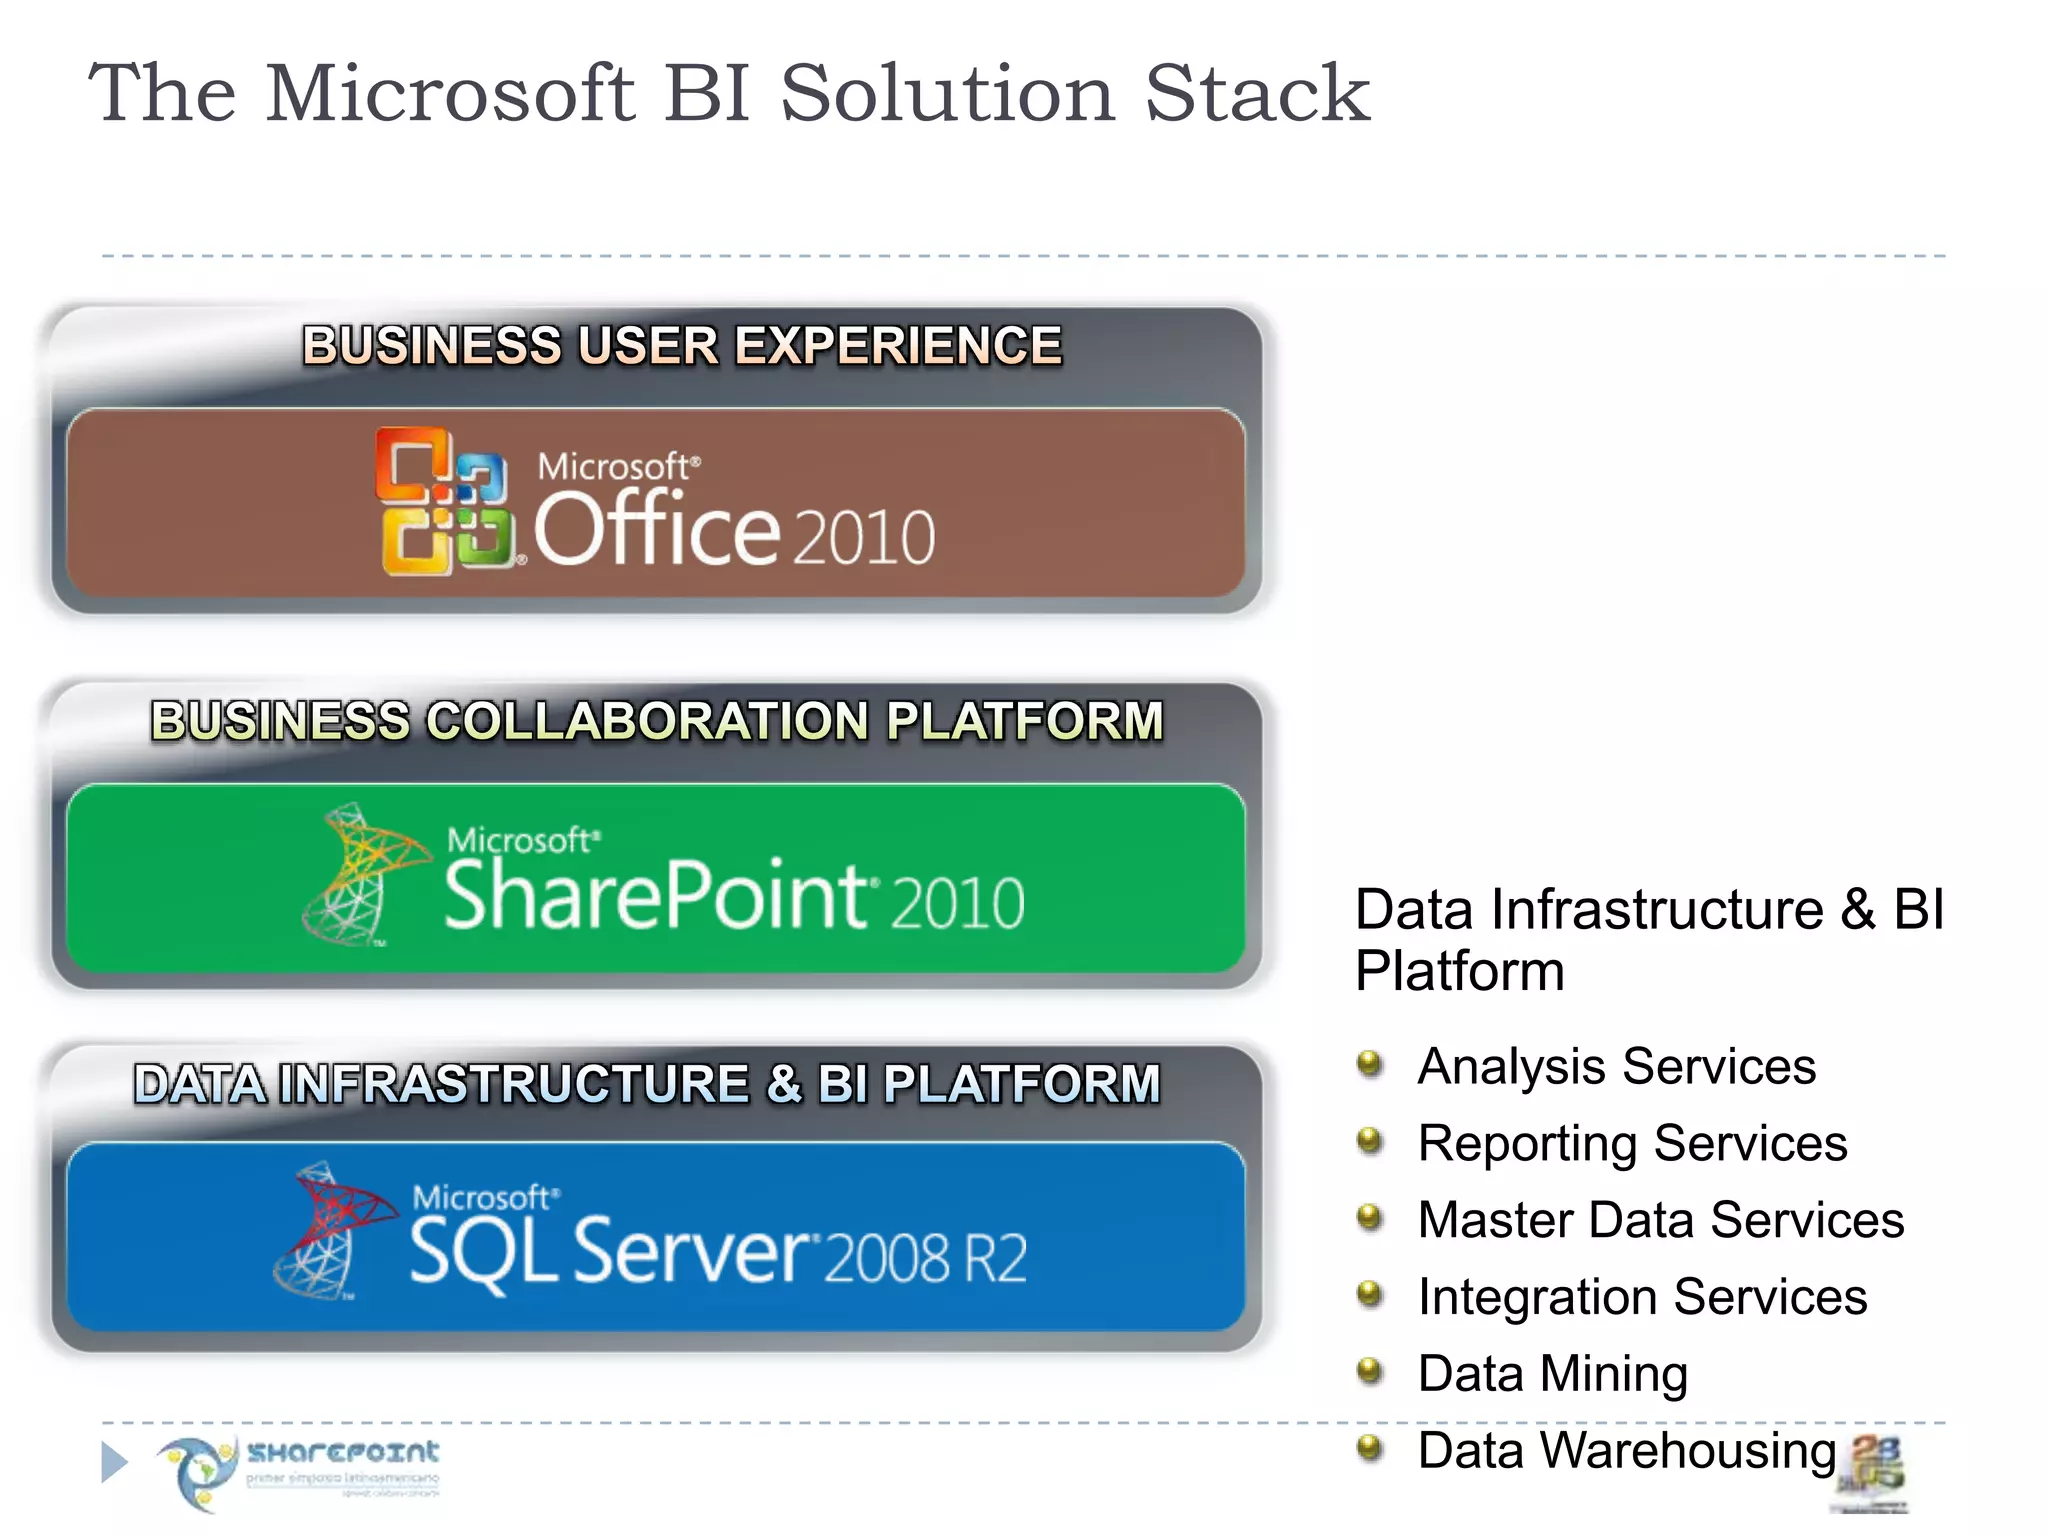
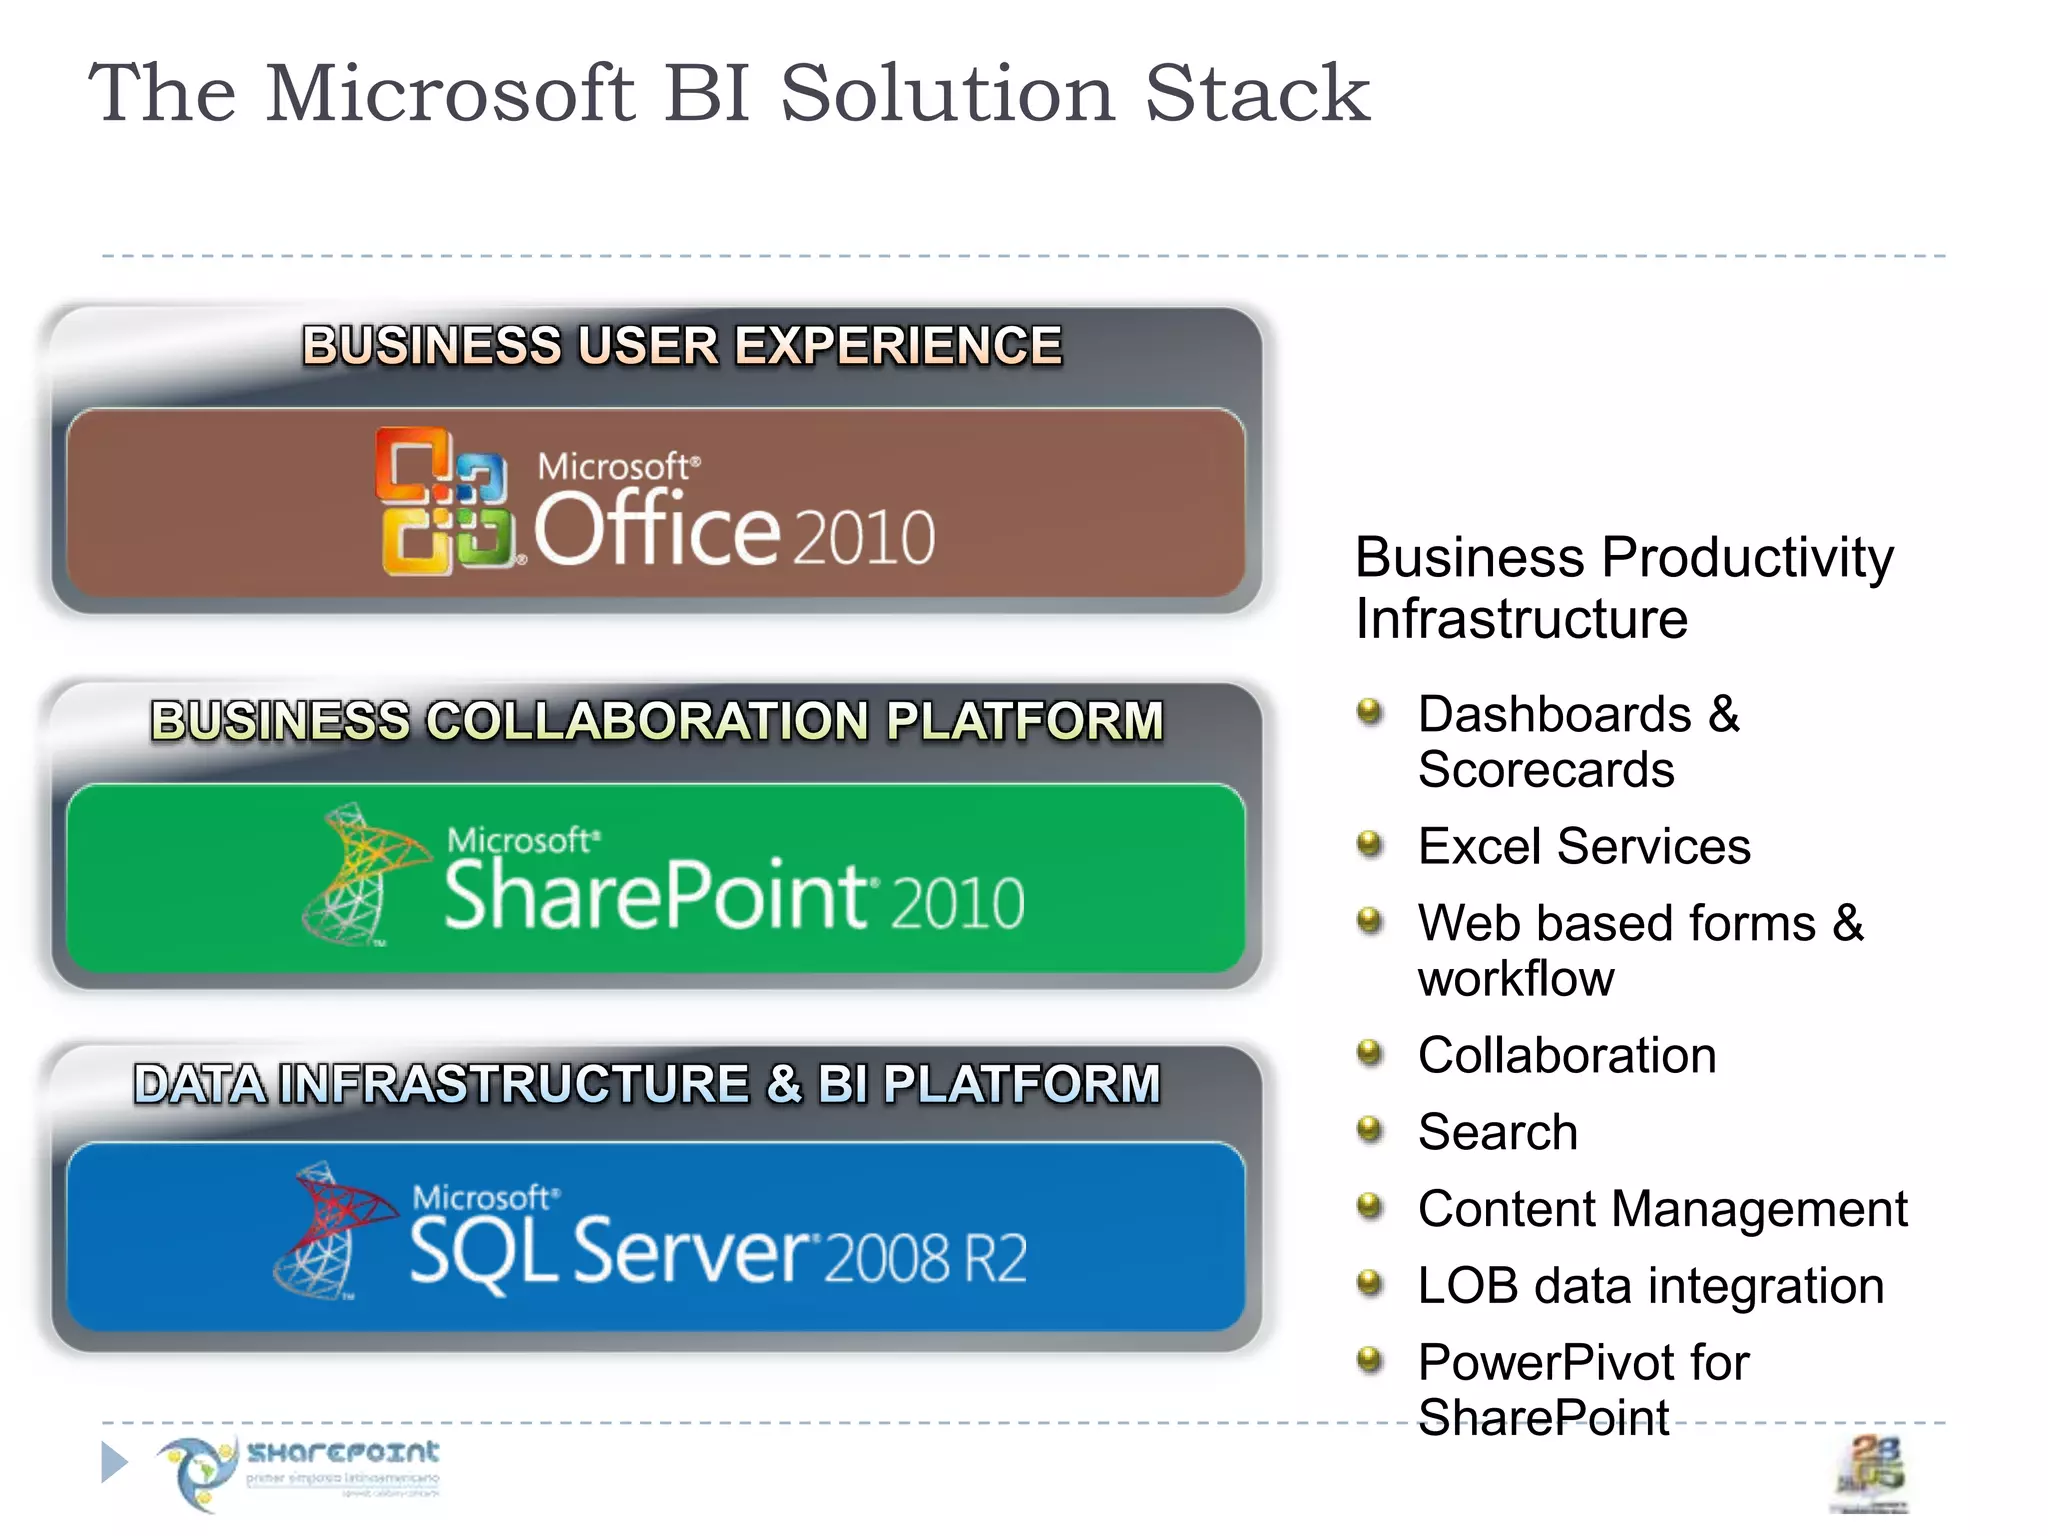
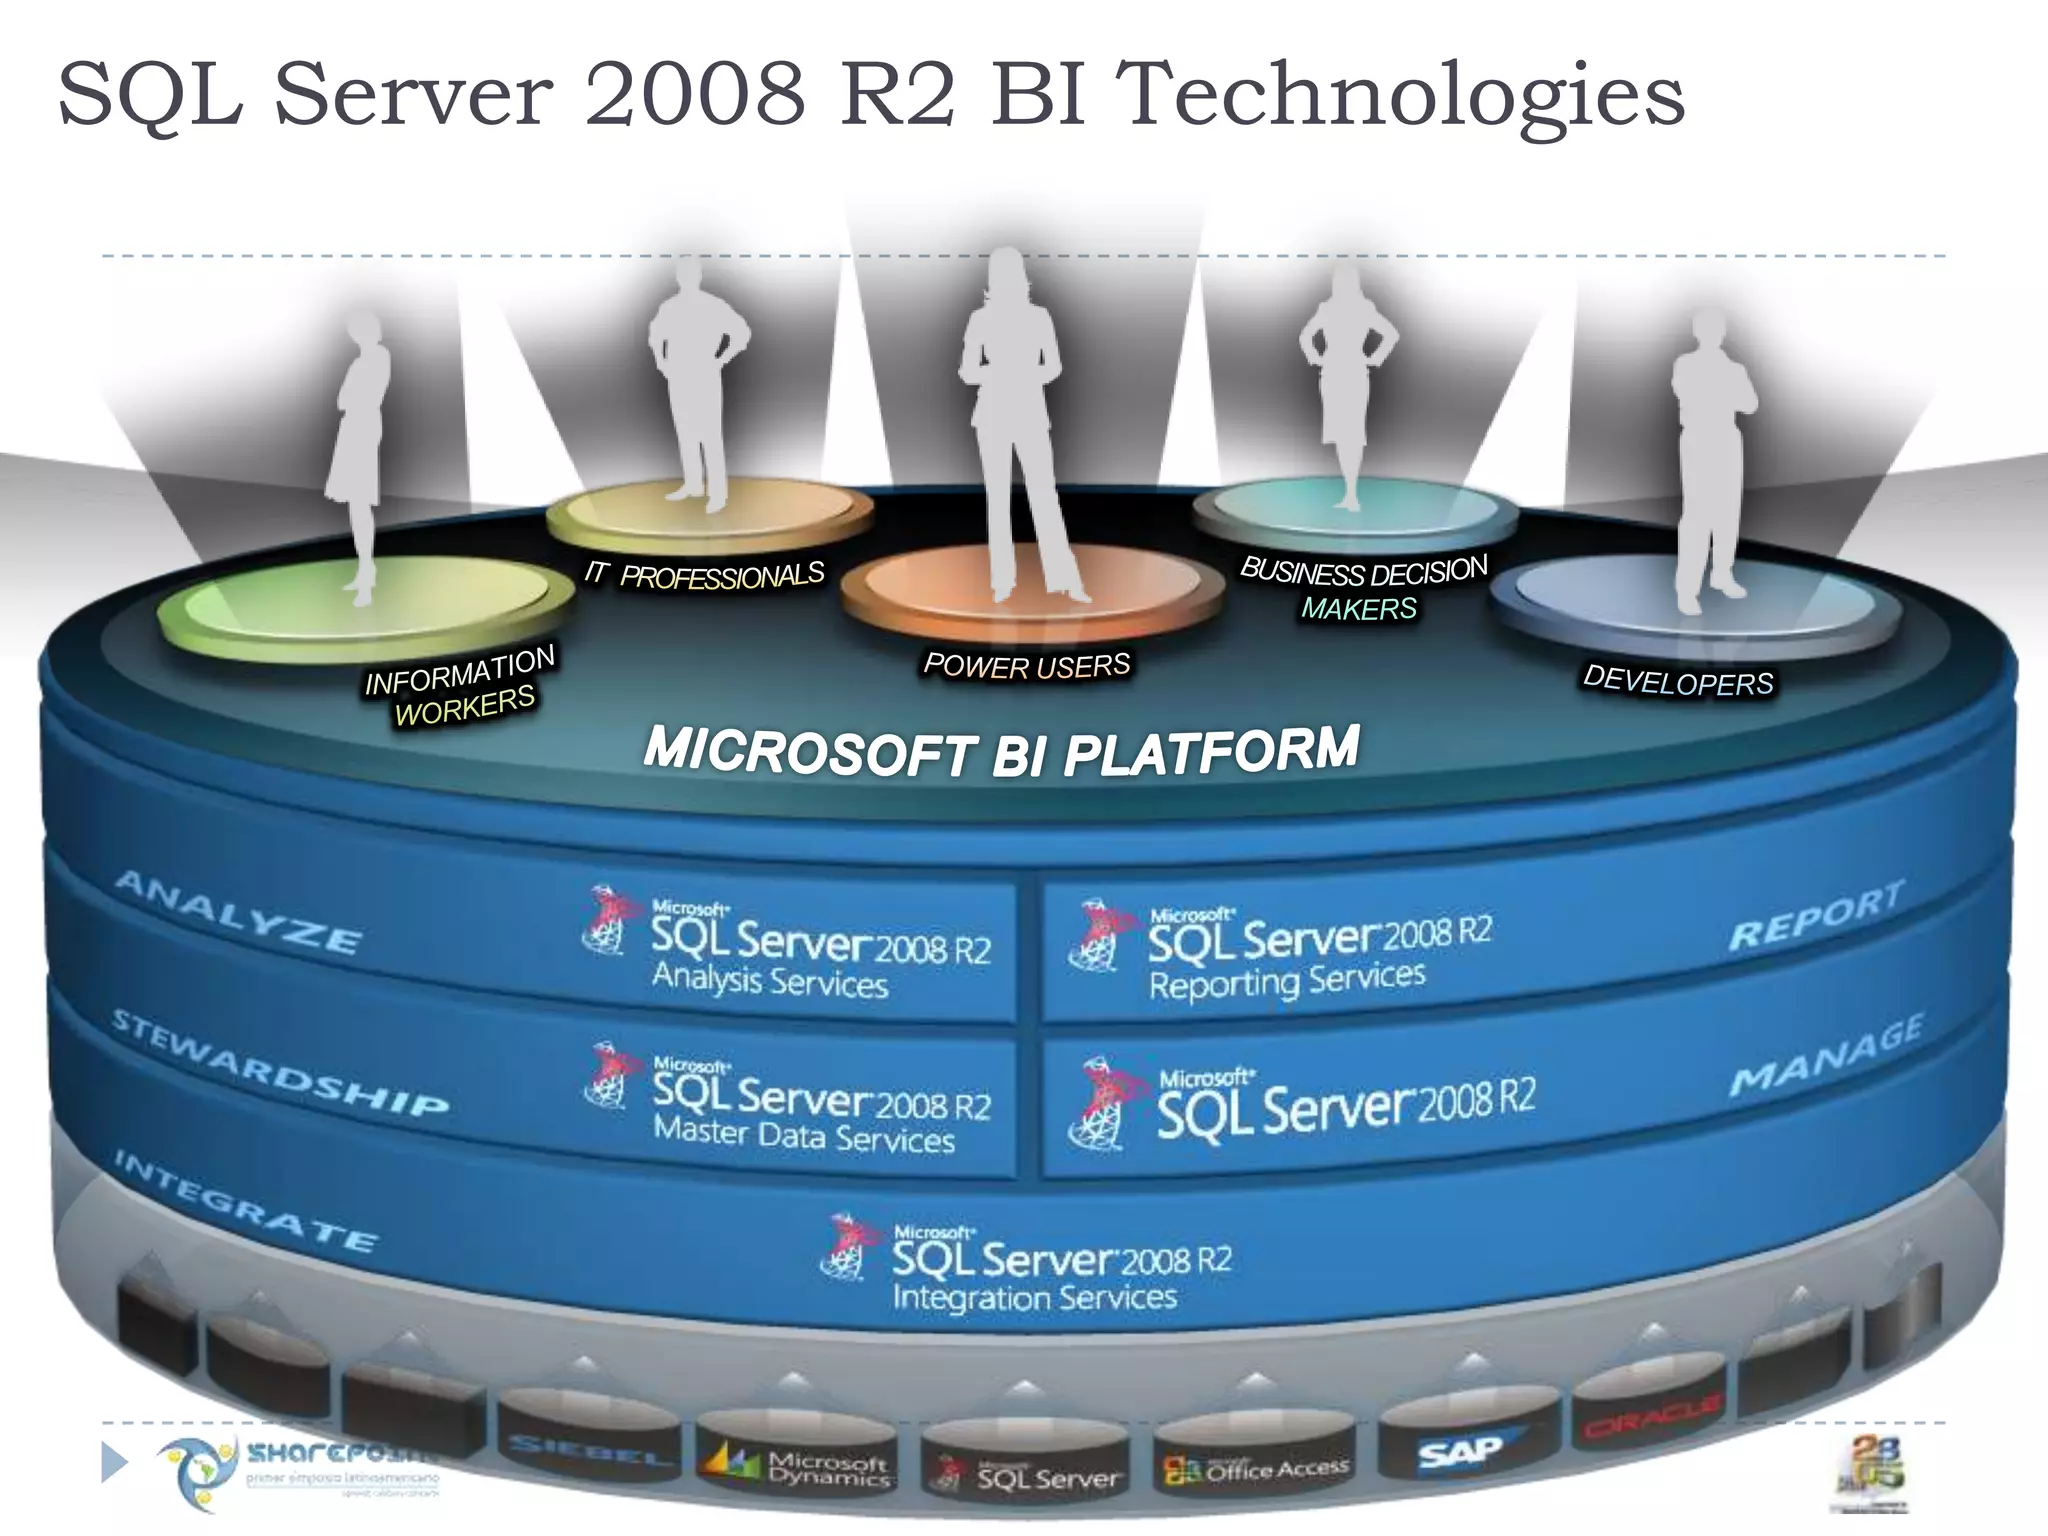
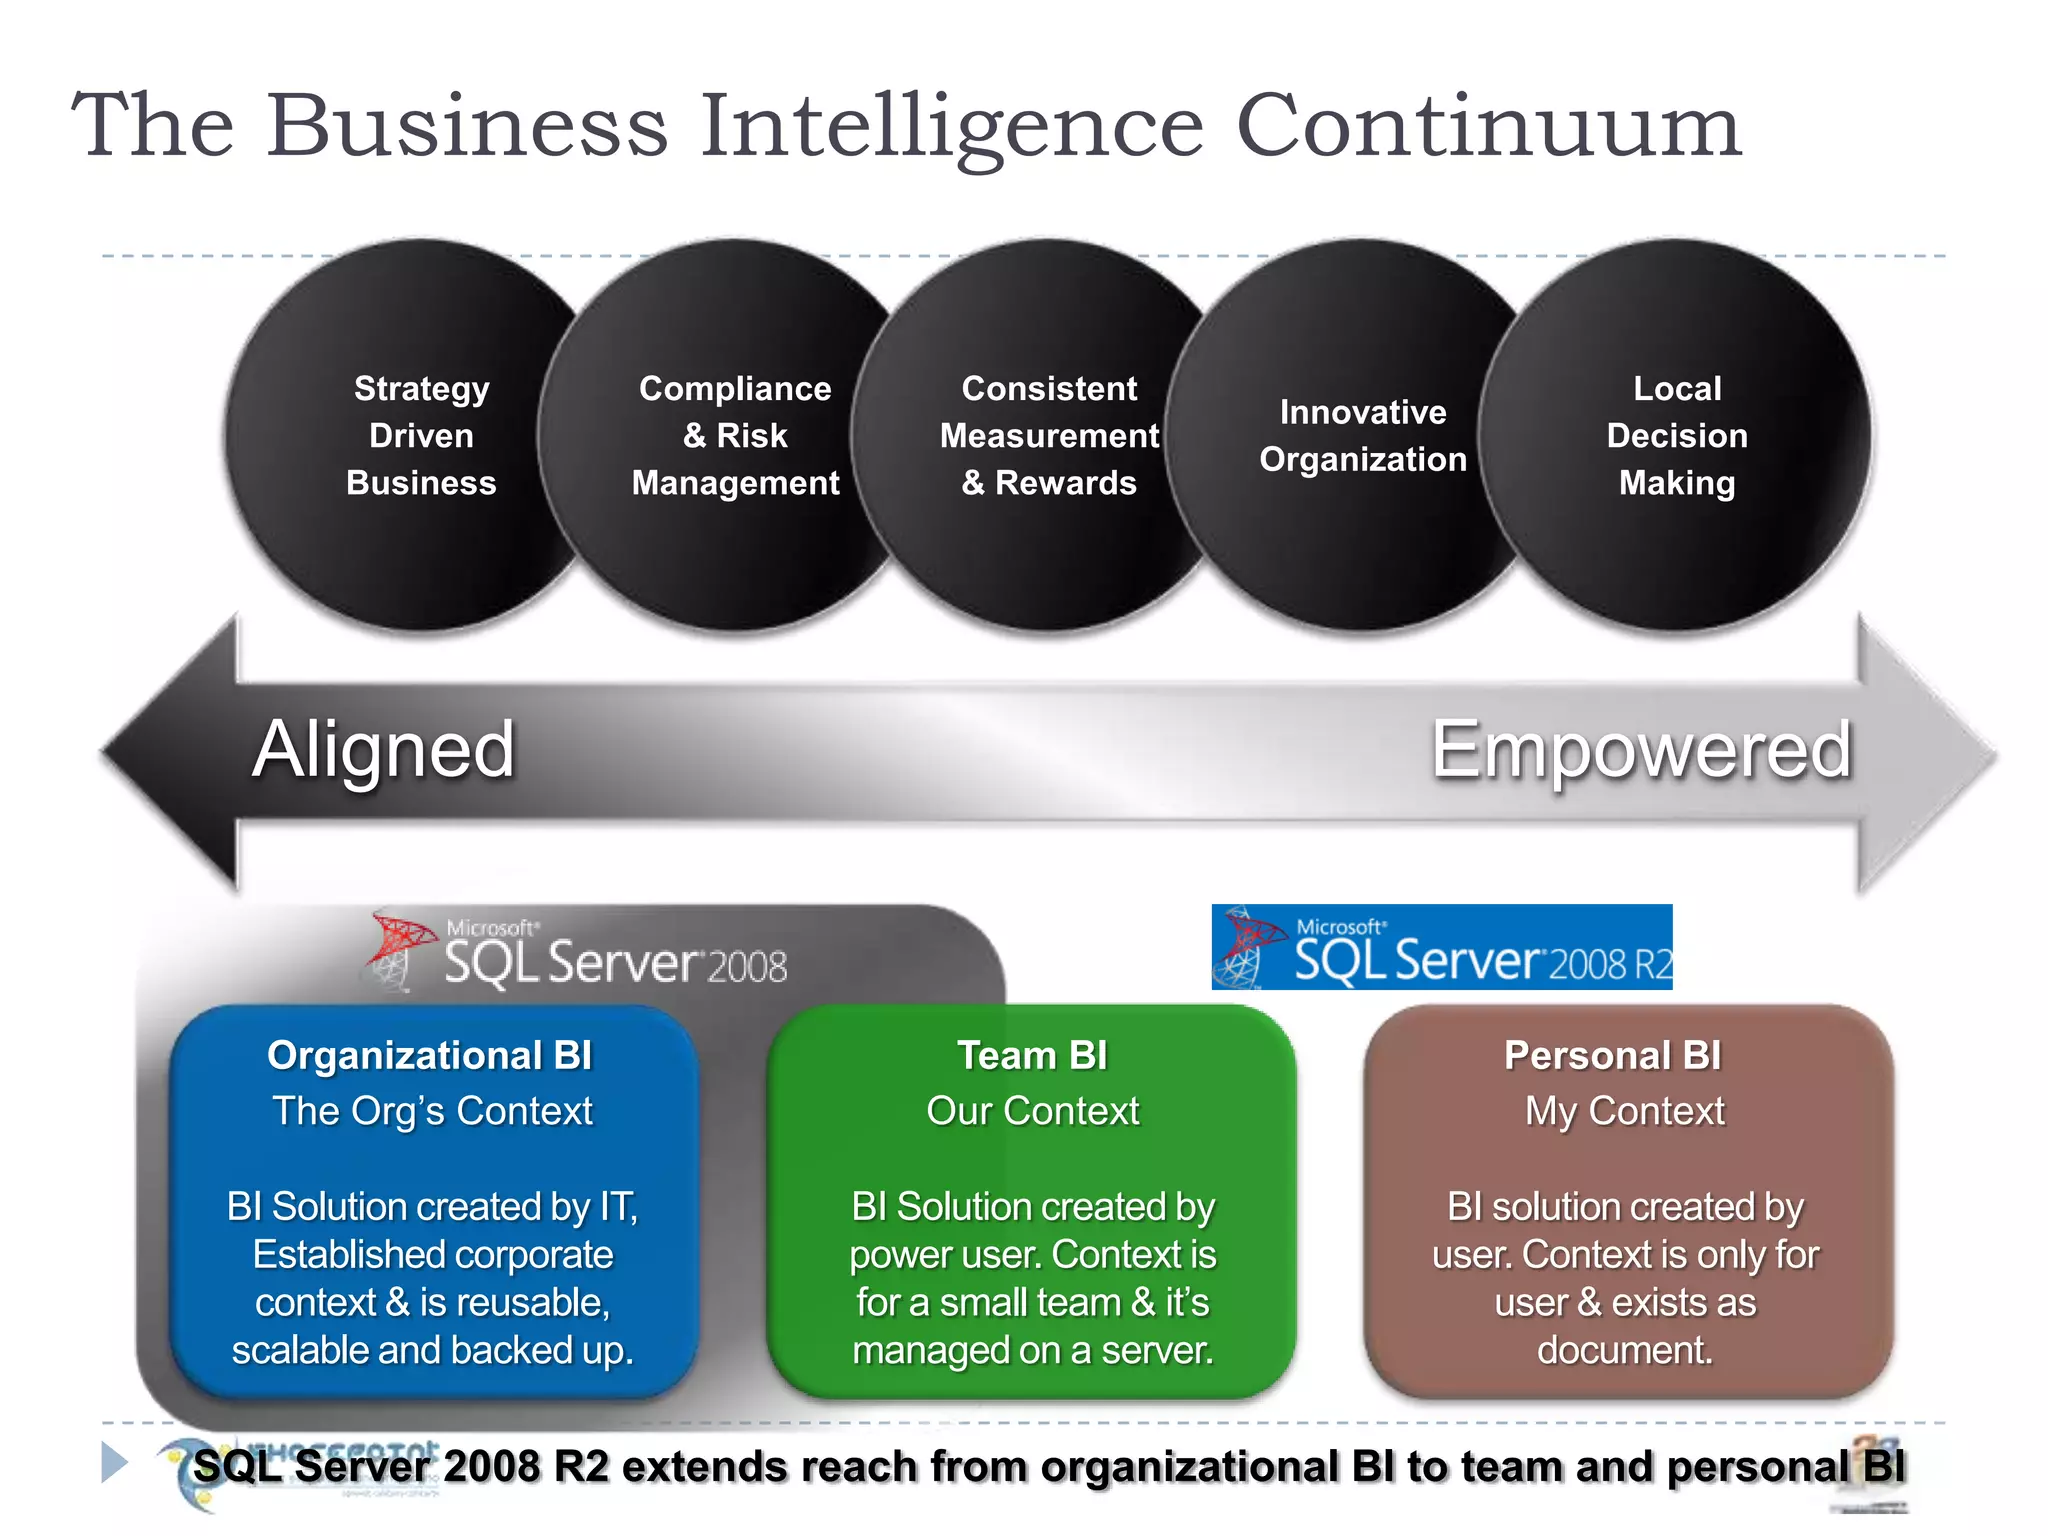
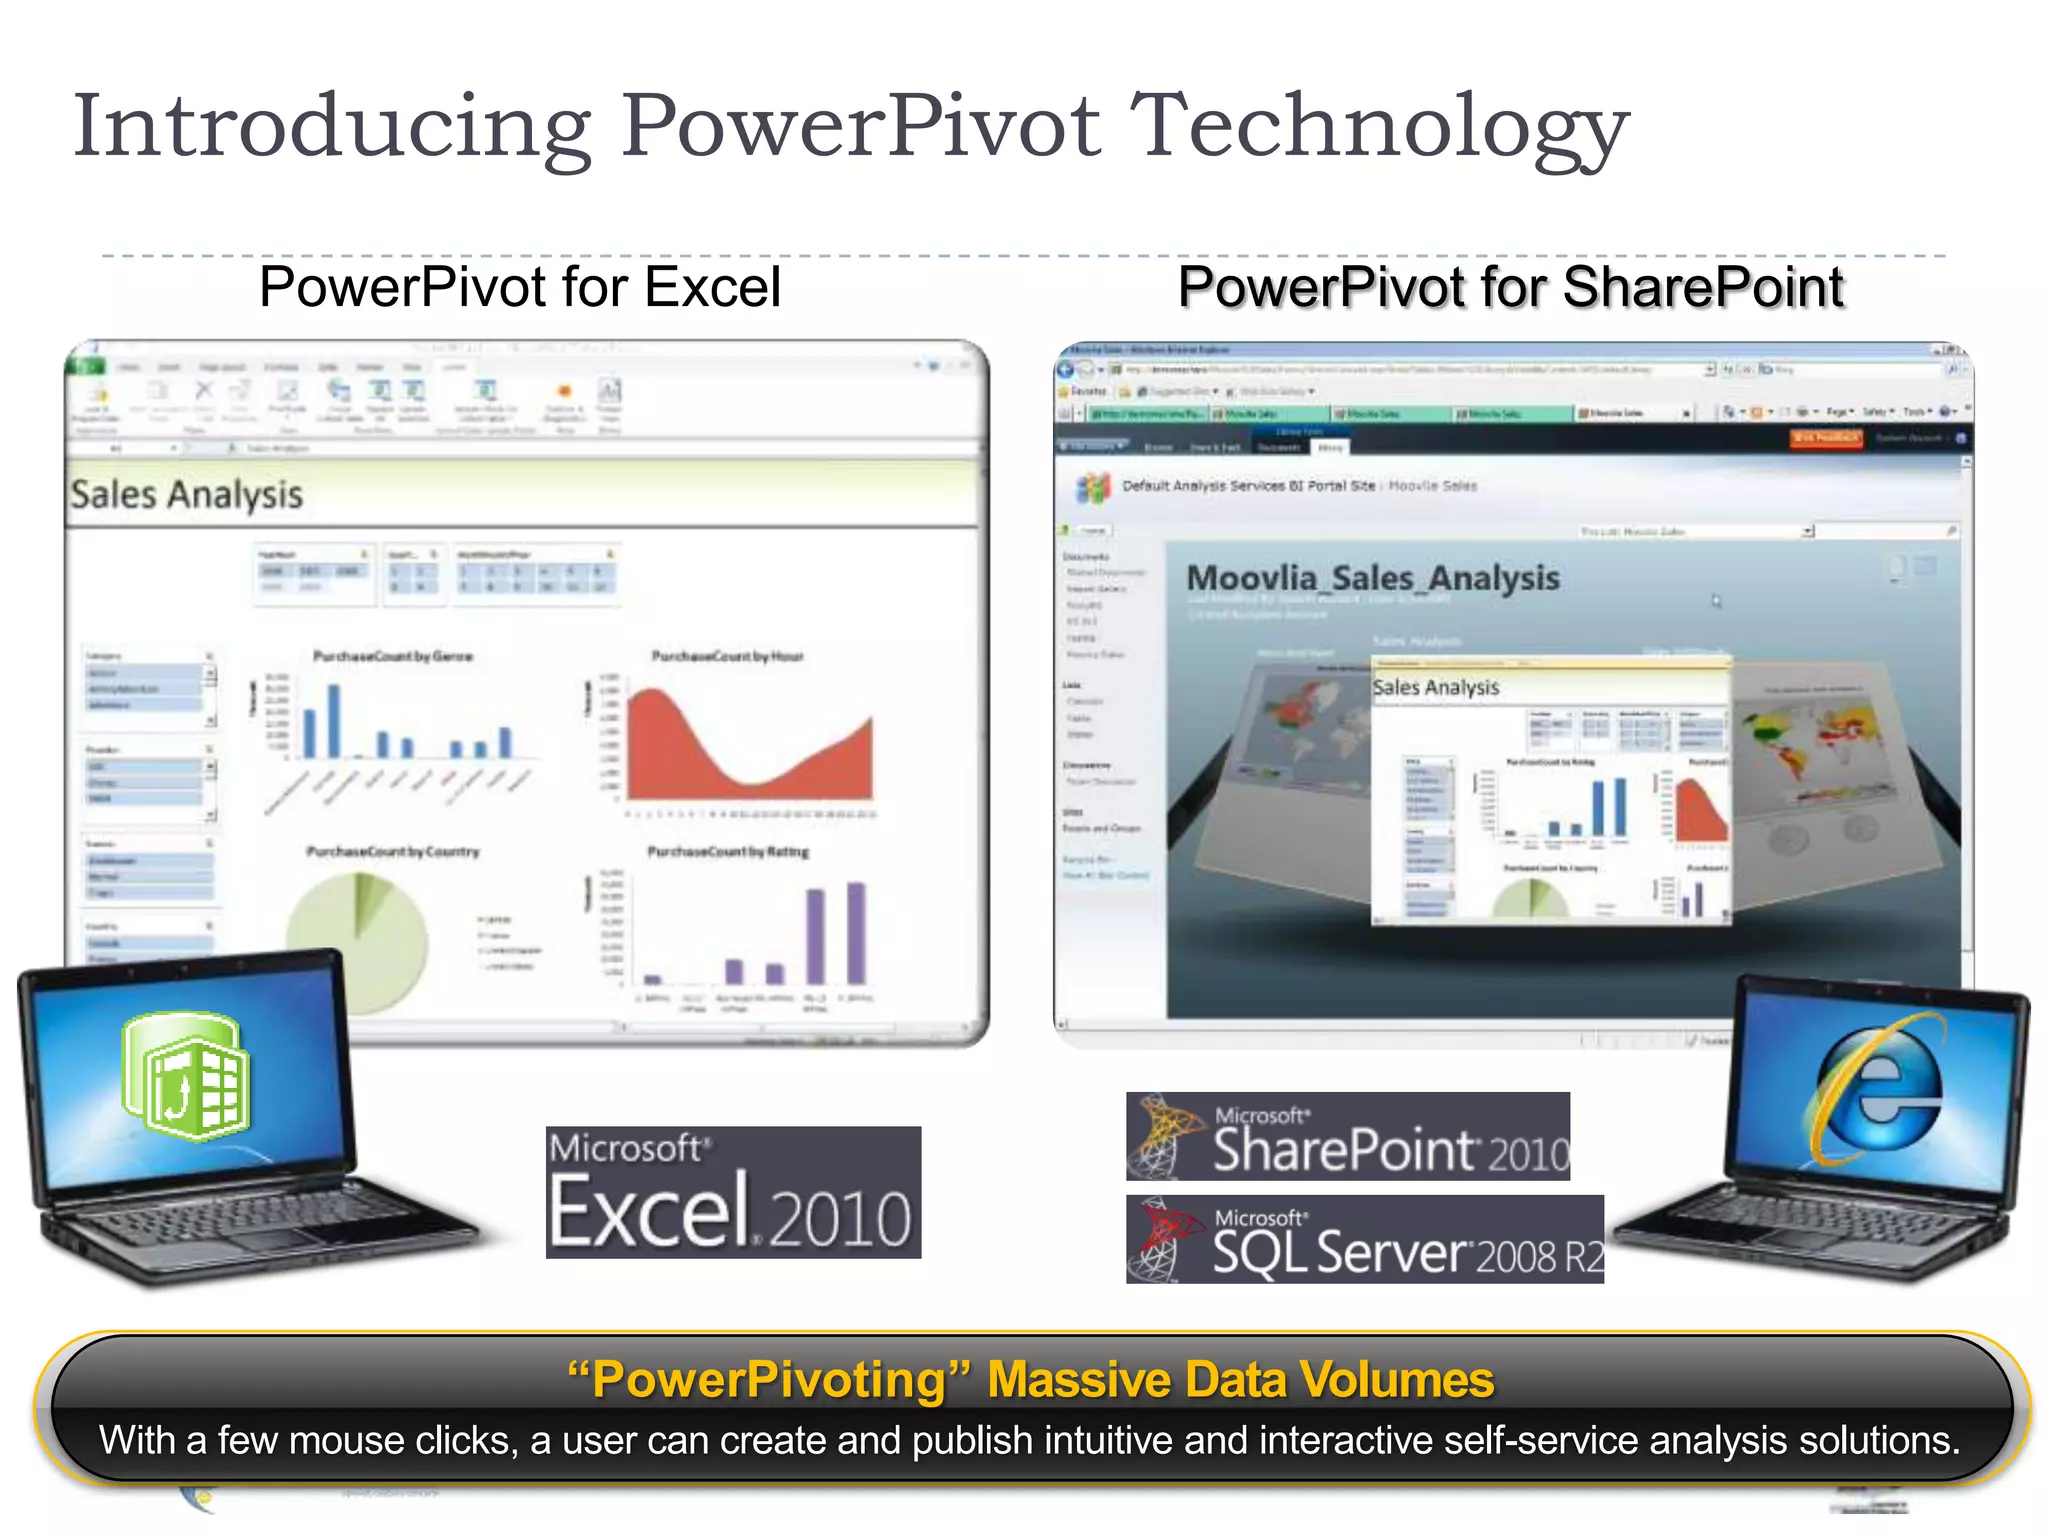
Microsoft offers a business intelligence (BI) solution stack that provides business insights to all employees. The stack includes self-service data exploration, analysis, and visualization tools. It delivers these capabilities through familiar interfaces in Excel and SharePoint. A key part of the solution is PowerPivot, which allows users to easily analyze massive datasets. PowerPivot empowers users to create intuitive, interactive analysis solutions independently with just a few mouse clicks.
Self service BI with sql server 2008 R2 and microsoft power pivot shortEduardo Castro
In this presentation we summarize BI improvements in SQL Server 2008 R2 and PowerPivot.
Regards,
Dr. Eduardo Castro
http://ecastrom.blogspot.com
http://comunidadwindows.org
8 - Productividad en la Nube con BPOS - SharePoint Online, por Luis Du SolierLuis Du Solier
This document summarizes Microsoft cloud services like SharePoint Online. It discusses categories of cloud computing like SaaS, PaaS, and IaaS. It outlines the benefits of Microsoft Online Services like using the latest technologies, unified messaging and collaboration, and flexibility. It also covers security, ease of use, disaster recovery, and specialized administration of these cloud services. Finally, it provides comparisons of features between SharePoint Online standard and dedicated options.
7 - Top ten tips for a SharePoint Succesfull Deployment, por Joel OlesonLuis Du Solier
This document provides 10 steps and common mistakes to avoid for successful deployment of SharePoint. It outlines key considerations such as separating development, test, and production environments; avoiding custom site definitions when possible; not modifying databases; having separate environments for different uses; and understanding the importance of testing and following best practices for upgrades. It also advertises upcoming products and services from Quest to help with SharePoint deployment, development, and migrations.
4 - Silverlight y SharePoint, por Rodrigo Diaz y Mauricio AnguloLuis Du Solier
The document provides an overview of the SharePoint Client Object Model which provides a complete API for accessing and manipulating SharePoint data from external applications instead of just through web services. It discusses the supported areas that can be accessed via the Client OM including sites, lists, files, security and more. It also describes that the .NET, JavaScript and Silverlight Client OM's allow a consistent developer experience across platforms and that object names are mostly the same from the server to client. Finally, it provides examples of using the Client OM from .NET, Silverlight, JavaScript applications and accessing data via the ADO.NET Data Services.
This document discusses self-service business intelligence (BI) using SharePoint 2010 and SQL Server 2012. It provides an introduction to BI and its history, common BI scenarios and problems, and what capabilities are now available. The presentation demonstrates the Microsoft BI stack including SQL Server 2012's Power View for self-service reporting on mobile devices. Key lessons learned are that SharePoint BI and SQL 2012 installation order is important and SQL collation issues need to be avoided.
SharePoint is a platform for managing both structured data and unstructured content to facilitate collaboration and information sharing. It allows different systems and pieces of information to be connected in order to build customized solutions. SharePoint includes features like lists, libraries, and workflows and can be deployed on-premise, in hybrid environments, or in the cloud. Effective use of SharePoint requires focusing on people, processes, technology, and best practices.
This document provides an overview of SAP and Microsoft interoperability. It discusses why organizations implement SAP and Microsoft solutions together to extend the reach of SAP data and processes. Examples are given of how SAP can be accessed through various Microsoft technologies like .NET, Windows Mobile, Excel, and SharePoint. The document also outlines how SAP systems can be exposed and consumed via web services, portals and other integration approaches. Considerations for a successful SAP/Microsoft interoperability implementation include defining enterprise architecture, security, service composition, and taking a holistic view of business processes.
SharePoint and Business Intelligence: Understanding the Microsoft BI Portal C...Perficient, Inc.
BI Tools Applications
PerformancePoint Static Reports
Static Charts/Graphs
Reporting Services
Static Spreadsheets
Excel Services Static Dashboards
Excel Scorecards
Ad-hoc Reports
Report Builder
Ad-hoc Charts/Graphs
SharePoint BI Components Ad-hoc Spreadsheets
Dynamic Reports
Dynamic Charts/Graphs
Dynamic Dashboards/Advanced
Visualizations
This document provides an overview of the business intelligence (BI) capabilities of Microsoft SharePoint, including the various Microsoft BI tools that can be used within SharePoint like PerformancePoint, Reporting Services, Excel Services, and Excel. It outlines the types of static and dynamic reports, charts, dashboards, and visualizations that
Practical Business Intelligence with SharePoint 2013Ivan Sanders
This sessions provides an overview of the new features available to business users and the knowledge they need to start building their own Dashboards using the tools they already know Excel to implement Business Intelligence features they may not have used previously like SQL Analysis Service, SQL Reporting Services, PowerView, PowerPivot, and Excel Services
Many of our SharePoint clients are asking this question, "How do I develop an executive dashboard to surface meaningful business data?"
View C/D/H’s slide deck and let us show you, with:
• An overview of Microsoft BI Platform
• Excel Services
• Business Connectivity Services
• Performance Point Services
• SQL Reporting Services with SharePoint Integration
• PowerPivot for SharePoint
And for more information on this or other SharePoint topics, visit our blog at www.cdhtalkstech.com.
A Simpleton's Guide to Business Intelligence in SharePoint 2010Chris McNulty
This document provides an overview of business intelligence capabilities in SharePoint 2010, including:
- Native charting and visualization of SharePoint list data.
- Excel Services to render Excel workbooks containing data, charts, and interfaces.
- PowerPivot to host large datasets from various sources and enable Excel-style modeling.
- Business Connectivity Services to integrate external data sources into SharePoint.
- SQL Server Reporting Services for more advanced report design.
- PerformancePoint 2010 for sophisticated dashboards integrating multiple BI tools.
- Project Dallas for accessing public data subscriptions through Azure.
This document summarizes a presentation about the new features in Microsoft SharePoint 2010. It introduces the speaker and provides an agenda that covers SharePoint 2010 workloads, the evolution of SharePoint, software requirements, and what's new. Key new features discussed include the ribbon UI, improved integration with Office clients, enhanced social collaboration features like tagging and activity feeds, improved workflows, business connectivity services, and development improvements. The document provides an overview of the major new capabilities and architectural changes in SharePoint 2010.
Starting in May 2010, with SQL Server 2008 R2, Microsoft began talking more and more about "Personal BI". The focus of this discussion was a paradigm shift moving business intelligence from being something a few BI professionals do with a data warehouse to a practice done by Information Workers every day in familiar tools like Microsoft Excel and SharePoint. Over the course of this session we will show you the improvements that Microsoft has made in the 2013 stack to take this new focus from being a “nice idea” to a truly powerful reality. We will explore the improvements made to Excel, PowerPivot & Power View, & Reporting Services. We will explain the underlying technology that makes the new features possible and walk through demos of some of the shinier toys. At the end of the session you will walk away with a better understanding of what is new in 2013 for business intelligence and an extreme desire to build reusable data model that will undoubtedly bring real value to your business.
Power BI is a business intelligence and data visualization tool that can handle larger datasets faster than Excel. It allows users to connect to various data sources and build interactive dashboards. Power BI certification is in high demand as it provides career benefits such as cost effectiveness and the ability to seamlessly integrate with other Microsoft cloud services. While Excel is good for data manipulation, Power BI is better suited for large-scale data analysis and visualization across devices. Candidates are advised to get formal training to fully understand Power BI's capabilities and implementation.
Office Business Applications in Financial ServicesMike Walker
This document summarizes a presentation about Office Business Applications (OBAs) and how they can help solve challenges in the financial services industry. It defines what an OBA is, discusses why financial services companies should use them, and how OBAs can help address issues like regulatory compliance, inefficient processes, and high costs. It also provides an overview of how OBAs can integrate with existing systems using a composite architecture.
Integrating sap master data with share point sp saturday st. louisBrian Chorba
One of the main goals for implementing an enterprise system is to improve efficiency by removing major obstacles to sharing and accessing information across functional areas. SAP ERP is one of the most complex Enterprise Systems and focuses on operations that are performed within an organization.
In this presentation, we will explore how SharePoint can increase the visibility of critical, accurate, and real-time line-of-business data such as Master data in SAP. Learn some of the latest trends and technologies in the Microsoft-SAP ecosystem. Discover some of the challenges associated with creating and managing SAP Master data and how we can use SharePoint to solve these problems.
This document discusses hybrid architectures and various deployment options for SharePoint. It presents 3 scenarios for hybrid deployments: 1) all data in Office 365, 2) site data on-premises and personal data/conversations in the cloud, and 3) all data locally with conversations in the cloud. It also covers other hybrid topics like identities management, development environments, disaster recovery, and governance considerations for determining appropriate workloads for cloud vs. on-premises.
Business Intelligence & SharePoint - SharePoint Day 2013 Raona
Acerca el conocimiento a los decisores de negocio mediante herramientas de Business Intelligence integradas en tu Intranet (Excel Services & PowerPivot).
This document discusses Microsoft's business intelligence capabilities including SQL Server 2008, SharePoint, and Office. It provides an overview of new features in SQL Server 2008 for business intelligence and how SharePoint can be used for collaboration, content management, and delivering business intelligence reports and dashboards to end users. It also includes demonstrations of SQL Server Analysis Services, SQL Server Reporting Services in Microsoft Office and SharePoint.
BI: new of the buzz words that everyone is talking about but what is it? How can it be used to make a impact in my organization? How do I get started? This session was delivered for SharePoint Saturday Reston.
This document provides an overview of Microsoft Power BI. It discusses how Power BI allows users to connect to hundreds of data sources and perform analysis. The document also includes graphics showing Power BI's speed and growth compared to Tableau, as well as information about partnership offers between Microsoft and ACCA that provide discounts and services for ACCA members.
This demo heavy presentation was shared at Toronto's Global Azure Bootcamp highlighting the best practices and capabilities in Power BI around both consumption and data source planning/connectivity.
Power BI Create lightning fast dashboard with power bi & Its Components Vishal Pawar
Every data has meaning, but we had limitation to use data through big long running process Extraction, Transformation and Representation, but now Power BI solves your problem to kick start having Data extraction in Power Query, Data Modelling and Transformation in Power Pivot and reach data representation using power view and power map on demand any nearby device on your fingertips, You will learn all latest and greatest features of Power BI.
SPSUK - ITPro - Matt Groves - SharePoint in the cloudMatt Groves
This presentation was delivered by Matt Groves at the first SharePoint Saturday in the UK (October 2nd 2010). This covers some of the options for SharePoint deployments, on-premise and various cloud based options...
This document discusses Microsoft's business intelligence (BI) solution stack, including the roles of Analysis Services, Reporting Services, Master Data Services, and Integration Services. It focuses on Analysis Services and describes how it provides scalable and performant data modeling, predictive analytics, and self-service BI capabilities through integration with tools like Excel, SharePoint, and SQL Server. Real-world customer examples are also presented to demonstrate how Analysis Services can help organizations improve decision making and reduce costs.
Share point 2010 next gen of collaborationPeter1020
Microsoft SharePoint 2010 provides business intelligence capabilities that empower decision makers, improve organizational effectiveness, and enable IT efficiency through three main points:
1) It allows users to seamlessly create, access, and share information for analysis and decision making.
2) It helps organizations translate strategies into action and enable accountability with dashboards and scorecards that track key metrics.
3) It creates an enterprise-ready platform that reduces IT costs and provides a robust infrastructure for business intelligence.
BI in the Cloud - Microsoft Power BI Overview and DemoChristopher Foot
RDX Insights Series Presentation focusing on Microsoft Power BI in the cloud. We begin with a high-level overview of the Microsoft BI product suite and discuss the SSIS/SSAS/SSRS tech stack and Power BI. The webinar continues with a deep dive into Power BI and includes instructions on how to use the product to capture, model, analyze and visualize business data. We end the webinar with a Power BI demo highlighting some of its most beneficial and interesting features.
Building Business Intelligence Solutions for SharePointInnoTech
This document summarizes a presentation about building business intelligence solutions in SharePoint. The presentation covers: an introduction to business intelligence and the three stages of organizing, delivering, and using data; the various BI tools available in SharePoint 2010 like SQL Reporting Services, PerformancePoint, Excel Services, and Visio Graphics Services; and demonstrations of each tool. The overall agenda is to provide an overview of business intelligence and how SharePoint can be used to build BI solutions leveraging these tools.
Microsoft Power BI is a business analytics tool that allows users to access, analyze, and visualize data from various sources. It offers self-service BI capabilities that enable end users to explore and gain insights from data. Power BI provides live dashboards, natural language querying, and content packs for popular SaaS solutions. It integrates with Microsoft products and allows sharing and collaboration on reports and dashboards. Signing up for a free Power BI account is quick and only requires a work or school email address.
Leveraging MS BI Toolset to Monitor Performance - TechFuse 2010Dan English
There are many different pieces in the Microsoft BI toolset. In this session, we will take a look at all of the different pieces and utilize each of them to create a unified dashboard, where each component is being leveraged. The tools that will be utilized during this session will include SQL Server 2008, SSRS 2008, SSAS 2008, Excel 2007, Excel Services, PPS 2007, Dashboard Designer, SharePoint Server 2007 and more.
Microsoft & Pyramid Analytics: What the Microsoft and Pyramid Analytics' Stra...Pyramid Analytics
In this webinar, join Amir Netz, Technical Fellow at Microsoft in charge of Microsoft’s business intelligence (BI) technologies, and Avi Perez CTO at Pyramid Analytics, as they examine how the two companies are moving BI technology forward. A recording of this presentation will be available soon on the Pyramid Analytics' website at http://pyramidanalytics.com/.
The document discusses trends in business intelligence and how Microsoft products can help organizations become more productive and empower business users. It highlights how Microsoft BI allows for self-service data exploration and analysis using tools like PowerPivot and Report Builder. It also describes how SharePoint can be used as a platform for collaboration, with features like dashboards, reporting, and BI search to increase organizational visibility.
This document discusses building cubes in SQL Server Analysis Services (SSAS) and PowerPivot. It covers cubes created manually in SSAS, auto-cubes created in PowerPivot, and cubes in the upcoming Denali release. PowerPivot allows users to analyze massive data volumes with Excel. Reporting Services and SharePoint can be used to publish and share PowerPivot reports. SSAS provides an advanced feature set for scalable cube design. Denali will converge cube technologies with its new BI Semantic Model.
Intro to BI Semantic Model & Self-Service Reporting with Power ViewDan English
There are a lot of changes coming in the next release of SQL Server “Denali” with Analysis Services and PowerPivot along with new powerful BI functionality being added. This presentation will introduce the new BI Semantic Model concept, talk about the different options you have with Analysis Services in SQL Server 2012 (“Denali"), go over the new features in Analysis Services – including PowerPivot, go over developing models, and dive into the new self-service reporting authoring tool Power View (Project “Crescent”). Along the way there will be demonstrations of the new features and functionality so you can get a feel for what is coming. By the end of the session you will have a full understanding of what lies ahead and you can start preparing your roadmap for delivering BI content within your organization.
Microsoft Power BI is a cloud-based business analytics service. This document provides an overview of Power BI and its key capabilities. It discusses connecting to various data sources, creating reports and dashboards, exploring data using natural language queries, and sharing insights across an organization. The document also describes the Power BI online service experience and how to work with reports, dashboards, and collaborate with others.
Microsoft Power BI is a cloud-based business analytics service. This document provides an overview of Power BI and its key capabilities. It discusses connecting to various data sources, creating reports and dashboards, exploring data using natural language queries, and sharing insights across an organization. The document also describes the Power BI online service experience and how to work with reports, dashboards, and other features in the browser or mobile apps.
Power BI Training (Data Analytics& Business Intelegence)AnggaFernando3
Microsoft Power BI is a cloud-based business analytics service. This document provides an overview of Power BI and its key capabilities. It discusses connecting to various data sources, creating reports and dashboards, exploring data using natural language queries, and sharing insights across an organization. The document also describes the Power BI online service experience and how to work with reports, dashboards, and collaborate with others.
This document provides an overview of various business intelligence solutions including performance management tools, reporting and analysis tools, ETL tools, BI platforms, and BI/DW consulting services such as data modeling, ETL development, reporting services, analysis services, and BI/DW support and maintenance. It also discusses key BI business drivers and value messages around productivity, empowering business users, ensuring data protection and quality, and providing business insights.
Empower Your Organization with Microsoft Power PlatformDavid J Rosenthal
The document discusses the Microsoft Power Platform and how it empowers organizations with application development, data analytics, and workflow automation. It highlights that 500 million new apps will be built in the next 5 years, more than all apps built in the last 40 years. It also notes that 86% of organizations struggle to find technical talent for application development. The Power Platform is positioned as a low-code platform that can help organizations build apps and automate workflows across Microsoft products like Office 365, Dynamics 365 and Azure without extensive coding.
Formulating Power BI Enterprise StrategyTeo Lachev
The document outlines an agenda for a presentation on formulating a Power BI enterprise strategy. The agenda includes introductions, presentations on how Power BI empowers businesses and planning a data access strategy, a question and answer session, and information about an upcoming two-day Power BI workshop. It also provides background information about the presenters and describes various Power BI tools and capabilities for business users, data analysts, BI professionals, and developers.
Similar to 2b - PowerPivot y SharePoint 2010, por Tomas Hernandez (20)
6 - Migracion a SharePoint 2010, por Ricardo Muñoz y Hector InsuaLuis Du Solier
El documento presenta información sobre la migración de SharePoint 2010. Explica los cambios técnicos en SharePoint 2010 y requisitos de hardware actualizados. También cubre temas como historia de migraciones previas, el ciclo de actualización, escenarios comunes y no soportados de migración, y las diferentes opciones para migrar contenido y funcionalidades como in-place upgrade, attach de bases de datos y upgrade visual. Finalmente, incluye una demostración de migración de base de datos de contenido.
5 - SharePoint 2010 y Windows 2008 R2, por Hector Insua y Ruben ColomoLuis Du Solier
El documento describe las nuevas características y mejoras de Microsoft SharePoint 2010 y Windows Server 2008 R2, incluyendo una interfaz más intuitiva, publicación más sencilla, acceso móvil mejorado, comunidades más robustas, análisis de datos avanzado, integración mejorada, administración centralizada y reducción de costos a través de una infraestructura unificada. También destaca las ventajas de usar System Center para administrar SharePoint, como monitoreo proactivo, respaldo eficiente y actualizaciones automáticas.
3 - OBA y SharePoint 2010, por Ricardo LooLuis Du Solier
Este documento presenta una introducción a las aplicaciones de negocio de Office (OBA). Explica que las OBA conectan sistemas de negocio con usuarios a través de la interfaz de Office. Describe los elementos clave de una OBA como el Ribbon, TaskPane, ActionPane y FormRegion. También cubre el modelo de objetos de cliente de SharePoint y recursos adicionales para desarrolladores de OBA.
2 - SharePoint 2010 y Project Server 2010, por Javier D LabraLuis Du Solier
El documento describe cómo Project y SharePoint pueden funcionar mejor juntos para permitir la colaboración de equipos, alinear el trabajo con los objetivos estratégicos y racionalizar la inversión en proyectos. Ofrece diferentes escenarios de uso según el nivel de gestión y colaboración requeridos, desde listas de tareas simples en SharePoint hasta soluciones completas de gestión de proyectos y portafolios construidas en SharePoint Server.
1 - Desarrollo en SharePoint con Visual Studio 2010, por Misael MonterrocaLuis Du Solier
El documento describe las mejoras en el desarrollo para SharePoint en Visual Studio 2010, incluyendo herramientas integradas para el desarrollo completo de principio a fin, diseñadores visuales, depuración mejorada, y funciones como LINQ para SharePoint que permiten consultas entre listas. También cubre mejoras específicas como relaciones entre listas, validaciones en listas, y flujos de trabajo a nivel de sitio.
El documento presenta una introducción a Silverlight 3 y su integración con SharePoint. Explica los elementos clave de la experiencia del usuario (UX) y cómo Silverlight no reemplaza las tecnologías web actuales sino que las complementa. Luego describe las características de Silverlight, incluyendo su estructura, demostraciones y talleres disponibles.
Este documento proporciona una introducción a Microsoft SharePoint 2007. Explica que SharePoint permite compartir información y colaborar a través de sitios web. Detalla algunas de las capacidades básicas como bibliotecas de documentos, listas e imágenes. También describe los productos que conforman SharePoint como Windows SharePoint Services y Microsoft Office SharePoint Server 2007.
Observability Concepts EVERY Developer Should Know -- DeveloperWeek Europe.pdfPaige Cruz
Monitoring and observability aren’t traditionally found in software curriculums and many of us cobble this knowledge together from whatever vendor or ecosystem we were first introduced to and whatever is a part of your current company’s observability stack.
While the dev and ops silo continues to crumble….many organizations still relegate monitoring & observability as the purview of ops, infra and SRE teams. This is a mistake - achieving a highly observable system requires collaboration up and down the stack.
I, a former op, would like to extend an invitation to all application developers to join the observability party will share these foundational concepts to build on:
For the full video of this presentation, please visit: https://www.edge-ai-vision.com/2024/06/building-and-scaling-ai-applications-with-the-nx-ai-manager-a-presentation-from-network-optix/
Robin van Emden, Senior Director of Data Science at Network Optix, presents the “Building and Scaling AI Applications with the Nx AI Manager,” tutorial at the May 2024 Embedded Vision Summit.
In this presentation, van Emden covers the basics of scaling edge AI solutions using the Nx tool kit. He emphasizes the process of developing AI models and deploying them globally. He also showcases the conversion of AI models and the creation of effective edge AI pipelines, with a focus on pre-processing, model conversion, selecting the appropriate inference engine for the target hardware and post-processing.
van Emden shows how Nx can simplify the developer’s life and facilitate a rapid transition from concept to production-ready applications.He provides valuable insights into developing scalable and efficient edge AI solutions, with a strong focus on practical implementation.
Building RAG with self-deployed Milvus vector database and Snowpark Container...Zilliz
This talk will give hands-on advice on building RAG applications with an open-source Milvus database deployed as a docker container. We will also introduce the integration of Milvus with Snowpark Container Services.
How to Get CNIC Information System with Paksim Ga.pptxdanishmna97
Pakdata Cf is a groundbreaking system designed to streamline and facilitate access to CNIC information. This innovative platform leverages advanced technology to provide users with efficient and secure access to their CNIC details.
Pushing the limits of ePRTC: 100ns holdover for 100 daysAdtran
At WSTS 2024, Alon Stern explored the topic of parametric holdover and explained how recent research findings can be implemented in real-world PNT networks to achieve 100 nanoseconds of accuracy for up to 100 days.
Removing Uninteresting Bytes in Software FuzzingAftab Hussain
Imagine a world where software fuzzing, the process of mutating bytes in test seeds to uncover hidden and erroneous program behaviors, becomes faster and more effective. A lot depends on the initial seeds, which can significantly dictate the trajectory of a fuzzing campaign, particularly in terms of how long it takes to uncover interesting behaviour in your code. We introduce DIAR, a technique designed to speedup fuzzing campaigns by pinpointing and eliminating those uninteresting bytes in the seeds. Picture this: instead of wasting valuable resources on meaningless mutations in large, bloated seeds, DIAR removes the unnecessary bytes, streamlining the entire process.
In this work, we equipped AFL, a popular fuzzer, with DIAR and examined two critical Linux libraries -- Libxml's xmllint, a tool for parsing xml documents, and Binutil's readelf, an essential debugging and security analysis command-line tool used to display detailed information about ELF (Executable and Linkable Format). Our preliminary results show that AFL+DIAR does not only discover new paths more quickly but also achieves higher coverage overall. This work thus showcases how starting with lean and optimized seeds can lead to faster, more comprehensive fuzzing campaigns -- and DIAR helps you find such seeds.
- These are slides of the talk given at IEEE International Conference on Software Testing Verification and Validation Workshop, ICSTW 2022.
A tale of scale & speed: How the US Navy is enabling software delivery from l...sonjaschweigert1
Rapid and secure feature delivery is a goal across every application team and every branch of the DoD. The Navy’s DevSecOps platform, Party Barge, has achieved:
- Reduction in onboarding time from 5 weeks to 1 day
- Improved developer experience and productivity through actionable findings and reduction of false positives
- Maintenance of superior security standards and inherent policy enforcement with Authorization to Operate (ATO)
Development teams can ship efficiently and ensure applications are cyber ready for Navy Authorizing Officials (AOs). In this webinar, Sigma Defense and Anchore will give attendees a look behind the scenes and demo secure pipeline automation and security artifacts that speed up application ATO and time to production.
We will cover:
- How to remove silos in DevSecOps
- How to build efficient development pipeline roles and component templates
- How to deliver security artifacts that matter for ATO’s (SBOMs, vulnerability reports, and policy evidence)
- How to streamline operations with automated policy checks on container images
Maruthi Prithivirajan, Head of ASEAN & IN Solution Architecture, Neo4j
Get an inside look at the latest Neo4j innovations that enable relationship-driven intelligence at scale. Learn more about the newest cloud integrations and product enhancements that make Neo4j an essential choice for developers building apps with interconnected data and generative AI.
Cosa hanno in comune un mattoncino Lego e la backdoor XZ?Speck&Tech
ABSTRACT: A prima vista, un mattoncino Lego e la backdoor XZ potrebbero avere in comune il fatto di essere entrambi blocchi di costruzione, o dipendenze di progetti creativi e software. La realtà è che un mattoncino Lego e il caso della backdoor XZ hanno molto di più di tutto ciò in comune.
Partecipate alla presentazione per immergervi in una storia di interoperabilità, standard e formati aperti, per poi discutere del ruolo importante che i contributori hanno in una comunità open source sostenibile.
BIO: Sostenitrice del software libero e dei formati standard e aperti. È stata un membro attivo dei progetti Fedora e openSUSE e ha co-fondato l'Associazione LibreItalia dove è stata coinvolta in diversi eventi, migrazioni e formazione relativi a LibreOffice. In precedenza ha lavorato a migrazioni e corsi di formazione su LibreOffice per diverse amministrazioni pubbliche e privati. Da gennaio 2020 lavora in SUSE come Software Release Engineer per Uyuni e SUSE Manager e quando non segue la sua passione per i computer e per Geeko coltiva la sua curiosità per l'astronomia (da cui deriva il suo nickname deneb_alpha).
Essentials of Automations: The Art of Triggers and Actions in FMESafe Software
In this second installment of our Essentials of Automations webinar series, we’ll explore the landscape of triggers and actions, guiding you through the nuances of authoring and adapting workspaces for seamless automations. Gain an understanding of the full spectrum of triggers and actions available in FME, empowering you to enhance your workspaces for efficient automation.
We’ll kick things off by showcasing the most commonly used event-based triggers, introducing you to various automation workflows like manual triggers, schedules, directory watchers, and more. Plus, see how these elements play out in real scenarios.
Whether you’re tweaking your current setup or building from the ground up, this session will arm you with the tools and insights needed to transform your FME usage into a powerhouse of productivity. Join us to discover effective strategies that simplify complex processes, enhancing your productivity and transforming your data management practices with FME. Let’s turn complexity into clarity and make your workspaces work wonders!
Unlock the Future of Search with MongoDB Atlas_ Vector Search Unleashed.pdfMalak Abu Hammad
Discover how MongoDB Atlas and vector search technology can revolutionize your application's search capabilities. This comprehensive presentation covers:
* What is Vector Search?
* Importance and benefits of vector search
* Practical use cases across various industries
* Step-by-step implementation guide
* Live demos with code snippets
* Enhancing LLM capabilities with vector search
* Best practices and optimization strategies
Perfect for developers, AI enthusiasts, and tech leaders. Learn how to leverage MongoDB Atlas to deliver highly relevant, context-aware search results, transforming your data retrieval process. Stay ahead in tech innovation and maximize the potential of your applications.
#MongoDB #VectorSearch #AI #SemanticSearch #TechInnovation #DataScience #LLM #MachineLearning #SearchTechnology
Let's Integrate MuleSoft RPA, COMPOSER, APM with AWS IDP along with Slackshyamraj55
Discover the seamless integration of RPA (Robotic Process Automation), COMPOSER, and APM with AWS IDP enhanced with Slack notifications. Explore how these technologies converge to streamline workflows, optimize performance, and ensure secure access, all while leveraging the power of AWS IDP and real-time communication via Slack notifications.
In his public lecture, Christian Timmerer provides insights into the fascinating history of video streaming, starting from its humble beginnings before YouTube to the groundbreaking technologies that now dominate platforms like Netflix and ORF ON. Timmerer also presents provocative contributions of his own that have significantly influenced the industry. He concludes by looking at future challenges and invites the audience to join in a discussion.
2. Microsoft BI Vision Improving organizations by providing business insights to all employees leading to better, faster, more relevant decisions Complete and integratedBI and PerformanceManagement offering Agile products that adapt tohow you need the information Built on a trusted partof your IT backbone
3. The Microsoft BI Solution Stack BUSINESS USER EXPERIENCE BUSINESS COLLABORATION PLATFORM Data Infrastructure & BI Platform Analysis Services Reporting Services Master Data Services Integration Services Data Mining Data Warehousing DATA INFRASTRUCTURE & BI PLATFORM
4. The Microsoft BI Solution Stack BUSINESS USER EXPERIENCE Business Productivity Infrastructure Dashboards & Scorecards Excel Services Web based forms & workflow Collaboration Search Content Management LOB data integration PowerPivot for SharePoint BUSINESS COLLABORATION PLATFORM DATA INFRASTRUCTURE & BI PLATFORM
5. The Microsoft BI Solution Stack Delivered through a Familiar Interface Self-Service access & insight Data exploration & analysis Predictive analysis Data visualization Contextual visualization BUSINESS USER EXPERIENCE BUSINESS COLLABORATION PLATFORM DATA INFRASTRUCTURE & BI PLATFORM
6. SQL Server 2008 R2 BI Technologies IT PROFESSIONALS BUSINESS DECISIONMAKERS INFORMATIONWORKERS POWER USERS DEVELOPERS MICROSOFT BI PLATFORM
7. The Business Intelligence Continuum Empowered Aligned Team BI Personal BI Organizational BI Our Context BI Solution created by power user. Context is for a small team & it’s managed on a server. My Context BI solution created by user. Context is only for user & exists as document. The Org’s Context BI Solution created by IT, Established corporate context & is reusable, scalable and backed up. SQL Server 2008 R2 extends reach from organizational BI to team and personal BI
8. Introducing PowerPivotTechnology PowerPivot for Excel PowerPivot for SharePoint “PowerPivoting” Massive Data Volumes With a few mouse clicks, a user can create and publish intuitive and interactive self-service analysis solutions.
Purpose of the Slide: Introduce the Microsoft BI vision “Improving organizations by providing business insights to all employees leading to better, faster, more relevant decisions.”Key Points: A trusted BI platform is critical for a business intelligence solution to work today. If we’re going to achieve the promise of BI, we need to providing business insights to all employees.Emphasize ALL employees in the Microsoft BI vision.Conclusion: With Microsoft, customers get all required technologies from a single source. With other BI solutions, customers need 3-4-6-10 different products.
Purpose of the slideHere is the solution, show some detail on how we think of the BI architecture in 3 main layers. Point out that self-service analysis takes place in Office and SharePoint, but the Business Intelligence Platform is there to take popular user-generated solutions and convert them into full organizational solutions.Key Points: A trusted BI platform is critical for a business intelligence solution to work today. If we’re going to achieve the promise of BI, we need to have the confidence and trust in the data, we need to know where it came from, and that it is both timely and reliable for us to use to make a decision. That’s where the power of an integrated BI platform like SQL Server comes into play.Once you have the data ready to use, the middle tier comes into play, where business users actually interact with the data and turn it into something that is useful to them to make the right decision. The numbers that we pull from other systems are just that—we need applications and content to turn them into actionable items—and that’s where the middle tier comes into play. Finally, we need the right tools and applications to ensure that we can use that data in the way we want to in order to make our decisions. Applications and tools that range from personal, to team, to organizational and corporate tools, all with a familiar look and feel, all integrated and working with my Operating system, email, Internet search function. And this is what the power of integration through Microsoft Office brings you. From the Office productivity tools like Excel, through to the team and collaboration tools of SharePoint. By integrating BI seamlessly into a broader business productivity suite that includes search, collaboration, unified communications, and content management, we offer the end user a much richer experience.Conclusion: Our better together (Microsoft BI) story is real!
Purpose of the slideDiscuss the key technologies included in SQL Server 2008 R2 and show how these technologies together create the foundation of the Microsoft BI platform.Key Points: Integration Services (SSIS) provides a scalable enterprise data integration platform with exceptional Extract, Transform, Load (ETL) and integration capabilities, enabling organizations to more easily manage data from a wide array of data sourcesMaster Data Services (MDS) enables organizations to start with simple solutions for analytic or operational requirements, and then adapt the solutions to additional requirements incrementallyThe latest version of SQL Server from Microsoft SQL Server 2008 offers hundreds of new DBMS features that boost the productivity of database administrators and developers, improve support for larger databases, and enhance securityReporting Services (SSRS) provides a full range of ready-to-use tools and services to help you create, deploy, and manage reports for your organization, as well as programming features that enable you to extend and customize your reporting functionalityAnalysis Services (SSAS) delivers online analytical processing (OLAP) and data mining functionality for business intelligence applicationsConclusion: With SQL Server 2008 R2 customers get all the technologies needed to build a reliable and secure BI platform. SQL Server 2008 R2 has the strongest combination of price/performance, manageability, security, and DBA productivity.
Purpose of the slideExplain that SQL Server 2008 R2 covers the entire BI continuum by extending the reach of the technologies from organizational BI through team and personal BI. Key Points: SQL Server 2008 R2 includes all the technologies and tools necessary to create and deliver BI solutions that are centrally developed and maintained by ITFor team BI solutions, SQL Server 2008 R2 integrates seamlessly with Microsoft SharePoint Server 2010, both through Reporting Services in integrated mode and PowerPivot/Analysis Services for SharePointSQL Server PowerPivot for Excel 2010 is the key enabler for personal BI and in conjunction with SQL Server 2008 R2 and SharePoint Server 2010, PowerPivot provides the foundation for managed self-service BI offeringsConclusion: In order to cover the entire BI continuum, customers should use SQL Server 2008 R2, SharePoint Server 2010, and SQL Server PowerPivot.
Purpose of the slideClarify that Microsoft SQL Server PowerPivot technology includes both an Excel add-in and server-based technology that integrates with SharePoint Server 2010. Key Points: SQL Server PowerPivot for Excel 2010 is a data analysis add-in that delivers unmatched computational power directly within Microsoft Excel SQL Server PowerPivot for Excel 2010 is available for download free of charge at www.powerpivot.com. SQL Server PowerPivot for SharePoint integrates with Excel Services on the SharePoint server to enable seamless and secure sharing and collaboration on user-generated BI solutions directly in the browserSQL Server PowerPivot for SharePoint is included in SQL Server 2008 R2Conclusion: SQL Server PowerPivot technology is the key to managed self-service BI, empowering users, enabling seamless and secure sharing and collaboration on user-generated BI solutions , and helping IT organizations increase efficiency through the PowerPivot Management Dashboard.
Purpose of the slideShow SQL Server PowerPivot for Excel 2010 and SQL Server Reporting Services in action. Key Points: PowerPivot for Excel 2010 leverages familiar Excel features, such as the Office Fluent user interface, PivotTables, PivotCharts, and slicers, and new Data Analysis Expressions (DAX) in familiar Excel formula syntax.Process millions of rows in about the same time as thousands, and make the most of multi-core processors and gigabytes of memory for fastest processing of calculationsFast scrolling, filtering, sorting, and “blink of an eye” aggregation on the flySQL Server Reporting Services data feeds can encapsulate enterprise systems and shared PowerPivot workbooks can serve as data sources in new analysesColumn-based compression, the in-memory BI engine available with PowerPivot for Excel, and powerful DAX expressions can cover even the most demanding and advanced data analysis needsUsers can consolidate meaningful information from a multitude of sources, including relational databases, multidimensional sources, cloud services, data feeds, Excel files, text files, and data from the WebConclusion: With PowerPivot for Excel 2010, users hit the ground running because they already know the Excel features, can use virtually unlimited data sources, and new DAX expressions in familiar Excel formula syntax.