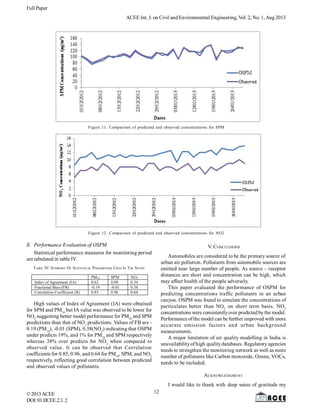
SlideShare a Scribd company logo
1 of 8
Download to read offline
Full Paper
ACEE Int. J. on Civil and Environmental Engineering, Vol. 2, No. 1,Aug 2013
©2013ACEE
DOI:01.IJCEE.2.1.2
UrbanAirQualityModelling and Simulation:ACase
Study of Kolhapur (M.S.), India
Yogesh Sathe1
, Atul Ayare2
, and Girish Kulkarni1
1
Department of Technology, Shivaji University, Kolhapur, Maharashtra, INDIA
Email: yvsathe14@gmail.com, girish.kulkarni@gmail.com
2
Department of Environmental Engineering, K.I.T.’s College ofEngineering, Kolhapur, Maharashtra, INDIA
Email: atul_ayare@yahoo.com
Abstract— As a consequence of urbanization a phenomenal
surge has been observed in the vehicular population in India,
giving rise to elevated levels of traffic related pollutants like
carbon monoxide, nitrogen oxides, hydrocarbons, and
particulates in Indian urban centers. These pollutants can
have both acute and chronic effects on human health. Thus
air quality management needs immediate attention. Air
quality models simulate the physical and chemical processes
occurring in the atmosphere to estimate the atmospheric
pollutant concentration. A variety of air quality models are
available ranging from simple empirical models to complex
Computational Fluid Dynamic (CFD) models. Air quality
models can be a valuable tool in pollution forecasting, air
quality management, traffic management and urban planning.
This paper evaluates the performance of widely used Danish
Operational Street Pollution Model (OSPM) under Indian
traffic conditions. Comparison between predicted and observed
concentrations was performed using both quantitative and
statistical methods. OSPM was found to perform exceedingly
well for the prediction of particulates whereas NO2
predictions
were poorly predicted.
Index Terms— Vehicular Emissions; Air quality; Air quality
models; Street canyon.
I. INTRODUCTION
Hasty economic growth in the course of urban
development iscausing serious air pollution problems in many
cities throughout India. A phenomenal surge has been
observed in vehicular population in Indian cities leading to
highest ambient concentrations in the congested streets [1].
As a consequence of urban development, along with
energy, the transport sector has been the centre of attention
during last decade. The transport sector in India consumes
about 16.9% i.e. 36.5 million tonnes of oil equivalent (mtoe)
of total energy. Among different types of motor vehicles,
percentage of two wheelers has shown rapid growth and it
constitutes 70% of total motor vehicles of India [2].
According to source apportionment studies conducted
by Central Pollution Control Board (CPCB), India; in cities
like Delhi, Kanpur, Bangalore, Pune, Chennai, Mumbai,
transport sector contributes to more than 30% of the ambient
air pollution. These contributions are either direct from
vehicular exhaust or indirect through resuspension of road
dust due to vehicular movement. Even in manyofthe two tier
cities in India, traffic and inadequate infrastructure facilities
are responsible for higher local air pollution levels [3]. The
higher contribution of transportation sector to air pollution
in India can be attributed to predominance of older vehicles
in the fleet, inadequate inspection and maintenance; further
improper traffic management system, road conditions,
absence of effective mass rapid transport system and intra-
city railway networks have aggravated this situation [4].
Considering the continual traffic growth and emissions
and their impact on human health and urban air qualitythere
is an urgent need for a regulatory framework for the
management oftraffic, air qualityand emissions at local level,
aswell as at regional and national scales [5].Air qualitymodels
can help to develop air qualitymanagement action plans and
serves as an effective tool for improving air quality in urban
centers.
Air quality models predict the dispersion and dilution
processes of the pollutants in the atmosphere using the
emissions, prevailing meteorological conditions and street
configurations to determine the ambient air concentrations
[6]. A variety of line source and street canyon models are
now available, starting from simple empirical models to
complex Computational Fluid Dynamic (CFD) models [7, 8,
9].
This paper discusses the current scenario of the
transportation sector in terms of air pollution and reviews
the air quality modelling studies conducted in India. Future
scope for air quality modelling and simulation is also
discussed.
II. HEALTH EFFECTS OF TRAFFIC ORIGINATED AIR POLLUTANTS
Atmospheric pollutants can cause both acute and chronic
effects on human health. CO is a suffocating pollutant which
reacts with hemoglobin in the blood forming carboxy
hemoglobin (COHb) and therebyreduces the oxygen carrying
capacity of blood. Short-term exposure to high CO
concentrations can cause an acutehealth impact [10]. Benzene
compounds have a cumulative effect on human health. Long-
term exposure to high benzene levels can cause risk ofcancer.
Oxides of nitrogen are responsible for both short and long-
term health effects likealteredlungfunction, respiratoryillness
and lung tissue damage [13].
Particle size is an important consideration because
particles in certain size ranges have profound effect on human
health. Fig. 1, shows the deposition of particles in the
respiratorysystem. Smaller the size of the particle it is likely
to penetrate deeper in the lungs. Particles greater than 100
6
Full Paper
©2013ACEE
DOI:01.IJCEE.2.1.
ACEE Int. J. on Civil and Environmental Engineering, Vol. 2, No. 1,Aug 2013
2
Figure 1. Respiratory Collection of Particles [11]
µm are typicallynot inhaled, while smaller particles, typically
less than 4 µm, can interfere with oxygen gas-exchange in the
lung alveolar region [14].
Respirable Particulate Matter (PM10
) and Fine Particulate
Matter (PM2.5
) have been found to associate with increased
mortalityand asthma [15, 16]. Ultrafine particles (PM1
) can
cause cardiopulmonary diseases, cardiovascular diseases,
and respiratory diseases [12].
III. DESCRIPTION OF THE STUDY AREA
Kolhapur cityis located in Maharashtra state (INDIA) at
16°42’N 74°13’ Eÿþ/ 16.7; 74.22. It has an average elevation
of 545 meters (1788 ft). The geographical area of the district
is 7685 km2
. This research work concentrates on the studyof
a section of Station Road (Fig.2), which runs through the
heart of Kolhapur cityand comprises one ofthe busiest routes
towards the city centre.
As street configuration and structures nearby affect the
air flow and thereby influence dispersion and dilution
processes within the streets. Table I presents details of street
configuration.
TABLE I. DETAILS OF STREET CONFIGURATION
Figure 2. Location of the study area
Length of the street 130 m
Width of the street 32.97 m
Average height of buildings 13 m
Orientation of the street 680
to the North
Height to Width Ratio (Aspect ratio) 0.4
Length to Height ratio 10
IV. METHODOLOGY
This section explains the experimental and computational
methodology used to investigate and evaluate the
performanceofthe employedair qualitymodel. Fig. 3, presents
an outline of steps necessary for air quality modeling study.
The study was divided into two major parts: air quality
modelling and ambient sampling.Air qualitymodelling uses
various dispersion models to predict the hourlyconcentration
of pollutants in the street. Such model requires input data
such as Traffic data, Emission factors, Meteorological
parameters (ambient temperature, wind speed and direction,
etc.) [17], Street geometry i.e. length and width of streets,
Height of buildings, Angle between street and wind direction,
etc., and background concentration of pollutants. Using the
7
Full Paper
ACEE Int. J. on Civil and Environmental Engineering, Vol. 2, No. 1,Aug 2013
©2013ACEE
DOI:01.IJCEE.2.1.
mathematical framework dispersion models calculate the
pollutant concentrations at desired receptor locations.
The second part deals with the ambient sampling and
analysis to determine the pollutant concentrations in the
street. Predicted and observed concentrations are used for
statistical analysis of dispersion models validation. Results
of this study can be used for assessing roadside air quality
by providing predictions of present and future air pollution
levels as well as temporal and spatial variations.
2
Figure 3. Framework for Air Quality Modelling Study
A. Operational Street Pollution Model (OSPM)
Figure 4. Schematic illustration of basic model principles used in
OSPM
Operational Street Pollution Model [18] evolved from the
Canyon Plume Box Model (CPBM). OSPM is a parameterized,
semi-empirical model which can be used to calculate
concentrations of vehicular pollutants on both leeward and
windward sides of a street canyon. Fig. 4, illustrates the basic
principles used in OSPM. OSPM calculates contribution from
i) direct vehicular exhaust ii) recirculation of pollutant within
canyon due to vortex formation and iii) background
concentration [7]. OSPM uses Gaussian plume model to
calculate direct contribution from vehicular exhaust whereas
recirculation is modeled using a box model technique. OSPM
models turbulence in the street considering wind turbulence
and traffic induced turbulence [19].
The input data required byOSPMinclude: Trafficvolume,
Source strength, Meteorological data such as wind speed
and direction at 10m height, Solar radiation data, Canyon
geometry such as length, width and orientation of the street
and height of buildings surrounding street and Background
concentrations. The latest versions of OSPM can predict
hourly concentrations for CO, NOx, Ozone, VOC, and
Particulates.
B. Traffic Data
Air quality models require detailed information on traffic
volume, fleet composition, and average travel speed. Traffic
volume data are hourly average values of manual counts
performed at selected street during the studyperiod. Traffic
counts were performed everydayduring 1st December, 2012
to 31st
January, 2013 and the time span chosen for study is
everyday9:00to13:00(Morning)and16:00 to20:00(Evening)
to capture the peak hours.
C. Emissions
Vehicular emissions were calculated using the hourlytraffic
volume and the average emission factors. The source strength
was computed for each of the pollutant as:
Q (g - km-1
hr-1
) = N (hr-1
) x EF (g - km-1
)
In the present study, average emission factors were
compiled from various literatures including regulatory
agencies like Central Pollution Control Board (CPCB) and
TABLE II. SUMMARY OF EMISSION FACTORS USED IN THE STUDY(G/Km)
Vehicle Category NOx SPM PM10
Two Wheelers 0.19 0.05 0.10
Three Wheelers 1.28 0.20 0.20
Passenger Cars
(Gasoline)
0.20 0.03 0.10
Passenger Cars
(Diesel)
0.50 0.07 1.00
Light Duty Vehicles 2.00 0.56 1.25
Heavy Duty Vehicles 6.30 0.28 2.00
Buses 12.00 0.56 1.50
research institutes likeAutomotive Research Association of
India (ARAI), National Environmental Engineering Research
Institute (NEERI), etc. Asummaryofchosen emission factors
is provided in the table II.
D. Meteorological Data
Meteorological data for this research work is collected
using an Automatic Weather Station (AWS) (Oregon
Scientific, Model: WMR200) which provided with the
8
Full Paper
©2013ACEE
DOI:01.IJCEE.2.1.
ACEE Int. J. on Civil and Environmental Engineering, Vol. 2, No. 1,Aug 2013
prevailing meteorological conditions at the measurement site.
The meteorological parameters monitored include:
Temperature, Wind speed (Rooftop level), and Wind
Direction.
E. Urban Background Measurements
The background concentration of pollutants plays a vital
role in urban air quality modeling. Rooftop measurement
method is employed to determine the background
concentration of pollutants under consideration namelyPM10
,
SPM and NO2
. Background concentrations were determined
using High volume method. OSPM further requires
background concentration of ozone as input, due to
unavailability of resources for measurement of ozone a
constant value of21.15 ppbhas been used for the calculations
[20].
F. Ambient Sampling and Analysis
Measurement and monitoring for the selected traffic
originated pollutants namely: Particulates and Nitrogen
dioxide is carried out during the months of December 2012
and January 2013. Particulates concentration is determined
gravimetrically using high volume method. Air is drawn
through a size-selective inlet and through a 20.3 X 25.4 cm (8
X 10in) whatmann filter at a flowrateof1132 L/min. Particles
with aerodynamic diameter less than the cut-point ofthe inlet
are collected, by the filter. The mass of these particles is
determined by the difference in filter weights prior to and
after sampling. The concentration of SPM and PM10
in the
designated size range is calculated by dividing the weight
gain of the filter bythe volume of air sampled [22].
Concentration of ambient nitrogen dioxide is determined
by Modified Jacobs & Hochheiser Method [22]. Ambient
nitrogen dioxide (NO2
) is collected bybubbling air through a
solution of sodium hydroxide and sodium arsenite. The
concentration of nitrite ion (NO-2
) produced during sampling
is determined colorimetrically byreacting the nitrite ion with
phosphoric acid, sulfanilamide, and N-(1-naphthyl)-
ethylenediamine di-hydrochloride (NEDA) andmeasuringthe
absorbance of the highly coloured azodye at 540 nm [22].
G. Statistical Analysis
Model performance was evaluated using statistical
analysis. The statistical parameters used here includes: Index
of agreement, Correlation coefficient, and Fractional bias as
defined in table III.
IA value indicates the degree to which observed
concentrations are accurately predicted bythe model. In other
words, it is a measure of degree towhich the model predictions
are error free [23]. Correlation coefficient (R), explains the
degree to which fluctuations in observed concentrations are
followed by fluctuations in predicted concentrations. It varies
between +1 < R< -1, where ±1 indicating a perfect correlation
and 0 indicating no correlation at all [24]. FBis a measure of
agreement between mean concentrations and it ranges
between +2 and -2 [6].
2
IV. RESULTS AND DISCUSSION
A. Emission Rates from Automobiles
Fig. 5, shows the scale map of observed traffic during
monitoring period. Two wheelers were observed to be
dominating throughout the monitoring period with a
percentage of 56% followed by passenger cars (29%). Light
Diesel Vehicles (LDV) was observed to be minimum with a
percentage of 2%. It is evident from the above distributions
that two wheelers and passenger cars comprise predominant
source of exhaust emissions and also mechanical turbulence
in the confined urban environment.
Contribution to air pollution from automobiles is
generated using traffic density and emission factors. The
results obtained are shown in the Fig. 6. Emission rates are
observed to follow the trend of traffic density in the street.
As emission factor for NOx are higher, emission rates of NOx
are observed to be dominating during the monitoring period.
TABLE III. STATISTICAL PARAMETERS
Figure 5. Scale map of traffic during monitoring period
B. Meteorological Data
The study was carried out during the winter season and
average ambient temperature during the monitoring period
was found to be 27.30
C. Fig. 7, shows the variation in the
temperature during monitoring period.
Hourly wind speed and direction data were collected at
the monitoring site. Fig. 8, shows the windrose diagrams for
9
Full Paper
ACEE Int. J. on Civil and Environmental Engineering, Vol. 2, No. 1,Aug 2013
©2013ACEE
DOI:01.IJCEE.2.1.
the monitoring site. It was observed that, North-Westerly
(NW)winds predominate during themonitoring period. These
prevailing wind flowsare perpendicular or near-perpendicular
to the street canyon axis.
C. Urban Background Measurements
As urban background measurements plays a crucial role
in urban air quality modelling, providing hourly urban
background air quality data is the greatest challenge. As
discussed earlier rooftop measurement method was employed
to determine the background concentrations of selected
pollutants. Due to unavailability of resources for NO
measurement, concentrations of NOx were determined
mathematicallyassuming NOx/NO2
ratioof 1.32 [20].
Fig. 9, presents variations in the background
concentrations of the pollutants (PM10
, SPM, NO2
and NOx).
As chosen monitoring period was winter season, often a
higher background concentration of pollutants were observed
2
Figure 6. Emission rates from automobiles during monitoring period
Figure 7. Trend of temperature during monitoring period
due to prevailing stable atmospheric conditions.
D. Air Quality Modelling
Air quality modelling involves assessment of traffic
originated pollutants (PM10
, SPM, NO2
) at selected urban
street canyon site, using Operational Street Pollution Model
(OSPM). Air quality in street was monitored during the
selected monitoring period and it is compared with predicted
concentrations obtained with OSPM. Details on emission
rates, Meteorological data, Street configuration, and urban
background concentrations are used as input to the model in
required units. Further for modeling NOx chemistry, a
photolysis rate constant is taken JNO2
= 0.015 s-1
and NO/NO2
ratio=0.32[20, 21].
It was observed that the models produce a mixed nature
of predictions for different pollutants. When comparing con-
centrations on a day to day basis model was found to per-
form well for PM10
and SPM but for NO2
predictions a poor
10
Full Paper
©2013ACEE
DOI:01.IJCEE.2.1.
ACEE Int. J. on Civil and Environmental Engineering, Vol. 2, No. 1,Aug 2013
2
Figure 8. Windrose plot for study location during monitoring period
model performance was observed. Fig. 10, 11 and 12, shows
the comparative performance of OSPM for modelling PM10
,
SPM and NO2
concentrations respectively.
OSPM was found to under predict PM10
concentrations
but a good correlation was observed between predicted and
observed SPM concentrations. The reason for under-
prediction of particulates might be the emission factors
considered in the study are purely based on exhaust
emissions, no considerations has been given for inclusion of
non-exhaust particulate emissions like tyre wear. Another
additional reason might be the contribution of road side
resuspended dust to particulate concentrations.
NO2
values were observed to be over predicted
throughout the monitoring period. The reason for over-
prediction can be the use of higher NOx emission factors.
Further a constant value of background ozone concentration
is used to model NOx chemistry, due to unavailability of
background ozone concentrations in Kolhapur area.
Figure 9. Variations in urban background concentrations during monitoring period
Figure 10. Comparison of predicted and observed concentrations for PM10
11
Full Paper
ACEE Int. J. on Civil and Environmental Engineering, Vol. 2, No. 1,Aug 2013
©2013ACEE
DOI:01.IJCEE.2.1.2
Figure 11. Comparison of predicted and observed concentrations for SPM
Figure 12. Comparison of predicted and observed concentrations for NO2
E. Performance Evaluation of OSPM
Statistical performance measures for monitoring period
are tabulated in table IV.
TABLE IV. SUMMARY OF STATISTICAL PARAMETERS USED IN THE STUDY
PM10 SPM NO2
Index of Agreement (IA) 0.62 0.98 0.34
Fractional Bias (FB) -0.19 -0.01 0.38
Correlation Coefficient (R) 0.85 0.96 0.64
High values of Index of Agreement (IA) were obtained
for SPM and PM10
but IA value was observed to be lower for
NO2
suggesting better model performance for PM10
and SPM
predictions than that of NO2
predictions. Values of FB are -
0.19 (PM10
), -0.01 (SPM), 0.38(NO2
) indicating that OSPM
under predicts 19%, and 1% for PM10
and SPM respectively
whereas 38% over predicts for NO2
when compared to
observed value. It can be observed that Correlation
coefficients for 0.85, 0.96, and 0.64 for PM10
, SPM, and NO2
respectively, reflecting good correlation between predicted
and observed values of pollutants.
V. CONCLUSIONS
Automobiles are considered to be the primary source of
urban air pollution. Pollutants from automobile sources are
emitted near large number of people. As source – receptor
distances are short and concentration can be high, which
may affect health of the people adversely.
This paper evaluated the performance of OSPM for
predicting concentrations traffic pollutants in an urban
canyon. OSPM was found to simulate the concentrations of
particulates better than NO2
on short term basis. NO2
concentrations were consistentlyover predicted bythe model.
Performance ofthe model can be further improved with more
accurate emission factors and urban background
measurements.
A major limitation of air quality modelling in India is
unavailabilityof high qualitydatabases. Regulatoryagencies
needs to strengthen the monitoring network as well as more
number of pollutants like Carbon monoxide, Ozone, VOCs,
needs to be included.
ACKNOWLEDGMENT
I would like to thank with deep sense of gratitude my
12
Full Paper
©2013ACEE
DOI:01.IJCEE.2.1.
ACEE Int. J. on Civil and Environmental Engineering, Vol. 2, No. 1,Aug 2013
2
guides Prof. Atul Ayare, Head and Associate Professor at
Department of Environmental Engineering, KIT’s College of
Engineering, Kolhapur, Maharashtra, INDIAand Dr. Girish
Kulkarni, Director, Department of Technology, Shivaji
University, Kolhapur, Maharashtra, INDIAfor their valuable
suggestions and timely help given to me during this work.
REFERENCES
[1] Central Pollution Control Board (CPCB), India Website:
www.cpcb.nic.in
[2] Ramachandra, T.V., Shwetmala, Emissions from India’s
transport sector: Statewise synthesis. Atmospheric
Environment, (2009). 43 (34): 5510–5517.
[3] Guttikunda, S., Jawahar, P., Road Transport in India 2010-30:
Emissions, Pollution & Health Impacts. Simple Interactive
Models for Better Air Quality, (2010). 13: 1 -6.
[4] CPCB. Guidelines for Ambient Air Quality Monitoring. (2003).
National Ambient Air Quality Monitoring Series, Central
Pollution Control Board, Delhi, India.
[5] Costabile, F., Allegrini, I., A new approach to link transport
emissions and air quality:An intelligent transport system based
on the control of traffic air pollution. Environmental Modelling
& Software, (2008). 23: 258 – 267.
[6] Ganguly, R., Broderick, B. M., Estimation of CO concentrations
for an urban street canyon in Ireland. Air Qual Atmos Health,
(2010). 3:195–202.
[7] Vardoulakis, S., Fisher, B.E.A., Pericleous, K., Gonzalez-Flesca,
N., Modeling air quality in street canyons: a review.
Atmospheric Environment, (2003). 37: 155–182.
[8] Holmes, N.S., Morawska, L., A review of dispersion modelling
and its application to the dispersion of particles: An overview
of different dispersion models available. Atmospheric
Environment, (2006). 40: 5902–5928
[9] Sharma, P., Khare, M., Modelling of vehicular exhausts—a
review. Transportation Research-D, (2001). 6:179–198.
[10] Warner, C.F., Davis, W.T., Wark, K., Air Pollution: Its Origin
and Control (3rd ed.). (1998). Addison-Wesley-Longman,
Boston, MA.
[11] Godish, T., Air Quality (4th ed.). (2004), Lewis Publishers
[12] WHO. Health effects of transport-related air pollution. (2005).
World Health Organization (Europe). ISBN 92-890-1373-7
[13] Nurul Amin, A.T.M., Reducing emissions from private cars:
incentive measures for behavioural change. (2009).United
Nations Environment Programme (UNEP).
[14] US EPA. Atmospheric Sampling Course (APTI 435).
(1980).U.S. Environmental Protection Agency, Research
Triangle Park, NC
[15] Dockery, D.W., Pope, C.A., Acute respiratory effects of
particulate air pollution. Annual Reviews of Public Health,
(1994). 15:107–132.
[16] Anderson, K.R., Avol, E.L., Edwards, S.A., Shamoo, D.A.,
Peng, R.C., Linn, W.S., Hackney, J.D., Controlled exposures
of volunteers to respirable carbon and sulfuric acid aerosols.
Journal of the Air and Waste Management Association, (1992).
42: 770–776.
[17] Mandurino, C., Vestrucci, P., Using meteorological data to
model pollutant dispersion in the atmosphere. Environmental
Modelling & Software, (2009). 24: 270–278.
[18] Hertel, O., Berkowicz, R., Modelling pollution from traffic in
a street canyon. Evaluation of data and model development.
(1989). NERI, Roskilde, Denmark.
[19] Mensink C., Lefebre F., Janssen L., Cornelis J., A comparison
of three street canyon models with measurements at an urban
station in Antwerp, Belgium. Environmental Modelling &
Software, (2006). 21: 514–519.
[20] Konar T.S., Chakrabarty S., Applicability of Caline4 model
for NOx in Kolkata Roadway. Journal of Civil and
Environmental Engineering, (2012).S1:005. doi:10.4172/2165-
784X.S1-005.
[21] Seinfeld, J.H., Pandis, S.N. Atmospheric chemistry and physics
(2nd
ed.). (2006). John Wiley & Sons, Inc.
[22] CPCB. Guidelines for the measurement of ambient air pollutants
– Volume I and Volume II. (2011). Central Pollution Control
Board (CPCB), New Delhi, INDIA.
[23] Gokhale S., Raokhande N., Performance evaluation of air quality
models for predicting PM10
and PM2.5
concentrations at urban
traffic intersection during winter period. Science of the Total
Environment, (2008). 394: 9 – 24.
[24] Marmur,A., Mamane, Y., Comparison and evaluation of several
mobile source and line source models. Transportation Research
Part D. (2003).8:249-265.
13

More Related Content

Viewers also liked

Fuel wastage and emission due to idling of vehicles at road traffic signals
Fuel wastage and emission due to idling of vehicles at road traffic signalsFuel wastage and emission due to idling of vehicles at road traffic signals
Fuel wastage and emission due to idling of vehicles at road traffic signalseSAT Journals
 
Traffic & air pollution
Traffic & air pollutionTraffic & air pollution
Traffic & air pollutionLaween Hamza
 
Alin Pohoata: "Multiple characterizations of urban air pollution time series ...
Alin Pohoata: "Multiple characterizations of urban air pollution time series ...Alin Pohoata: "Multiple characterizations of urban air pollution time series ...
Alin Pohoata: "Multiple characterizations of urban air pollution time series ...ifi8106tlu
 
Vehicular Pollution Management
Vehicular Pollution ManagementVehicular Pollution Management
Vehicular Pollution ManagementECRD2015
 
Pollution science school project
Pollution science school projectPollution science school project
Pollution science school projectNoor Sabah
 
Air pollution project
Air pollution projectAir pollution project
Air pollution projectJoeFigenshaw
 
Detail Urban Zones
Detail Urban ZonesDetail Urban Zones
Detail Urban Zoneswhiskeyhj
 
Implementation of Wireless Channel Model in MATLAB: Simplified
Implementation of Wireless Channel Model in MATLAB: SimplifiedImplementation of Wireless Channel Model in MATLAB: Simplified
Implementation of Wireless Channel Model in MATLAB: SimplifiedRosdiadee Nordin
 
Matlab simulink introduction
Matlab simulink introductionMatlab simulink introduction
Matlab simulink introductionAmeen San
 
anti theft vehicular security system
anti theft vehicular security systemanti theft vehicular security system
anti theft vehicular security systemAkshay Gaikwad
 
MATLAB and Simulink for Communications System Design (Design Conference 2013)
MATLAB and Simulink for Communications System Design (Design Conference 2013)MATLAB and Simulink for Communications System Design (Design Conference 2013)
MATLAB and Simulink for Communications System Design (Design Conference 2013)Analog Devices, Inc.
 
Introduction to Matlab
Introduction to MatlabIntroduction to Matlab
Introduction to MatlabAmr Rashed
 
Matlab Introduction
Matlab IntroductionMatlab Introduction
Matlab Introductionideas2ignite
 
Evaluation Of Vehicular Noise Pollution In The City Of Hebron, Palestine
Evaluation Of Vehicular Noise Pollution In The City Of Hebron, PalestineEvaluation Of Vehicular Noise Pollution In The City Of Hebron, Palestine
Evaluation Of Vehicular Noise Pollution In The City Of Hebron, PalestineIJMER
 
air pollution with case study
air pollution with case study air pollution with case study
air pollution with case study Kush Keshari
 
Simulation of Wireless Communication Systems
Simulation of Wireless Communication SystemsSimulation of Wireless Communication Systems
Simulation of Wireless Communication SystemsBernd-Peter Paris
 

Viewers also liked (18)

Fuel wastage and emission due to idling of vehicles at road traffic signals
Fuel wastage and emission due to idling of vehicles at road traffic signalsFuel wastage and emission due to idling of vehicles at road traffic signals
Fuel wastage and emission due to idling of vehicles at road traffic signals
 
Article
 Article Article
Article
 
Traffic & air pollution
Traffic & air pollutionTraffic & air pollution
Traffic & air pollution
 
Alin Pohoata: "Multiple characterizations of urban air pollution time series ...
Alin Pohoata: "Multiple characterizations of urban air pollution time series ...Alin Pohoata: "Multiple characterizations of urban air pollution time series ...
Alin Pohoata: "Multiple characterizations of urban air pollution time series ...
 
Vehicular Pollution Management
Vehicular Pollution ManagementVehicular Pollution Management
Vehicular Pollution Management
 
MATLAB INTRODUCTION
MATLAB INTRODUCTIONMATLAB INTRODUCTION
MATLAB INTRODUCTION
 
Pollution science school project
Pollution science school projectPollution science school project
Pollution science school project
 
Air pollution project
Air pollution projectAir pollution project
Air pollution project
 
Detail Urban Zones
Detail Urban ZonesDetail Urban Zones
Detail Urban Zones
 
Implementation of Wireless Channel Model in MATLAB: Simplified
Implementation of Wireless Channel Model in MATLAB: SimplifiedImplementation of Wireless Channel Model in MATLAB: Simplified
Implementation of Wireless Channel Model in MATLAB: Simplified
 
Matlab simulink introduction
Matlab simulink introductionMatlab simulink introduction
Matlab simulink introduction
 
anti theft vehicular security system
anti theft vehicular security systemanti theft vehicular security system
anti theft vehicular security system
 
MATLAB and Simulink for Communications System Design (Design Conference 2013)
MATLAB and Simulink for Communications System Design (Design Conference 2013)MATLAB and Simulink for Communications System Design (Design Conference 2013)
MATLAB and Simulink for Communications System Design (Design Conference 2013)
 
Introduction to Matlab
Introduction to MatlabIntroduction to Matlab
Introduction to Matlab
 
Matlab Introduction
Matlab IntroductionMatlab Introduction
Matlab Introduction
 
Evaluation Of Vehicular Noise Pollution In The City Of Hebron, Palestine
Evaluation Of Vehicular Noise Pollution In The City Of Hebron, PalestineEvaluation Of Vehicular Noise Pollution In The City Of Hebron, Palestine
Evaluation Of Vehicular Noise Pollution In The City Of Hebron, Palestine
 
air pollution with case study
air pollution with case study air pollution with case study
air pollution with case study
 
Simulation of Wireless Communication Systems
Simulation of Wireless Communication SystemsSimulation of Wireless Communication Systems
Simulation of Wireless Communication Systems
 

Similar to Urban Air Quality Modelling and Simulation: A Case Study of Kolhapur (M.S.), India

Urban Air Quality Modelling and Simulation: A Case Study of Kolhapur (M.S.), ...
Urban Air Quality Modelling and Simulation: A Case Study of Kolhapur (M.S.), ...Urban Air Quality Modelling and Simulation: A Case Study of Kolhapur (M.S.), ...
Urban Air Quality Modelling and Simulation: A Case Study of Kolhapur (M.S.), ...IDES Editor
 
IRJET- Analytical Evaluation of Vehicular Air Pollutants at Urban Arterial Ro...
IRJET- Analytical Evaluation of Vehicular Air Pollutants at Urban Arterial Ro...IRJET- Analytical Evaluation of Vehicular Air Pollutants at Urban Arterial Ro...
IRJET- Analytical Evaluation of Vehicular Air Pollutants at Urban Arterial Ro...IRJET Journal
 
APPLYING FIXED BOX MODEL TO PREDICT THE CONCENTRATIONS OF (PM10) IN A PART OF...
APPLYING FIXED BOX MODEL TO PREDICT THE CONCENTRATIONS OF (PM10) IN A PART OF...APPLYING FIXED BOX MODEL TO PREDICT THE CONCENTRATIONS OF (PM10) IN A PART OF...
APPLYING FIXED BOX MODEL TO PREDICT THE CONCENTRATIONS OF (PM10) IN A PART OF...IAEME Publication
 
AMBIENT AIR POLLUTION MODELLING IN PUDUCHERRY, INDIA
AMBIENT AIR POLLUTION MODELLING IN PUDUCHERRY, INDIAAMBIENT AIR POLLUTION MODELLING IN PUDUCHERRY, INDIA
AMBIENT AIR POLLUTION MODELLING IN PUDUCHERRY, INDIAJournal For Research
 
A Review Article on "Environmental Impact Assessment" (Eia)
A Review Article on "Environmental Impact Assessment" (Eia)A Review Article on "Environmental Impact Assessment" (Eia)
A Review Article on "Environmental Impact Assessment" (Eia)IRJET Journal
 
IRJET - Influence of Vehicular Traffic on Urban Air Quality- Coimbatore City
IRJET -  	  Influence of Vehicular Traffic on Urban Air Quality- Coimbatore CityIRJET -  	  Influence of Vehicular Traffic on Urban Air Quality- Coimbatore City
IRJET - Influence of Vehicular Traffic on Urban Air Quality- Coimbatore CityIRJET Journal
 
Analysis Of Highway Air Pollution
Analysis Of Highway Air PollutionAnalysis Of Highway Air Pollution
Analysis Of Highway Air PollutionJoe Andelija
 
Time Series Analysis to Forecast Air Quality Indices in Thiruvananthapuram Di...
Time Series Analysis to Forecast Air Quality Indices in Thiruvananthapuram Di...Time Series Analysis to Forecast Air Quality Indices in Thiruvananthapuram Di...
Time Series Analysis to Forecast Air Quality Indices in Thiruvananthapuram Di...IJERA Editor
 
CALIBRATION OF VEHICLE EMISSIONS-SPEED RELATIONSHIPS FOR THE GREATER CAIRO ROADS
CALIBRATION OF VEHICLE EMISSIONS-SPEED RELATIONSHIPS FOR THE GREATER CAIRO ROADSCALIBRATION OF VEHICLE EMISSIONS-SPEED RELATIONSHIPS FOR THE GREATER CAIRO ROADS
CALIBRATION OF VEHICLE EMISSIONS-SPEED RELATIONSHIPS FOR THE GREATER CAIRO ROADSIAEME Publication
 
Selection of optimal air pollution control strategies
Selection of optimal air pollution control strategiesSelection of optimal air pollution control strategies
Selection of optimal air pollution control strategieseSAT Journals
 
Air Quality Study on measeurement tools.pptx
Air Quality Study on measeurement tools.pptxAir Quality Study on measeurement tools.pptx
Air Quality Study on measeurement tools.pptxRAJA SEKHAR MAMILLAPALLI
 
Accident prediction modelling for an urban road of bangalore
Accident prediction modelling for an urban road of bangaloreAccident prediction modelling for an urban road of bangalore
Accident prediction modelling for an urban road of bangaloreeSAT Publishing House
 
IRJET- Study on Vehicular Emission in Trivandrum Urban Centre
IRJET- Study on Vehicular Emission in Trivandrum Urban CentreIRJET- Study on Vehicular Emission in Trivandrum Urban Centre
IRJET- Study on Vehicular Emission in Trivandrum Urban CentreIRJET Journal
 
IRJET- Performance Study of Modelling Urban Traffic Air Pollution Dispersion
IRJET-  	  Performance Study of Modelling Urban Traffic Air Pollution DispersionIRJET-  	  Performance Study of Modelling Urban Traffic Air Pollution Dispersion
IRJET- Performance Study of Modelling Urban Traffic Air Pollution DispersionIRJET Journal
 
IRJET - Air Quality Index – A Study to Assess the Air Quality
IRJET - Air Quality Index – A Study to Assess the Air QualityIRJET - Air Quality Index – A Study to Assess the Air Quality
IRJET - Air Quality Index – A Study to Assess the Air QualityIRJET Journal
 

Similar to Urban Air Quality Modelling and Simulation: A Case Study of Kolhapur (M.S.), India (20)

Urban Air Quality Modelling and Simulation: A Case Study of Kolhapur (M.S.), ...
Urban Air Quality Modelling and Simulation: A Case Study of Kolhapur (M.S.), ...Urban Air Quality Modelling and Simulation: A Case Study of Kolhapur (M.S.), ...
Urban Air Quality Modelling and Simulation: A Case Study of Kolhapur (M.S.), ...
 
IRJET- Analytical Evaluation of Vehicular Air Pollutants at Urban Arterial Ro...
IRJET- Analytical Evaluation of Vehicular Air Pollutants at Urban Arterial Ro...IRJET- Analytical Evaluation of Vehicular Air Pollutants at Urban Arterial Ro...
IRJET- Analytical Evaluation of Vehicular Air Pollutants at Urban Arterial Ro...
 
Mt3422782294
Mt3422782294Mt3422782294
Mt3422782294
 
APPLYING FIXED BOX MODEL TO PREDICT THE CONCENTRATIONS OF (PM10) IN A PART OF...
APPLYING FIXED BOX MODEL TO PREDICT THE CONCENTRATIONS OF (PM10) IN A PART OF...APPLYING FIXED BOX MODEL TO PREDICT THE CONCENTRATIONS OF (PM10) IN A PART OF...
APPLYING FIXED BOX MODEL TO PREDICT THE CONCENTRATIONS OF (PM10) IN A PART OF...
 
AMBIENT AIR POLLUTION MODELLING IN PUDUCHERRY, INDIA
AMBIENT AIR POLLUTION MODELLING IN PUDUCHERRY, INDIAAMBIENT AIR POLLUTION MODELLING IN PUDUCHERRY, INDIA
AMBIENT AIR POLLUTION MODELLING IN PUDUCHERRY, INDIA
 
T4103123127
T4103123127T4103123127
T4103123127
 
A Review Article on "Environmental Impact Assessment" (Eia)
A Review Article on "Environmental Impact Assessment" (Eia)A Review Article on "Environmental Impact Assessment" (Eia)
A Review Article on "Environmental Impact Assessment" (Eia)
 
IRJET - Influence of Vehicular Traffic on Urban Air Quality- Coimbatore City
IRJET -  	  Influence of Vehicular Traffic on Urban Air Quality- Coimbatore CityIRJET -  	  Influence of Vehicular Traffic on Urban Air Quality- Coimbatore City
IRJET - Influence of Vehicular Traffic on Urban Air Quality- Coimbatore City
 
Analysis Of Highway Air Pollution
Analysis Of Highway Air PollutionAnalysis Of Highway Air Pollution
Analysis Of Highway Air Pollution
 
Aa04605173182
Aa04605173182Aa04605173182
Aa04605173182
 
Air Quality Monitoring Using Model: A Review
Air Quality Monitoring Using Model: A ReviewAir Quality Monitoring Using Model: A Review
Air Quality Monitoring Using Model: A Review
 
E1032434
E1032434E1032434
E1032434
 
Time Series Analysis to Forecast Air Quality Indices in Thiruvananthapuram Di...
Time Series Analysis to Forecast Air Quality Indices in Thiruvananthapuram Di...Time Series Analysis to Forecast Air Quality Indices in Thiruvananthapuram Di...
Time Series Analysis to Forecast Air Quality Indices in Thiruvananthapuram Di...
 
CALIBRATION OF VEHICLE EMISSIONS-SPEED RELATIONSHIPS FOR THE GREATER CAIRO ROADS
CALIBRATION OF VEHICLE EMISSIONS-SPEED RELATIONSHIPS FOR THE GREATER CAIRO ROADSCALIBRATION OF VEHICLE EMISSIONS-SPEED RELATIONSHIPS FOR THE GREATER CAIRO ROADS
CALIBRATION OF VEHICLE EMISSIONS-SPEED RELATIONSHIPS FOR THE GREATER CAIRO ROADS
 
Selection of optimal air pollution control strategies
Selection of optimal air pollution control strategiesSelection of optimal air pollution control strategies
Selection of optimal air pollution control strategies
 
Air Quality Study on measeurement tools.pptx
Air Quality Study on measeurement tools.pptxAir Quality Study on measeurement tools.pptx
Air Quality Study on measeurement tools.pptx
 
Accident prediction modelling for an urban road of bangalore
Accident prediction modelling for an urban road of bangaloreAccident prediction modelling for an urban road of bangalore
Accident prediction modelling for an urban road of bangalore
 
IRJET- Study on Vehicular Emission in Trivandrum Urban Centre
IRJET- Study on Vehicular Emission in Trivandrum Urban CentreIRJET- Study on Vehicular Emission in Trivandrum Urban Centre
IRJET- Study on Vehicular Emission in Trivandrum Urban Centre
 
IRJET- Performance Study of Modelling Urban Traffic Air Pollution Dispersion
IRJET-  	  Performance Study of Modelling Urban Traffic Air Pollution DispersionIRJET-  	  Performance Study of Modelling Urban Traffic Air Pollution Dispersion
IRJET- Performance Study of Modelling Urban Traffic Air Pollution Dispersion
 
IRJET - Air Quality Index – A Study to Assess the Air Quality
IRJET - Air Quality Index – A Study to Assess the Air QualityIRJET - Air Quality Index – A Study to Assess the Air Quality
IRJET - Air Quality Index – A Study to Assess the Air Quality
 

More from IDES Editor

Power System State Estimation - A Review
Power System State Estimation - A ReviewPower System State Estimation - A Review
Power System State Estimation - A ReviewIDES Editor
 
Artificial Intelligence Technique based Reactive Power Planning Incorporating...
Artificial Intelligence Technique based Reactive Power Planning Incorporating...Artificial Intelligence Technique based Reactive Power Planning Incorporating...
Artificial Intelligence Technique based Reactive Power Planning Incorporating...IDES Editor
 
Design and Performance Analysis of Genetic based PID-PSS with SVC in a Multi-...
Design and Performance Analysis of Genetic based PID-PSS with SVC in a Multi-...Design and Performance Analysis of Genetic based PID-PSS with SVC in a Multi-...
Design and Performance Analysis of Genetic based PID-PSS with SVC in a Multi-...IDES Editor
 
Optimal Placement of DG for Loss Reduction and Voltage Sag Mitigation in Radi...
Optimal Placement of DG for Loss Reduction and Voltage Sag Mitigation in Radi...Optimal Placement of DG for Loss Reduction and Voltage Sag Mitigation in Radi...
Optimal Placement of DG for Loss Reduction and Voltage Sag Mitigation in Radi...IDES Editor
 
Line Losses in the 14-Bus Power System Network using UPFC
Line Losses in the 14-Bus Power System Network using UPFCLine Losses in the 14-Bus Power System Network using UPFC
Line Losses in the 14-Bus Power System Network using UPFCIDES Editor
 
Study of Structural Behaviour of Gravity Dam with Various Features of Gallery...
Study of Structural Behaviour of Gravity Dam with Various Features of Gallery...Study of Structural Behaviour of Gravity Dam with Various Features of Gallery...
Study of Structural Behaviour of Gravity Dam with Various Features of Gallery...IDES Editor
 
Assessing Uncertainty of Pushover Analysis to Geometric Modeling
Assessing Uncertainty of Pushover Analysis to Geometric ModelingAssessing Uncertainty of Pushover Analysis to Geometric Modeling
Assessing Uncertainty of Pushover Analysis to Geometric ModelingIDES Editor
 
Secure Multi-Party Negotiation: An Analysis for Electronic Payments in Mobile...
Secure Multi-Party Negotiation: An Analysis for Electronic Payments in Mobile...Secure Multi-Party Negotiation: An Analysis for Electronic Payments in Mobile...
Secure Multi-Party Negotiation: An Analysis for Electronic Payments in Mobile...IDES Editor
 
Selfish Node Isolation & Incentivation using Progressive Thresholds
Selfish Node Isolation & Incentivation using Progressive ThresholdsSelfish Node Isolation & Incentivation using Progressive Thresholds
Selfish Node Isolation & Incentivation using Progressive ThresholdsIDES Editor
 
Various OSI Layer Attacks and Countermeasure to Enhance the Performance of WS...
Various OSI Layer Attacks and Countermeasure to Enhance the Performance of WS...Various OSI Layer Attacks and Countermeasure to Enhance the Performance of WS...
Various OSI Layer Attacks and Countermeasure to Enhance the Performance of WS...IDES Editor
 
Responsive Parameter based an AntiWorm Approach to Prevent Wormhole Attack in...
Responsive Parameter based an AntiWorm Approach to Prevent Wormhole Attack in...Responsive Parameter based an AntiWorm Approach to Prevent Wormhole Attack in...
Responsive Parameter based an AntiWorm Approach to Prevent Wormhole Attack in...IDES Editor
 
Cloud Security and Data Integrity with Client Accountability Framework
Cloud Security and Data Integrity with Client Accountability FrameworkCloud Security and Data Integrity with Client Accountability Framework
Cloud Security and Data Integrity with Client Accountability FrameworkIDES Editor
 
Genetic Algorithm based Layered Detection and Defense of HTTP Botnet
Genetic Algorithm based Layered Detection and Defense of HTTP BotnetGenetic Algorithm based Layered Detection and Defense of HTTP Botnet
Genetic Algorithm based Layered Detection and Defense of HTTP BotnetIDES Editor
 
Enhancing Data Storage Security in Cloud Computing Through Steganography
Enhancing Data Storage Security in Cloud Computing Through SteganographyEnhancing Data Storage Security in Cloud Computing Through Steganography
Enhancing Data Storage Security in Cloud Computing Through SteganographyIDES Editor
 
Low Energy Routing for WSN’s
Low Energy Routing for WSN’sLow Energy Routing for WSN’s
Low Energy Routing for WSN’sIDES Editor
 
Permutation of Pixels within the Shares of Visual Cryptography using KBRP for...
Permutation of Pixels within the Shares of Visual Cryptography using KBRP for...Permutation of Pixels within the Shares of Visual Cryptography using KBRP for...
Permutation of Pixels within the Shares of Visual Cryptography using KBRP for...IDES Editor
 
Rotman Lens Performance Analysis
Rotman Lens Performance AnalysisRotman Lens Performance Analysis
Rotman Lens Performance AnalysisIDES Editor
 
Band Clustering for the Lossless Compression of AVIRIS Hyperspectral Images
Band Clustering for the Lossless Compression of AVIRIS Hyperspectral ImagesBand Clustering for the Lossless Compression of AVIRIS Hyperspectral Images
Band Clustering for the Lossless Compression of AVIRIS Hyperspectral ImagesIDES Editor
 
Microelectronic Circuit Analogous to Hydrogen Bonding Network in Active Site ...
Microelectronic Circuit Analogous to Hydrogen Bonding Network in Active Site ...Microelectronic Circuit Analogous to Hydrogen Bonding Network in Active Site ...
Microelectronic Circuit Analogous to Hydrogen Bonding Network in Active Site ...IDES Editor
 
Texture Unit based Monocular Real-world Scene Classification using SOM and KN...
Texture Unit based Monocular Real-world Scene Classification using SOM and KN...Texture Unit based Monocular Real-world Scene Classification using SOM and KN...
Texture Unit based Monocular Real-world Scene Classification using SOM and KN...IDES Editor
 

More from IDES Editor (20)

Power System State Estimation - A Review
Power System State Estimation - A ReviewPower System State Estimation - A Review
Power System State Estimation - A Review
 
Artificial Intelligence Technique based Reactive Power Planning Incorporating...
Artificial Intelligence Technique based Reactive Power Planning Incorporating...Artificial Intelligence Technique based Reactive Power Planning Incorporating...
Artificial Intelligence Technique based Reactive Power Planning Incorporating...
 
Design and Performance Analysis of Genetic based PID-PSS with SVC in a Multi-...
Design and Performance Analysis of Genetic based PID-PSS with SVC in a Multi-...Design and Performance Analysis of Genetic based PID-PSS with SVC in a Multi-...
Design and Performance Analysis of Genetic based PID-PSS with SVC in a Multi-...
 
Optimal Placement of DG for Loss Reduction and Voltage Sag Mitigation in Radi...
Optimal Placement of DG for Loss Reduction and Voltage Sag Mitigation in Radi...Optimal Placement of DG for Loss Reduction and Voltage Sag Mitigation in Radi...
Optimal Placement of DG for Loss Reduction and Voltage Sag Mitigation in Radi...
 
Line Losses in the 14-Bus Power System Network using UPFC
Line Losses in the 14-Bus Power System Network using UPFCLine Losses in the 14-Bus Power System Network using UPFC
Line Losses in the 14-Bus Power System Network using UPFC
 
Study of Structural Behaviour of Gravity Dam with Various Features of Gallery...
Study of Structural Behaviour of Gravity Dam with Various Features of Gallery...Study of Structural Behaviour of Gravity Dam with Various Features of Gallery...
Study of Structural Behaviour of Gravity Dam with Various Features of Gallery...
 
Assessing Uncertainty of Pushover Analysis to Geometric Modeling
Assessing Uncertainty of Pushover Analysis to Geometric ModelingAssessing Uncertainty of Pushover Analysis to Geometric Modeling
Assessing Uncertainty of Pushover Analysis to Geometric Modeling
 
Secure Multi-Party Negotiation: An Analysis for Electronic Payments in Mobile...
Secure Multi-Party Negotiation: An Analysis for Electronic Payments in Mobile...Secure Multi-Party Negotiation: An Analysis for Electronic Payments in Mobile...
Secure Multi-Party Negotiation: An Analysis for Electronic Payments in Mobile...
 
Selfish Node Isolation & Incentivation using Progressive Thresholds
Selfish Node Isolation & Incentivation using Progressive ThresholdsSelfish Node Isolation & Incentivation using Progressive Thresholds
Selfish Node Isolation & Incentivation using Progressive Thresholds
 
Various OSI Layer Attacks and Countermeasure to Enhance the Performance of WS...
Various OSI Layer Attacks and Countermeasure to Enhance the Performance of WS...Various OSI Layer Attacks and Countermeasure to Enhance the Performance of WS...
Various OSI Layer Attacks and Countermeasure to Enhance the Performance of WS...
 
Responsive Parameter based an AntiWorm Approach to Prevent Wormhole Attack in...
Responsive Parameter based an AntiWorm Approach to Prevent Wormhole Attack in...Responsive Parameter based an AntiWorm Approach to Prevent Wormhole Attack in...
Responsive Parameter based an AntiWorm Approach to Prevent Wormhole Attack in...
 
Cloud Security and Data Integrity with Client Accountability Framework
Cloud Security and Data Integrity with Client Accountability FrameworkCloud Security and Data Integrity with Client Accountability Framework
Cloud Security and Data Integrity with Client Accountability Framework
 
Genetic Algorithm based Layered Detection and Defense of HTTP Botnet
Genetic Algorithm based Layered Detection and Defense of HTTP BotnetGenetic Algorithm based Layered Detection and Defense of HTTP Botnet
Genetic Algorithm based Layered Detection and Defense of HTTP Botnet
 
Enhancing Data Storage Security in Cloud Computing Through Steganography
Enhancing Data Storage Security in Cloud Computing Through SteganographyEnhancing Data Storage Security in Cloud Computing Through Steganography
Enhancing Data Storage Security in Cloud Computing Through Steganography
 
Low Energy Routing for WSN’s
Low Energy Routing for WSN’sLow Energy Routing for WSN’s
Low Energy Routing for WSN’s
 
Permutation of Pixels within the Shares of Visual Cryptography using KBRP for...
Permutation of Pixels within the Shares of Visual Cryptography using KBRP for...Permutation of Pixels within the Shares of Visual Cryptography using KBRP for...
Permutation of Pixels within the Shares of Visual Cryptography using KBRP for...
 
Rotman Lens Performance Analysis
Rotman Lens Performance AnalysisRotman Lens Performance Analysis
Rotman Lens Performance Analysis
 
Band Clustering for the Lossless Compression of AVIRIS Hyperspectral Images
Band Clustering for the Lossless Compression of AVIRIS Hyperspectral ImagesBand Clustering for the Lossless Compression of AVIRIS Hyperspectral Images
Band Clustering for the Lossless Compression of AVIRIS Hyperspectral Images
 
Microelectronic Circuit Analogous to Hydrogen Bonding Network in Active Site ...
Microelectronic Circuit Analogous to Hydrogen Bonding Network in Active Site ...Microelectronic Circuit Analogous to Hydrogen Bonding Network in Active Site ...
Microelectronic Circuit Analogous to Hydrogen Bonding Network in Active Site ...
 
Texture Unit based Monocular Real-world Scene Classification using SOM and KN...
Texture Unit based Monocular Real-world Scene Classification using SOM and KN...Texture Unit based Monocular Real-world Scene Classification using SOM and KN...
Texture Unit based Monocular Real-world Scene Classification using SOM and KN...
 

Recently uploaded

Beyond the EU: DORA and NIS 2 Directive's Global Impact
Beyond the EU: DORA and NIS 2 Directive's Global ImpactBeyond the EU: DORA and NIS 2 Directive's Global Impact
Beyond the EU: DORA and NIS 2 Directive's Global ImpactPECB
 
BASLIQ CURRENT LOOKBOOK LOOKBOOK(1) (1).pdf
BASLIQ CURRENT LOOKBOOK  LOOKBOOK(1) (1).pdfBASLIQ CURRENT LOOKBOOK  LOOKBOOK(1) (1).pdf
BASLIQ CURRENT LOOKBOOK LOOKBOOK(1) (1).pdfSoniaTolstoy
 
JAPAN: ORGANISATION OF PMDA, PHARMACEUTICAL LAWS & REGULATIONS, TYPES OF REGI...
JAPAN: ORGANISATION OF PMDA, PHARMACEUTICAL LAWS & REGULATIONS, TYPES OF REGI...JAPAN: ORGANISATION OF PMDA, PHARMACEUTICAL LAWS & REGULATIONS, TYPES OF REGI...
JAPAN: ORGANISATION OF PMDA, PHARMACEUTICAL LAWS & REGULATIONS, TYPES OF REGI...anjaliyadav012327
 
Activity 01 - Artificial Culture (1).pdf
Activity 01 - Artificial Culture (1).pdfActivity 01 - Artificial Culture (1).pdf
Activity 01 - Artificial Culture (1).pdfciinovamais
 
Web & Social Media Analytics Previous Year Question Paper.pdf
Web & Social Media Analytics Previous Year Question Paper.pdfWeb & Social Media Analytics Previous Year Question Paper.pdf
Web & Social Media Analytics Previous Year Question Paper.pdfJayanti Pande
 
Measures of Dispersion and Variability: Range, QD, AD and SD
Measures of Dispersion and Variability: Range, QD, AD and SDMeasures of Dispersion and Variability: Range, QD, AD and SD
Measures of Dispersion and Variability: Range, QD, AD and SDThiyagu K
 
mini mental status format.docx
mini    mental       status     format.docxmini    mental       status     format.docx
mini mental status format.docxPoojaSen20
 
Z Score,T Score, Percential Rank and Box Plot Graph
Z Score,T Score, Percential Rank and Box Plot GraphZ Score,T Score, Percential Rank and Box Plot Graph
Z Score,T Score, Percential Rank and Box Plot GraphThiyagu K
 
POINT- BIOCHEMISTRY SEM 2 ENZYMES UNIT 5.pptx
POINT- BIOCHEMISTRY SEM 2 ENZYMES UNIT 5.pptxPOINT- BIOCHEMISTRY SEM 2 ENZYMES UNIT 5.pptx
POINT- BIOCHEMISTRY SEM 2 ENZYMES UNIT 5.pptxSayali Powar
 
Interactive Powerpoint_How to Master effective communication
Interactive Powerpoint_How to Master effective communicationInteractive Powerpoint_How to Master effective communication
Interactive Powerpoint_How to Master effective communicationnomboosow
 
Kisan Call Centre - To harness potential of ICT in Agriculture by answer farm...
Kisan Call Centre - To harness potential of ICT in Agriculture by answer farm...Kisan Call Centre - To harness potential of ICT in Agriculture by answer farm...
Kisan Call Centre - To harness potential of ICT in Agriculture by answer farm...Krashi Coaching
 
Presentation by Andreas Schleicher Tackling the School Absenteeism Crisis 30 ...
Presentation by Andreas Schleicher Tackling the School Absenteeism Crisis 30 ...Presentation by Andreas Schleicher Tackling the School Absenteeism Crisis 30 ...
Presentation by Andreas Schleicher Tackling the School Absenteeism Crisis 30 ...EduSkills OECD
 
Sports & Fitness Value Added Course FY..
Sports & Fitness Value Added Course FY..Sports & Fitness Value Added Course FY..
Sports & Fitness Value Added Course FY..Disha Kariya
 
social pharmacy d-pharm 1st year by Pragati K. Mahajan
social pharmacy d-pharm 1st year by Pragati K. Mahajansocial pharmacy d-pharm 1st year by Pragati K. Mahajan
social pharmacy d-pharm 1st year by Pragati K. Mahajanpragatimahajan3
 
Russian Call Girls in Andheri Airport Mumbai WhatsApp 9167673311 💞 Full Nigh...
Russian Call Girls in Andheri Airport Mumbai WhatsApp  9167673311 💞 Full Nigh...Russian Call Girls in Andheri Airport Mumbai WhatsApp  9167673311 💞 Full Nigh...
Russian Call Girls in Andheri Airport Mumbai WhatsApp 9167673311 💞 Full Nigh...Pooja Nehwal
 
Ecosystem Interactions Class Discussion Presentation in Blue Green Lined Styl...
Ecosystem Interactions Class Discussion Presentation in Blue Green Lined Styl...Ecosystem Interactions Class Discussion Presentation in Blue Green Lined Styl...
Ecosystem Interactions Class Discussion Presentation in Blue Green Lined Styl...fonyou31
 
Separation of Lanthanides/ Lanthanides and Actinides
Separation of Lanthanides/ Lanthanides and ActinidesSeparation of Lanthanides/ Lanthanides and Actinides
Separation of Lanthanides/ Lanthanides and ActinidesFatimaKhan178732
 

Recently uploaded (20)

Beyond the EU: DORA and NIS 2 Directive's Global Impact
Beyond the EU: DORA and NIS 2 Directive's Global ImpactBeyond the EU: DORA and NIS 2 Directive's Global Impact
Beyond the EU: DORA and NIS 2 Directive's Global Impact
 
BASLIQ CURRENT LOOKBOOK LOOKBOOK(1) (1).pdf
BASLIQ CURRENT LOOKBOOK  LOOKBOOK(1) (1).pdfBASLIQ CURRENT LOOKBOOK  LOOKBOOK(1) (1).pdf
BASLIQ CURRENT LOOKBOOK LOOKBOOK(1) (1).pdf
 
JAPAN: ORGANISATION OF PMDA, PHARMACEUTICAL LAWS & REGULATIONS, TYPES OF REGI...
JAPAN: ORGANISATION OF PMDA, PHARMACEUTICAL LAWS & REGULATIONS, TYPES OF REGI...JAPAN: ORGANISATION OF PMDA, PHARMACEUTICAL LAWS & REGULATIONS, TYPES OF REGI...
JAPAN: ORGANISATION OF PMDA, PHARMACEUTICAL LAWS & REGULATIONS, TYPES OF REGI...
 
Activity 01 - Artificial Culture (1).pdf
Activity 01 - Artificial Culture (1).pdfActivity 01 - Artificial Culture (1).pdf
Activity 01 - Artificial Culture (1).pdf
 
Web & Social Media Analytics Previous Year Question Paper.pdf
Web & Social Media Analytics Previous Year Question Paper.pdfWeb & Social Media Analytics Previous Year Question Paper.pdf
Web & Social Media Analytics Previous Year Question Paper.pdf
 
Advance Mobile Application Development class 07
Advance Mobile Application Development class 07Advance Mobile Application Development class 07
Advance Mobile Application Development class 07
 
Mattingly "AI & Prompt Design: The Basics of Prompt Design"
Mattingly "AI & Prompt Design: The Basics of Prompt Design"Mattingly "AI & Prompt Design: The Basics of Prompt Design"
Mattingly "AI & Prompt Design: The Basics of Prompt Design"
 
Measures of Dispersion and Variability: Range, QD, AD and SD
Measures of Dispersion and Variability: Range, QD, AD and SDMeasures of Dispersion and Variability: Range, QD, AD and SD
Measures of Dispersion and Variability: Range, QD, AD and SD
 
mini mental status format.docx
mini    mental       status     format.docxmini    mental       status     format.docx
mini mental status format.docx
 
Código Creativo y Arte de Software | Unidad 1
Código Creativo y Arte de Software | Unidad 1Código Creativo y Arte de Software | Unidad 1
Código Creativo y Arte de Software | Unidad 1
 
Z Score,T Score, Percential Rank and Box Plot Graph
Z Score,T Score, Percential Rank and Box Plot GraphZ Score,T Score, Percential Rank and Box Plot Graph
Z Score,T Score, Percential Rank and Box Plot Graph
 
POINT- BIOCHEMISTRY SEM 2 ENZYMES UNIT 5.pptx
POINT- BIOCHEMISTRY SEM 2 ENZYMES UNIT 5.pptxPOINT- BIOCHEMISTRY SEM 2 ENZYMES UNIT 5.pptx
POINT- BIOCHEMISTRY SEM 2 ENZYMES UNIT 5.pptx
 
Interactive Powerpoint_How to Master effective communication
Interactive Powerpoint_How to Master effective communicationInteractive Powerpoint_How to Master effective communication
Interactive Powerpoint_How to Master effective communication
 
Kisan Call Centre - To harness potential of ICT in Agriculture by answer farm...
Kisan Call Centre - To harness potential of ICT in Agriculture by answer farm...Kisan Call Centre - To harness potential of ICT in Agriculture by answer farm...
Kisan Call Centre - To harness potential of ICT in Agriculture by answer farm...
 
Presentation by Andreas Schleicher Tackling the School Absenteeism Crisis 30 ...
Presentation by Andreas Schleicher Tackling the School Absenteeism Crisis 30 ...Presentation by Andreas Schleicher Tackling the School Absenteeism Crisis 30 ...
Presentation by Andreas Schleicher Tackling the School Absenteeism Crisis 30 ...
 
Sports & Fitness Value Added Course FY..
Sports & Fitness Value Added Course FY..Sports & Fitness Value Added Course FY..
Sports & Fitness Value Added Course FY..
 
social pharmacy d-pharm 1st year by Pragati K. Mahajan
social pharmacy d-pharm 1st year by Pragati K. Mahajansocial pharmacy d-pharm 1st year by Pragati K. Mahajan
social pharmacy d-pharm 1st year by Pragati K. Mahajan
 
Russian Call Girls in Andheri Airport Mumbai WhatsApp 9167673311 💞 Full Nigh...
Russian Call Girls in Andheri Airport Mumbai WhatsApp  9167673311 💞 Full Nigh...Russian Call Girls in Andheri Airport Mumbai WhatsApp  9167673311 💞 Full Nigh...
Russian Call Girls in Andheri Airport Mumbai WhatsApp 9167673311 💞 Full Nigh...
 
Ecosystem Interactions Class Discussion Presentation in Blue Green Lined Styl...
Ecosystem Interactions Class Discussion Presentation in Blue Green Lined Styl...Ecosystem Interactions Class Discussion Presentation in Blue Green Lined Styl...
Ecosystem Interactions Class Discussion Presentation in Blue Green Lined Styl...
 
Separation of Lanthanides/ Lanthanides and Actinides
Separation of Lanthanides/ Lanthanides and ActinidesSeparation of Lanthanides/ Lanthanides and Actinides
Separation of Lanthanides/ Lanthanides and Actinides
 

Urban Air Quality Modelling and Simulation: A Case Study of Kolhapur (M.S.), India

  • 1. Full Paper ACEE Int. J. on Civil and Environmental Engineering, Vol. 2, No. 1,Aug 2013 ©2013ACEE DOI:01.IJCEE.2.1.2 UrbanAirQualityModelling and Simulation:ACase Study of Kolhapur (M.S.), India Yogesh Sathe1 , Atul Ayare2 , and Girish Kulkarni1 1 Department of Technology, Shivaji University, Kolhapur, Maharashtra, INDIA Email: yvsathe14@gmail.com, girish.kulkarni@gmail.com 2 Department of Environmental Engineering, K.I.T.’s College ofEngineering, Kolhapur, Maharashtra, INDIA Email: atul_ayare@yahoo.com Abstract— As a consequence of urbanization a phenomenal surge has been observed in the vehicular population in India, giving rise to elevated levels of traffic related pollutants like carbon monoxide, nitrogen oxides, hydrocarbons, and particulates in Indian urban centers. These pollutants can have both acute and chronic effects on human health. Thus air quality management needs immediate attention. Air quality models simulate the physical and chemical processes occurring in the atmosphere to estimate the atmospheric pollutant concentration. A variety of air quality models are available ranging from simple empirical models to complex Computational Fluid Dynamic (CFD) models. Air quality models can be a valuable tool in pollution forecasting, air quality management, traffic management and urban planning. This paper evaluates the performance of widely used Danish Operational Street Pollution Model (OSPM) under Indian traffic conditions. Comparison between predicted and observed concentrations was performed using both quantitative and statistical methods. OSPM was found to perform exceedingly well for the prediction of particulates whereas NO2 predictions were poorly predicted. Index Terms— Vehicular Emissions; Air quality; Air quality models; Street canyon. I. INTRODUCTION Hasty economic growth in the course of urban development iscausing serious air pollution problems in many cities throughout India. A phenomenal surge has been observed in vehicular population in Indian cities leading to highest ambient concentrations in the congested streets [1]. As a consequence of urban development, along with energy, the transport sector has been the centre of attention during last decade. The transport sector in India consumes about 16.9% i.e. 36.5 million tonnes of oil equivalent (mtoe) of total energy. Among different types of motor vehicles, percentage of two wheelers has shown rapid growth and it constitutes 70% of total motor vehicles of India [2]. According to source apportionment studies conducted by Central Pollution Control Board (CPCB), India; in cities like Delhi, Kanpur, Bangalore, Pune, Chennai, Mumbai, transport sector contributes to more than 30% of the ambient air pollution. These contributions are either direct from vehicular exhaust or indirect through resuspension of road dust due to vehicular movement. Even in manyofthe two tier cities in India, traffic and inadequate infrastructure facilities are responsible for higher local air pollution levels [3]. The higher contribution of transportation sector to air pollution in India can be attributed to predominance of older vehicles in the fleet, inadequate inspection and maintenance; further improper traffic management system, road conditions, absence of effective mass rapid transport system and intra- city railway networks have aggravated this situation [4]. Considering the continual traffic growth and emissions and their impact on human health and urban air qualitythere is an urgent need for a regulatory framework for the management oftraffic, air qualityand emissions at local level, aswell as at regional and national scales [5].Air qualitymodels can help to develop air qualitymanagement action plans and serves as an effective tool for improving air quality in urban centers. Air quality models predict the dispersion and dilution processes of the pollutants in the atmosphere using the emissions, prevailing meteorological conditions and street configurations to determine the ambient air concentrations [6]. A variety of line source and street canyon models are now available, starting from simple empirical models to complex Computational Fluid Dynamic (CFD) models [7, 8, 9]. This paper discusses the current scenario of the transportation sector in terms of air pollution and reviews the air quality modelling studies conducted in India. Future scope for air quality modelling and simulation is also discussed. II. HEALTH EFFECTS OF TRAFFIC ORIGINATED AIR POLLUTANTS Atmospheric pollutants can cause both acute and chronic effects on human health. CO is a suffocating pollutant which reacts with hemoglobin in the blood forming carboxy hemoglobin (COHb) and therebyreduces the oxygen carrying capacity of blood. Short-term exposure to high CO concentrations can cause an acutehealth impact [10]. Benzene compounds have a cumulative effect on human health. Long- term exposure to high benzene levels can cause risk ofcancer. Oxides of nitrogen are responsible for both short and long- term health effects likealteredlungfunction, respiratoryillness and lung tissue damage [13]. Particle size is an important consideration because particles in certain size ranges have profound effect on human health. Fig. 1, shows the deposition of particles in the respiratorysystem. Smaller the size of the particle it is likely to penetrate deeper in the lungs. Particles greater than 100 6
  • 2. Full Paper ©2013ACEE DOI:01.IJCEE.2.1. ACEE Int. J. on Civil and Environmental Engineering, Vol. 2, No. 1,Aug 2013 2 Figure 1. Respiratory Collection of Particles [11] µm are typicallynot inhaled, while smaller particles, typically less than 4 µm, can interfere with oxygen gas-exchange in the lung alveolar region [14]. Respirable Particulate Matter (PM10 ) and Fine Particulate Matter (PM2.5 ) have been found to associate with increased mortalityand asthma [15, 16]. Ultrafine particles (PM1 ) can cause cardiopulmonary diseases, cardiovascular diseases, and respiratory diseases [12]. III. DESCRIPTION OF THE STUDY AREA Kolhapur cityis located in Maharashtra state (INDIA) at 16°42’N 74°13’ Eÿþ/ 16.7; 74.22. It has an average elevation of 545 meters (1788 ft). The geographical area of the district is 7685 km2 . This research work concentrates on the studyof a section of Station Road (Fig.2), which runs through the heart of Kolhapur cityand comprises one ofthe busiest routes towards the city centre. As street configuration and structures nearby affect the air flow and thereby influence dispersion and dilution processes within the streets. Table I presents details of street configuration. TABLE I. DETAILS OF STREET CONFIGURATION Figure 2. Location of the study area Length of the street 130 m Width of the street 32.97 m Average height of buildings 13 m Orientation of the street 680 to the North Height to Width Ratio (Aspect ratio) 0.4 Length to Height ratio 10 IV. METHODOLOGY This section explains the experimental and computational methodology used to investigate and evaluate the performanceofthe employedair qualitymodel. Fig. 3, presents an outline of steps necessary for air quality modeling study. The study was divided into two major parts: air quality modelling and ambient sampling.Air qualitymodelling uses various dispersion models to predict the hourlyconcentration of pollutants in the street. Such model requires input data such as Traffic data, Emission factors, Meteorological parameters (ambient temperature, wind speed and direction, etc.) [17], Street geometry i.e. length and width of streets, Height of buildings, Angle between street and wind direction, etc., and background concentration of pollutants. Using the 7
  • 3. Full Paper ACEE Int. J. on Civil and Environmental Engineering, Vol. 2, No. 1,Aug 2013 ©2013ACEE DOI:01.IJCEE.2.1. mathematical framework dispersion models calculate the pollutant concentrations at desired receptor locations. The second part deals with the ambient sampling and analysis to determine the pollutant concentrations in the street. Predicted and observed concentrations are used for statistical analysis of dispersion models validation. Results of this study can be used for assessing roadside air quality by providing predictions of present and future air pollution levels as well as temporal and spatial variations. 2 Figure 3. Framework for Air Quality Modelling Study A. Operational Street Pollution Model (OSPM) Figure 4. Schematic illustration of basic model principles used in OSPM Operational Street Pollution Model [18] evolved from the Canyon Plume Box Model (CPBM). OSPM is a parameterized, semi-empirical model which can be used to calculate concentrations of vehicular pollutants on both leeward and windward sides of a street canyon. Fig. 4, illustrates the basic principles used in OSPM. OSPM calculates contribution from i) direct vehicular exhaust ii) recirculation of pollutant within canyon due to vortex formation and iii) background concentration [7]. OSPM uses Gaussian plume model to calculate direct contribution from vehicular exhaust whereas recirculation is modeled using a box model technique. OSPM models turbulence in the street considering wind turbulence and traffic induced turbulence [19]. The input data required byOSPMinclude: Trafficvolume, Source strength, Meteorological data such as wind speed and direction at 10m height, Solar radiation data, Canyon geometry such as length, width and orientation of the street and height of buildings surrounding street and Background concentrations. The latest versions of OSPM can predict hourly concentrations for CO, NOx, Ozone, VOC, and Particulates. B. Traffic Data Air quality models require detailed information on traffic volume, fleet composition, and average travel speed. Traffic volume data are hourly average values of manual counts performed at selected street during the studyperiod. Traffic counts were performed everydayduring 1st December, 2012 to 31st January, 2013 and the time span chosen for study is everyday9:00to13:00(Morning)and16:00 to20:00(Evening) to capture the peak hours. C. Emissions Vehicular emissions were calculated using the hourlytraffic volume and the average emission factors. The source strength was computed for each of the pollutant as: Q (g - km-1 hr-1 ) = N (hr-1 ) x EF (g - km-1 ) In the present study, average emission factors were compiled from various literatures including regulatory agencies like Central Pollution Control Board (CPCB) and TABLE II. SUMMARY OF EMISSION FACTORS USED IN THE STUDY(G/Km) Vehicle Category NOx SPM PM10 Two Wheelers 0.19 0.05 0.10 Three Wheelers 1.28 0.20 0.20 Passenger Cars (Gasoline) 0.20 0.03 0.10 Passenger Cars (Diesel) 0.50 0.07 1.00 Light Duty Vehicles 2.00 0.56 1.25 Heavy Duty Vehicles 6.30 0.28 2.00 Buses 12.00 0.56 1.50 research institutes likeAutomotive Research Association of India (ARAI), National Environmental Engineering Research Institute (NEERI), etc. Asummaryofchosen emission factors is provided in the table II. D. Meteorological Data Meteorological data for this research work is collected using an Automatic Weather Station (AWS) (Oregon Scientific, Model: WMR200) which provided with the 8
  • 4. Full Paper ©2013ACEE DOI:01.IJCEE.2.1. ACEE Int. J. on Civil and Environmental Engineering, Vol. 2, No. 1,Aug 2013 prevailing meteorological conditions at the measurement site. The meteorological parameters monitored include: Temperature, Wind speed (Rooftop level), and Wind Direction. E. Urban Background Measurements The background concentration of pollutants plays a vital role in urban air quality modeling. Rooftop measurement method is employed to determine the background concentration of pollutants under consideration namelyPM10 , SPM and NO2 . Background concentrations were determined using High volume method. OSPM further requires background concentration of ozone as input, due to unavailability of resources for measurement of ozone a constant value of21.15 ppbhas been used for the calculations [20]. F. Ambient Sampling and Analysis Measurement and monitoring for the selected traffic originated pollutants namely: Particulates and Nitrogen dioxide is carried out during the months of December 2012 and January 2013. Particulates concentration is determined gravimetrically using high volume method. Air is drawn through a size-selective inlet and through a 20.3 X 25.4 cm (8 X 10in) whatmann filter at a flowrateof1132 L/min. Particles with aerodynamic diameter less than the cut-point ofthe inlet are collected, by the filter. The mass of these particles is determined by the difference in filter weights prior to and after sampling. The concentration of SPM and PM10 in the designated size range is calculated by dividing the weight gain of the filter bythe volume of air sampled [22]. Concentration of ambient nitrogen dioxide is determined by Modified Jacobs & Hochheiser Method [22]. Ambient nitrogen dioxide (NO2 ) is collected bybubbling air through a solution of sodium hydroxide and sodium arsenite. The concentration of nitrite ion (NO-2 ) produced during sampling is determined colorimetrically byreacting the nitrite ion with phosphoric acid, sulfanilamide, and N-(1-naphthyl)- ethylenediamine di-hydrochloride (NEDA) andmeasuringthe absorbance of the highly coloured azodye at 540 nm [22]. G. Statistical Analysis Model performance was evaluated using statistical analysis. The statistical parameters used here includes: Index of agreement, Correlation coefficient, and Fractional bias as defined in table III. IA value indicates the degree to which observed concentrations are accurately predicted bythe model. In other words, it is a measure of degree towhich the model predictions are error free [23]. Correlation coefficient (R), explains the degree to which fluctuations in observed concentrations are followed by fluctuations in predicted concentrations. It varies between +1 < R< -1, where ±1 indicating a perfect correlation and 0 indicating no correlation at all [24]. FBis a measure of agreement between mean concentrations and it ranges between +2 and -2 [6]. 2 IV. RESULTS AND DISCUSSION A. Emission Rates from Automobiles Fig. 5, shows the scale map of observed traffic during monitoring period. Two wheelers were observed to be dominating throughout the monitoring period with a percentage of 56% followed by passenger cars (29%). Light Diesel Vehicles (LDV) was observed to be minimum with a percentage of 2%. It is evident from the above distributions that two wheelers and passenger cars comprise predominant source of exhaust emissions and also mechanical turbulence in the confined urban environment. Contribution to air pollution from automobiles is generated using traffic density and emission factors. The results obtained are shown in the Fig. 6. Emission rates are observed to follow the trend of traffic density in the street. As emission factor for NOx are higher, emission rates of NOx are observed to be dominating during the monitoring period. TABLE III. STATISTICAL PARAMETERS Figure 5. Scale map of traffic during monitoring period B. Meteorological Data The study was carried out during the winter season and average ambient temperature during the monitoring period was found to be 27.30 C. Fig. 7, shows the variation in the temperature during monitoring period. Hourly wind speed and direction data were collected at the monitoring site. Fig. 8, shows the windrose diagrams for 9
  • 5. Full Paper ACEE Int. J. on Civil and Environmental Engineering, Vol. 2, No. 1,Aug 2013 ©2013ACEE DOI:01.IJCEE.2.1. the monitoring site. It was observed that, North-Westerly (NW)winds predominate during themonitoring period. These prevailing wind flowsare perpendicular or near-perpendicular to the street canyon axis. C. Urban Background Measurements As urban background measurements plays a crucial role in urban air quality modelling, providing hourly urban background air quality data is the greatest challenge. As discussed earlier rooftop measurement method was employed to determine the background concentrations of selected pollutants. Due to unavailability of resources for NO measurement, concentrations of NOx were determined mathematicallyassuming NOx/NO2 ratioof 1.32 [20]. Fig. 9, presents variations in the background concentrations of the pollutants (PM10 , SPM, NO2 and NOx). As chosen monitoring period was winter season, often a higher background concentration of pollutants were observed 2 Figure 6. Emission rates from automobiles during monitoring period Figure 7. Trend of temperature during monitoring period due to prevailing stable atmospheric conditions. D. Air Quality Modelling Air quality modelling involves assessment of traffic originated pollutants (PM10 , SPM, NO2 ) at selected urban street canyon site, using Operational Street Pollution Model (OSPM). Air quality in street was monitored during the selected monitoring period and it is compared with predicted concentrations obtained with OSPM. Details on emission rates, Meteorological data, Street configuration, and urban background concentrations are used as input to the model in required units. Further for modeling NOx chemistry, a photolysis rate constant is taken JNO2 = 0.015 s-1 and NO/NO2 ratio=0.32[20, 21]. It was observed that the models produce a mixed nature of predictions for different pollutants. When comparing con- centrations on a day to day basis model was found to per- form well for PM10 and SPM but for NO2 predictions a poor 10
  • 6. Full Paper ©2013ACEE DOI:01.IJCEE.2.1. ACEE Int. J. on Civil and Environmental Engineering, Vol. 2, No. 1,Aug 2013 2 Figure 8. Windrose plot for study location during monitoring period model performance was observed. Fig. 10, 11 and 12, shows the comparative performance of OSPM for modelling PM10 , SPM and NO2 concentrations respectively. OSPM was found to under predict PM10 concentrations but a good correlation was observed between predicted and observed SPM concentrations. The reason for under- prediction of particulates might be the emission factors considered in the study are purely based on exhaust emissions, no considerations has been given for inclusion of non-exhaust particulate emissions like tyre wear. Another additional reason might be the contribution of road side resuspended dust to particulate concentrations. NO2 values were observed to be over predicted throughout the monitoring period. The reason for over- prediction can be the use of higher NOx emission factors. Further a constant value of background ozone concentration is used to model NOx chemistry, due to unavailability of background ozone concentrations in Kolhapur area. Figure 9. Variations in urban background concentrations during monitoring period Figure 10. Comparison of predicted and observed concentrations for PM10 11
  • 7. Full Paper ACEE Int. J. on Civil and Environmental Engineering, Vol. 2, No. 1,Aug 2013 ©2013ACEE DOI:01.IJCEE.2.1.2 Figure 11. Comparison of predicted and observed concentrations for SPM Figure 12. Comparison of predicted and observed concentrations for NO2 E. Performance Evaluation of OSPM Statistical performance measures for monitoring period are tabulated in table IV. TABLE IV. SUMMARY OF STATISTICAL PARAMETERS USED IN THE STUDY PM10 SPM NO2 Index of Agreement (IA) 0.62 0.98 0.34 Fractional Bias (FB) -0.19 -0.01 0.38 Correlation Coefficient (R) 0.85 0.96 0.64 High values of Index of Agreement (IA) were obtained for SPM and PM10 but IA value was observed to be lower for NO2 suggesting better model performance for PM10 and SPM predictions than that of NO2 predictions. Values of FB are - 0.19 (PM10 ), -0.01 (SPM), 0.38(NO2 ) indicating that OSPM under predicts 19%, and 1% for PM10 and SPM respectively whereas 38% over predicts for NO2 when compared to observed value. It can be observed that Correlation coefficients for 0.85, 0.96, and 0.64 for PM10 , SPM, and NO2 respectively, reflecting good correlation between predicted and observed values of pollutants. V. CONCLUSIONS Automobiles are considered to be the primary source of urban air pollution. Pollutants from automobile sources are emitted near large number of people. As source – receptor distances are short and concentration can be high, which may affect health of the people adversely. This paper evaluated the performance of OSPM for predicting concentrations traffic pollutants in an urban canyon. OSPM was found to simulate the concentrations of particulates better than NO2 on short term basis. NO2 concentrations were consistentlyover predicted bythe model. Performance ofthe model can be further improved with more accurate emission factors and urban background measurements. A major limitation of air quality modelling in India is unavailabilityof high qualitydatabases. Regulatoryagencies needs to strengthen the monitoring network as well as more number of pollutants like Carbon monoxide, Ozone, VOCs, needs to be included. ACKNOWLEDGMENT I would like to thank with deep sense of gratitude my 12
  • 8. Full Paper ©2013ACEE DOI:01.IJCEE.2.1. ACEE Int. J. on Civil and Environmental Engineering, Vol. 2, No. 1,Aug 2013 2 guides Prof. Atul Ayare, Head and Associate Professor at Department of Environmental Engineering, KIT’s College of Engineering, Kolhapur, Maharashtra, INDIAand Dr. Girish Kulkarni, Director, Department of Technology, Shivaji University, Kolhapur, Maharashtra, INDIAfor their valuable suggestions and timely help given to me during this work. REFERENCES [1] Central Pollution Control Board (CPCB), India Website: www.cpcb.nic.in [2] Ramachandra, T.V., Shwetmala, Emissions from India’s transport sector: Statewise synthesis. Atmospheric Environment, (2009). 43 (34): 5510–5517. [3] Guttikunda, S., Jawahar, P., Road Transport in India 2010-30: Emissions, Pollution & Health Impacts. Simple Interactive Models for Better Air Quality, (2010). 13: 1 -6. [4] CPCB. Guidelines for Ambient Air Quality Monitoring. (2003). National Ambient Air Quality Monitoring Series, Central Pollution Control Board, Delhi, India. [5] Costabile, F., Allegrini, I., A new approach to link transport emissions and air quality:An intelligent transport system based on the control of traffic air pollution. Environmental Modelling & Software, (2008). 23: 258 – 267. [6] Ganguly, R., Broderick, B. M., Estimation of CO concentrations for an urban street canyon in Ireland. Air Qual Atmos Health, (2010). 3:195–202. [7] Vardoulakis, S., Fisher, B.E.A., Pericleous, K., Gonzalez-Flesca, N., Modeling air quality in street canyons: a review. Atmospheric Environment, (2003). 37: 155–182. [8] Holmes, N.S., Morawska, L., A review of dispersion modelling and its application to the dispersion of particles: An overview of different dispersion models available. Atmospheric Environment, (2006). 40: 5902–5928 [9] Sharma, P., Khare, M., Modelling of vehicular exhausts—a review. Transportation Research-D, (2001). 6:179–198. [10] Warner, C.F., Davis, W.T., Wark, K., Air Pollution: Its Origin and Control (3rd ed.). (1998). Addison-Wesley-Longman, Boston, MA. [11] Godish, T., Air Quality (4th ed.). (2004), Lewis Publishers [12] WHO. Health effects of transport-related air pollution. (2005). World Health Organization (Europe). ISBN 92-890-1373-7 [13] Nurul Amin, A.T.M., Reducing emissions from private cars: incentive measures for behavioural change. (2009).United Nations Environment Programme (UNEP). [14] US EPA. Atmospheric Sampling Course (APTI 435). (1980).U.S. Environmental Protection Agency, Research Triangle Park, NC [15] Dockery, D.W., Pope, C.A., Acute respiratory effects of particulate air pollution. Annual Reviews of Public Health, (1994). 15:107–132. [16] Anderson, K.R., Avol, E.L., Edwards, S.A., Shamoo, D.A., Peng, R.C., Linn, W.S., Hackney, J.D., Controlled exposures of volunteers to respirable carbon and sulfuric acid aerosols. Journal of the Air and Waste Management Association, (1992). 42: 770–776. [17] Mandurino, C., Vestrucci, P., Using meteorological data to model pollutant dispersion in the atmosphere. Environmental Modelling & Software, (2009). 24: 270–278. [18] Hertel, O., Berkowicz, R., Modelling pollution from traffic in a street canyon. Evaluation of data and model development. (1989). NERI, Roskilde, Denmark. [19] Mensink C., Lefebre F., Janssen L., Cornelis J., A comparison of three street canyon models with measurements at an urban station in Antwerp, Belgium. Environmental Modelling & Software, (2006). 21: 514–519. [20] Konar T.S., Chakrabarty S., Applicability of Caline4 model for NOx in Kolkata Roadway. Journal of Civil and Environmental Engineering, (2012).S1:005. doi:10.4172/2165- 784X.S1-005. [21] Seinfeld, J.H., Pandis, S.N. Atmospheric chemistry and physics (2nd ed.). (2006). John Wiley & Sons, Inc. [22] CPCB. Guidelines for the measurement of ambient air pollutants – Volume I and Volume II. (2011). Central Pollution Control Board (CPCB), New Delhi, INDIA. [23] Gokhale S., Raokhande N., Performance evaluation of air quality models for predicting PM10 and PM2.5 concentrations at urban traffic intersection during winter period. Science of the Total Environment, (2008). 394: 9 – 24. [24] Marmur,A., Mamane, Y., Comparison and evaluation of several mobile source and line source models. Transportation Research Part D. (2003).8:249-265. 13