SlideShare a Scribd company logo
Registered Investment Advisor
Seaport Investment Management www.seaportIM.com 844.249.9463 1
Total Asset Partners Year End Review
January 2017
For the year 2016 our Total Asset Partners portfolio returned 7.53% gross, 6.34% net. Returns for the year
reflected a solid contribution from our equity portfolio that offset losses in municipal bonds, which took the
biggest hit when fixed income markets sold off after the election. Returns for the fourth quarter came in at 0.83%
gross, 0.26% net.
We remain focused on providing an attractive and growing level of income with a positive real total return after
inflation, taxes, and expenses. As you can see in the chart below, which we introduced in our third quarter letter,
our net returns year-to-date have surpassed the Barclay’s Total Return Fixed Income Aggregate by 3.7%, have
been competitive with the S&P 500, which came in at 11.9%, and posted a real return of 4.24% over year-to-date
CPI of 2.1% through December. We have achieved these results with limited volatility month to month.
Seaport Total Asset Partners
as of December 31, 2016
Comparative Year-to-Date Returns for Total Asset Partners,
S&P 500, and Barclay’s Aggregate Total Return
Politics and Economics
Contrary to expectations in 2016, Brexit passed, Trump won the election, 10-year Treasury yields rose 100 basis
points from the end of July, inflation year-over-year accelerated from under 1% to over 2%, and the Chicago Cubs
won the World Series! One would expect markets to suffer losses in face of such uncertainty, but the S&P 500,
which closed under 6% for the year at the end of October, finished the year up 11.9%. So much for consensus
forecasts, including ours!
-15.0%
-10.0%
-5.0%
0.0%
5.0%
10.0%
15.0%
1/1/2016
1/8/2016
1/15/2016
1/22/2016
1/29/2016
2/5/2016
2/12/2016
2/19/2016
2/26/2016
3/4/2016
3/11/2016
3/18/2016
3/25/2016
4/1/2016
4/8/2016
4/15/2016
4/22/2016
4/29/2016
5/6/2016
5/13/2016
5/20/2016
5/27/2016
6/3/2016
6/10/2016
6/17/2016
6/24/2016
7/1/2016
7/8/2016
7/15/2016
7/22/2016
7/29/2016
8/5/2016
8/12/2016
8/19/2016
8/26/2016
9/2/2016
9/9/2016
9/16/2016
9/23/2016
9/30/2016
10/7/2016
10/14/2016
10/21/2016
10/28/2016
11/4/2016
11/11/2016
11/18/2016
11/25/2016
12/2/2016
12/9/2016
12/16/2016
12/23/2016
12/30/2016
Jan Feb Mar Apr May Jun Jul Aug Sep Oct Nov Dec
TAF
AGG
SPX
Registered Investment Advisor
Seaport Investment Management www.seaportIM.com 844.249.9463 2
Over the past 12 months, we have taken a cautious stance in managing our portfolio. Global economic growth
has been anemic, valuations expensive, and market liquidity tight throughout the year. Whatever your political
views, the results of the election will change the national political agenda and rearrange the various political
coalitions in the government. The ultimate outcomes of this regime change are impossible to predict, but we
believe they are likely to be positive for growth. A broad consensus appears to be emerging on the need for tax
reform, investment in infrastructure, and deregulation—and the Republican party has the levers of power to
implement all three.
Investment in infrastructure is a clear and present need. In 2015 some 10% of the 610,000 bridges in the U.S.,
serving daily over 200 million drivers, were rated structurally deficient. At current levels of maintenance
expenditures, it will take almost 20 years to replace them. The American Society of Civil Engineers reports that
32% of our major roads are in poor condition and gives the U.S. a D+ for infrastructure.
Trump has quoted a $1 trillion target for investment in infrastructure over the next 10 years. With the time
required to pass the necessary legislation and clear regulatory hurdles, little of this is likely to occur in 2017, but
once the programs are in place, the level of investment could reach 0.5% of GDP, which is a meaningful number
in an economy that has experienced growth of just 2.2% since 2009.
On the subject of deregulation, the cost of compliance with federal regulations in 2015 was estimated at $1.9
trillion according to the Competitive Enterprise Institute’s annual survey. The number of pages in the Federal
Register, which details every rule and regulation passed by Congress, has almost tripled since the 1970’s, and the
cost of compliance almost certainly higher today with the regulatory burden of the Affordable Care Act. Small
businesses, which account for 50% of all new jobs, are closing at a faster rate than they are opening. Regulation
is consistently cited as one of the most significant concerns in surveys of small business owners by The National
Federation of Small Business. Any reduction in regulatory compliance can’t help but have a positive impact on
new business formation and growth.
Two components to the broad based corporate tax reform currently under discussion: repatriation of overseas
cash balances and lower corporate tax rates. We don’t believe that repatriating corporate cash will increase
business investment in the face of limited pricing power and anemic revenue growth. A more likely outcome is
the cash will be used to reduce debt and finance share buybacks. Corporate balance sheets and reported earnings
per share will benefit, but the impact on economic growth will be marginal.
Unlike repatriation of overseas cash, lower corporate tax rates should support both growth and wages. Among
188 countries surveyed by the Tax Foundation, the U.S. has the third highest corporate tax rate at 35%. Since
2000, most major trading partners of the U.S. have lowered corporate tax rates. While large multi-national
companies have the resources and international domiciles to reduce taxes through sophisticated legal structures,
this option has not been available to a broad swath of domestic American businesses. The inverse relationship
between corporate tax rates, wages, and new business formation has been well documented.
Trump has also proposed lowering marginal rates for individuals while broadening the tax base by eliminating
many currently available deductions. In the past, such changes in tax policies have been politically challenging to
implement because any tax cut will benefit the wealthy when those with income in the top 20% pay more than
80% of total individual income taxes. However, a tax regime, such as the one outlined by Treasury Secretary
Mnuchin that offsets tax cuts for the wealthy with the elimination of deductions and directs the majority of
Registered Investment Advisor
Seaport Investment Management www.seaportIM.com 844.249.9463 3
benefits to the middle class, would be positive for growth since middle class wage earners tend to spend their
disposable income while those in the top 20% will save a much larger portion of any incremental income they
receive.
Despite what could be highly favorable policies of the new administration, a populist policy of trade protectionism,
to which the president appears to be committed, raises the specter of a trade war that could seriously undermine
global and thereby domestic economic growth. That does not mean that changes in incentives to encourage
domestic production, such as the border adjustments under discussion in the press, might accomplish similar
objectives without the adversarial character and consequences of protectionist policies. However, the knock on
effects of such policies on the dollar and inflation are difficult to predict and could be highly disruptive.
Secular Trends
Demographics, excessive sovereign debt, and declining productivity have impeded the pace of economic growth
and slowed the recovery that began in June 2009. With the decline in birth rates since 1960, the growth of the
labor force has slowed dramatically across most industrialized markets as their populations have grown older. It
was excessive debt in the private sector to finance a housing bubble that caused the financial crisis and the ensuing
recession of 2008-2009. The policies put in place in response transferred significant portions of this debt from
private to public balance sheets. At the same time six years of artificially low interest rates have encouraged
borrowing, driving private and public debt to record levels.
To reduce real debt burdens, central banks are likely to keep interest rates low and tolerate higher inflation. A
strong U.S. dollar from higher rates would threaten domestic manufacturing and employment, creating political
risk in the current populist environment. Statements from the Fed to let the economy run hot should be taken
seriously, which suggest the Fed will tolerate higher inflation rather than put any economic expansion at risk with
higher interest rates.
Over the next several years, deflationary forces are likely to recede as inflation picks up. The degree to which real
growth follows depends, of course, on productivity gains and a successful implementation of the Administration’s
economic programs. From the perspective of the market, however, there is no trend to take the place of the
spectacular decline in interest rates from over 15% to under 2% that occurred over the past 30 years and took
fixed income and equity valuations to historically expensive levels. Periods of extreme valuation are followed by
periods of low returns. Investors who expect the experience of the past 30 years to repeat itself are likely to be
disappointed.
Economic Outlook
After a weak start, domestic growth in 2016 staged a modest recovery over the balance of the year. Real growth
came in at 1.6% for 2016 after the fourth quarter fell short of expectations due to a drop in exports. On a positive
note, final sales to domestic purchasers, excluding inventories and exports, grew 2.5% in the fourth quarter, up
from 2.1% in third.
We believe growth in the US economy this year will fall in the range of 2% to 2.5%. With little slack remaining in
the labor market, rising wages should continue to support growth in real incomes and personal consumption. A
recovery in the energy sector and in manufacturing after a protracted inventory destocking cycle should support
Registered Investment Advisor
Seaport Investment Management www.seaportIM.com 844.249.9463 4
a modest increase in capital spending. Significant commitments to capital investments, however, will be delayed
until the outline and timing of anticipated changes in tax and fiscal policy become clearer.
After several years of false starts, there is a reasonable likelihood we will see two hikes in interest rates this year
by the Fed. Meanwhile Libor continues to move higher with the benchmark 3-month rate now over 1% versus
0.61% at the beginning of 2016; the 10-year Treasury yield has risen from 1.78% before the election to 2.36%; and
the U.S. monetary base, which has been contracting at over 11% year-over-year since the end of September, is
down over 10% since the beginning of 2016. So far, the data does not indicate any significant threat of inflation
in the near or intermediate term.
The recession in corporate profits appears to have ended after 5 quarters of negative comparisons. We expect a
gradual improvement in revenue growth, but a strong U.S. dollar will suppress pricing power for exports, while
profit margins will come under pressure from increased wages, higher cost of energy, and to a lesser extent higher
interest rates.
A strong U.S. dollar poses the greatest risk to growth and market returns in 2017. By several measures the dollar
appears overvalued, in some cases by as much as 20%. Any appreciation in the dollar poses risks to the domestic
economy and the emerging market issuers of dollar-denominated debt. The Federal Reserve recognizes this risk
and is likely err on the side of caution in raising rates. Nevertheless, the broad consensus of market commentators
expects the dollar to remain strong, if not strengthen, which increases systemic risk from reverses in capital flows
should the consensus prove wrong.
Portfolio Strategy and Structure
Expectations for the economy have improved with the election and investors have bid up stocks, sold fixed income
securities, and bought the dollar. Unfortunately, new policies that get actually get implemented will have minimal
impact in 2017 while debate over trade policy, tax reform, and the budget will likely fuel volatility.
Across the spectrum in fixed income, most asset prices remain distorted by negative real interest rates with a
quarter of the global fixed income assets trading at nominal (forget about real) negative yields. In the U.S, equity
valuations rank in the 9th and 10th quartiles of virtually every measure of value that we follow.
The chart on the next page, which we introduced in our last quarterly letter, plots enterprise value to net capital
and 12-month rolling forward returns for the S&P 500 from 1990 through September 2016. We’ve chosen
enterprise value to net capital as our valuation benchmark because it is based on physical assets and liabilities
that can be measured precisely, unlike net income, which includes estimates and other arbitrary assumptions. It
is a more stable valuation measure since it can be negative only under rare circumstances. Finally, companies do
not trade below their net capital for long periods unless there are significant assets of questionable and hard-to-
determine value on their balance sheets. Consider this a simpler version of Tobin’s Q Ratio, which measures
market capitalization of stock to their replacement value, but requires a vastly greater number of estimates than
enterprise value to net capital.
The other element of the chart plots the 12-month forward returns for the S&P 500. In other words, for each
point on the chart we’ve calculated the rolling return for the next 12 months. A comparison of the two series
demonstrates the common sense point that lower future returns naturally follow higher valuations.
Registered Investment Advisor
Seaport Investment Management www.seaportIM.com 844.249.9463 5
At the end of December, the S&P 500 closed trading at an enterprise/net capital valuation of 1.51x. As you can
see in the chart below, this comes close to the top of the range, leaving aside the elevated valuations that
accompanied the telecom internet boom of the late 1990’s. We don’t consider this to be a tool for market timing,
but it is hard to avoid the conclusion that equities are trading at historically high levels.
S&P 500 Enterprise Value to Net Capital versus
SPX Forward 12-month Returns, 1990-2016
Source: Bloomberg, Seaport Investment Management
Against this backdrop, we enter 2017 with a just over a third of the portfolio in equities with a below market beta
of 0.91 and above market yield of 3.1%. We have also maintained a defensive position in fixed income, which has
limited exposure to rising interest rates with duration of 1.6 and a solidly investment grade average quality, as
you can see in the table below.
Seaport Total Asset Partners
as of December 31, 2016
Exposure and Contribution to Gross Portfolio Returns by Asset Class
-60%
-40%
-20%
0%
20%
40%
60%
-
0.50
1.00
1.50
2.00
1990
1991
1992
1993
1994
1995
1996
1997
1998
1999
2000
2001
2002
2003
2004
2005
2006
2007
2008
2009
2010
2011
2012
2013
2014
2015
2016
12monthforwardrollingreturn
enterprisevaluetonetcapital
enterprise
value/net capital
forward 12-mo SPX
rolling return
gross returns
category asset class exposure beta duration yield rating ytd ytd contrib
Fixed Income Credit 36.7% 0.09 0.83 2.8% BBB2 3.61% 1.21%
Mortgage 8.7% 0.03 3.01 2.4% B1 4.08% 0.48%
Muni 4.6% 0.18 5.51 4.9% BBB1 4.60% 0.23%
Fixed Income Total 50.0% 0.09 1.64 2.9% BBB3 3.82% 1.91%
Equity Equity 26.3% 0.94 - 2.3% 14.60% 4.09%
MLP 3.9% 0.86 - 5.7% 28.16% 0.95%
REIT 4.5% 0.79 - 4.9% 7.91% 0.33%
Options (0.4%) 1.20 - - 12.98% 0.16%
Equity Total 34.3% 0.91 - 3.1% 15.02% 5.53%
Commodity Commodity 1.1% 0.14 - - 6.77% 0.10%
Commodity Total 1.1% 0.14 - - 6.77% 0.10%
Cash Cash 14.6% - - - AAA - -
Cash Total 14.6% - - - AAA - -
Grand Total 100.0% 0.36 0.82 2.5% BBB1 7.54% 7.52%
Registered Investment Advisor
Seaport Investment Management www.seaportIM.com 844.249.9463 6
The positions in the table below were the top 15 contributors to portfolio returns in 2016 and accounted for over
half of the gross return before fees and expenses of 7.52%. With the exception of the DoubleLine closed end
credit and mortgage fund, the rest were high yielding equities from 11 different industries that benefitted from
attractive valuations at the beginning of the year. Many of them are positions we have held over several years.
Three of them—Brookfield Infrastructure Partnership Units, Macquarie Infrastructure Common Stock, and SJW
Corp Common Stock—reflect our longstanding secular focus on companies that will benefit from positions in
infrastructure and water supplies.
Seaport Total Asset Partners
as of December 31, 2016
Top 15 Contributors to Portfolio Returns
Equities (34%)
Equity exposure, which includes equities, MLP’s, REITs, and options, held more or less steady at 34%-35% over the
fourth quarter. As a measure of volatility relative to the market, the beta of our equity portfolio increased
marginally from 0.87 to 0.91, versus 1.0 for the S&P 500 (the beta for the entire portfolio is 0.35).
To increase our exposure to water utilities and service providers, we added two new positions in the fourth
quarter. The first, Consolidated Water Company, operates desalination plants in the Bahamas and several
emerging market countries. We believe that operational mistakes in Indonesia have been resolved and that the
company is moving steadily towards completion of a transaction to build and operate a large desalinization plant
in Rosarita Mexico that will supply Baja and San Diego markets, both of which are coping with water shortages.
This contract represents a catalyst that would lead to a revaluation of the stock on the back of a substantial
increase in earnings. Currently, Consolidated Water yields 3% and trades slightly above book value at a discount
to other water utilities.
Our second addition is Econolab, a specialty chemical company that supplies a broad range of chemicals used to
purify and process water across a broad range of industries. Econolab should benefit from increasing secular
demand for water products and services. The stock currently yields 1.25% and anticipated dividends are expected
to grow 6%-8% over the next several years.
security
asset
class industry exposure
ytd
return
ytd
contrib
Spectra Energy Common Stock Equity Pipelines 1.1% 65.0% 0.55%
DoubleLine Income CEF (DSL) Credit Global Total Return 1.9% 30.3% 0.48%
SJW Corp Common Stock Equity Utilities 1.0% 65.3% 0.43%
Time Warner Common Stock Equity Broadcasting & Cable 0.9% 49.9% 0.35%
AmeriGas Partners MLP MLP Pipelines 0.9% 42.2% 0.34%
Xylem Common Stock Equity Diversified Manufacturing 0.9% 38.3% 0.31%
Brookfield Infrastructure Ptnrship Units MLP Utilities 0.9% 38.9% 0.28%
Republic Services Common Stock Equity Environmental 1.0% 31.0% 0.26%
BlackRock CE Bank Debt Fund (FRA) Credit US Corporates 1.5% 18.7% 0.25%
Macquarie Infrastructure Common Stock Equity Industrial Services 1.0% 25.6% 0.21%
SunTrust Banks Common Stock Equity Banking 0.6% 58.4% 0.21%
Seaboard Corp Common Stock Equity Food & Beverage 0.7% 38.9% 0.18%
Everest Re Common Stock Equity Insurance 0.9% 20.9% 0.17%
Alleghany Corp Common Stock Equity Insurance 0.7% 27.1% 0.17%
Ventas REIT REIT Real Estate 0.8% 20.2% 0.17%
Total 14.5% 37.0% 4.36%
Registered Investment Advisor
Seaport Investment Management www.seaportIM.com 844.249.9463 7
To expand our exposure to companies operating or building infrastructure we added Heidelberg Cement and
8Point3 Energy Partners L.P. Heidelberg Cement is positioned to benefit from infrastructure spending in both the
U.S and global markets. We believe management’s announced strategy to double earnings and cash flow is
achievable, even though the stock trades at a discount to its peer group and yields 1.5%.
8Point3 Energy Partners L.P operates solar energy facilities serving residential, commercial, and industrial users.
With dramatic increases in solar efficiency and battery storage solar energy is becoming more competitive with
other sources of electricity. The stock yields 7% with the potential for low double digit increases in the distribution
over the next several years.
Fixed Income (50%)
We increased our exposure to fixed income securities in the fourth quarter from 45% to 50% primarily through
short maturity bonds to achieve higher returns than we can earn on excess cash balances, which we reduced from
20% to 15%. In a period of rising interest rates, we remain understandably cautious towards investment grade
corporate debt. Long term debt issued by the S&P 500 companies has risen 75% since 2010 and leverage ratios
have risen to levels that appear excessive at this late stage of the business cycle. The rating agencies have taken
notice and downgrades have increased. We continue to manage our fixed income risk actively with a short
position in the iShares Investment Grade ETF (LQD), currently at 2.3% of the total portfolio and 24% of portfolio
duration. LQD reduces the duration of our fixed income holdings by that amount and limits our exposure to rising
interest rates and widening credit spreads.
The incremental yield offered by non-agency mortgage and high yield bonds has narrowed substantially over the
past year, and, in aggregate, offers little in the way of returns beyond the current yield. Our positions in these
sectors are determined by individual issue selection, rather than a broader allocation to the sectors, which are
trading a historically rich levels.
In contrast to mortgages and high yield, which have managed to hold their value, municipal bonds were hit hard
after the election. Proposed cuts to individual tax rates would not only reduce the value of the municipal tax
exemption, but would also weaken the credit quality of hospitals and states from any repeal of the Affordable
Care Act. These concerns drove the ratio of municipal to treasury yield to the highest levels since the summer of
2015.
The biggest factor affecting the magnitude and duration of any move higher in municipal yields may be where
corporate tax rates land. At a 20%-25% tax rate, insurance companies and banks, the most significant corporate
buyers, would demand higher yields to compensate for lower rates after taxes. The cost to us of the market
adjustment to a lower corporate tax rate is less than the capital gains we would have to pay if we sold our
municipal holdings. We continue to avoid issuers with substantial unfunded pension obligations while seeking
opportunities from potential dislocations in this sector.
Registered Investment Advisor
Seaport Investment Management www.seaportIM.com 844.249.9463 8
We are appreciative of our Seaport clients who share our view of long-term, fundamental, value-driven investing,
independent of short-term market moves.
Thank you for your continued trust and support.
Sincerely,
Ben Trosky
January 30, 2017
Legal Disclaimer
Although the information contained herein has been obtained from sources Seaport Wealth Management, LLC, doing business as Seaport
Investment Management (hereinafter “Seaport Investment Management” or “Seaport”) believes to be reliable, its accuracy and
completeness cannot be guaranteed. This correspondence is for informational purposes only and under no circumstances should be construed
as an offer to sell, or a solicitation to buy, any security. At various times Seaport may have positions in and effect transactions in securities
referred to herein. Any recommendation contained in this correspondence may not be appropriate for all investors. The recipient must
independently evaluate any investment including the tax, legal, accounting and credit aspects of any transaction. Instruments and trading
strategies of the type described herein may involve a high degree of risk, and the value of such instruments may be highly volatile and may
be adversely affected by the absence of a market to provide liquidity. Additional information is available upon request.
This communication includes data about capital markets generally for discussion purposes only. It should not be assumed that market
conditions will be the same in the future. This communication also contains “forward-looking statements” based on certain assumptions
(e.g., availability and terms of investments and market conditions) that may not be available to, experienced or realized by the Fund. In
addition, information contained in this document constitutes “forward-looking statements,” which can be identified by the use of forward-
looking terminology such as “may”, “will”, “should”, “expect”, “anticipate”, “target”, “project”, “estimate”, “intend”, “continue” or
“believe” or the negatives thereof or other variations thereon or comparable terminology. Due to various risks and uncertainties, actual
events or results or the actual performance of the Fund may differ materially from those reflected or contemplated in such forward-looking
statements. No part of this article may be reproduced in any form, or referred to in any other publication, without express written permission
of Seaport Investment Management. ©2017, Seaport Investment Management.

More Related Content

What's hot

FDC Economic Bulletin May 16, 2016
FDC Economic Bulletin   May 16, 2016FDC Economic Bulletin   May 16, 2016
FDC Economic Bulletin May 16, 2016
Financial Derivatives Company Limited (FDC)
 
2018 Global Outlook Webinar
2018 Global Outlook Webinar2018 Global Outlook Webinar
2018 Global Outlook Webinar
Dun & Bradstreet
 
FNB_Property Insights_Retail Property's Consumer Challenges
FNB_Property Insights_Retail Property's Consumer ChallengesFNB_Property Insights_Retail Property's Consumer Challenges
FNB_Property Insights_Retail Property's Consumer Challenges
Berty Van Staaden
 
Client Alert: Brexit - The Impact on Cost of Capital
Client Alert: Brexit - The Impact on Cost of CapitalClient Alert: Brexit - The Impact on Cost of Capital
Client Alert: Brexit - The Impact on Cost of Capital
Duff & Phelps
 
Coming Soon May 2015
Coming Soon May 2015Coming Soon May 2015
Coming Soon May 2015
The PRS Group, Inc.
 
Macroeconomic Developments Report. June 2018
Macroeconomic Developments Report. June 2018Macroeconomic Developments Report. June 2018
Macroeconomic Developments Report. June 2018
Latvijas Banka
 
2017 Global Economic Outlook by Dun & Bradstreet
2017 Global Economic Outlook by Dun & Bradstreet2017 Global Economic Outlook by Dun & Bradstreet
2017 Global Economic Outlook by Dun & Bradstreet
Dun & Bradstreet
 
2017 Global Economic Outlook: 2013 Mid-Year Update | D&B
2017 Global Economic Outlook: 2013 Mid-Year Update | D&B2017 Global Economic Outlook: 2013 Mid-Year Update | D&B
2017 Global Economic Outlook: 2013 Mid-Year Update | D&B
Dun & Bradstreet
 
Valuation Insights - Q3 2016
Valuation Insights - Q3 2016Valuation Insights - Q3 2016
Valuation Insights - Q3 2016
Duff & Phelps
 
Capital Markets Industry Insights - Fall 2016
Capital Markets Industry Insights - Fall 2016Capital Markets Industry Insights - Fall 2016
Capital Markets Industry Insights - Fall 2016
Duff & Phelps
 
SVB Q1 2017 Economic Report
SVB Q1 2017 Economic ReportSVB Q1 2017 Economic Report
SVB Q1 2017 Economic Report
Silicon Valley Bank
 
Economic Snapshot March 23, 2015
Economic Snapshot   March 23, 2015Economic Snapshot   March 23, 2015
Economic Snapshot March 23, 2015
Kurt S. Altrichter
 
January 2015 Coming Soon
January 2015 Coming SoonJanuary 2015 Coming Soon
January 2015 Coming Soon
The PRS Group, Inc.
 
Economic Snapshot - March 9, 2015
Economic Snapshot - March 9, 2015Economic Snapshot - March 9, 2015
Economic Snapshot - March 9, 2015
Kurt S. Altrichter
 
Year ahead 2020 v2
Year ahead 2020 v2Year ahead 2020 v2
Year ahead 2020 v2
Alex DeGroote
 
Premia Weekly Market Commentary April 22 2019
Premia Weekly Market Commentary April 22 2019Premia Weekly Market Commentary April 22 2019
Premia Weekly Market Commentary April 22 2019
TJ Villamil
 
Commodity research report Ways2Capital 29 june 2015
Commodity research report Ways2Capital 29 june 2015Commodity research report Ways2Capital 29 june 2015
Commodity research report Ways2Capital 29 june 2015
Ways2Capital | Investment Advisor
 
4Q_2015_RetailReport_email
4Q_2015_RetailReport_email4Q_2015_RetailReport_email
4Q_2015_RetailReport_emailPatrick Anthon
 
Promises and Price Tags: A Fiscal Guide to the 2016 Election
Promises and Price Tags: A Fiscal Guide to the 2016 ElectionPromises and Price Tags: A Fiscal Guide to the 2016 Election
Promises and Price Tags: A Fiscal Guide to the 2016 Election
Committee for a Responsible Federal Budget
 
February 2016 - Municipal Market Report
February 2016 - Municipal Market ReportFebruary 2016 - Municipal Market Report
February 2016 - Municipal Market ReportJoshua Moews
 

What's hot (20)

FDC Economic Bulletin May 16, 2016
FDC Economic Bulletin   May 16, 2016FDC Economic Bulletin   May 16, 2016
FDC Economic Bulletin May 16, 2016
 
2018 Global Outlook Webinar
2018 Global Outlook Webinar2018 Global Outlook Webinar
2018 Global Outlook Webinar
 
FNB_Property Insights_Retail Property's Consumer Challenges
FNB_Property Insights_Retail Property's Consumer ChallengesFNB_Property Insights_Retail Property's Consumer Challenges
FNB_Property Insights_Retail Property's Consumer Challenges
 
Client Alert: Brexit - The Impact on Cost of Capital
Client Alert: Brexit - The Impact on Cost of CapitalClient Alert: Brexit - The Impact on Cost of Capital
Client Alert: Brexit - The Impact on Cost of Capital
 
Coming Soon May 2015
Coming Soon May 2015Coming Soon May 2015
Coming Soon May 2015
 
Macroeconomic Developments Report. June 2018
Macroeconomic Developments Report. June 2018Macroeconomic Developments Report. June 2018
Macroeconomic Developments Report. June 2018
 
2017 Global Economic Outlook by Dun & Bradstreet
2017 Global Economic Outlook by Dun & Bradstreet2017 Global Economic Outlook by Dun & Bradstreet
2017 Global Economic Outlook by Dun & Bradstreet
 
2017 Global Economic Outlook: 2013 Mid-Year Update | D&B
2017 Global Economic Outlook: 2013 Mid-Year Update | D&B2017 Global Economic Outlook: 2013 Mid-Year Update | D&B
2017 Global Economic Outlook: 2013 Mid-Year Update | D&B
 
Valuation Insights - Q3 2016
Valuation Insights - Q3 2016Valuation Insights - Q3 2016
Valuation Insights - Q3 2016
 
Capital Markets Industry Insights - Fall 2016
Capital Markets Industry Insights - Fall 2016Capital Markets Industry Insights - Fall 2016
Capital Markets Industry Insights - Fall 2016
 
SVB Q1 2017 Economic Report
SVB Q1 2017 Economic ReportSVB Q1 2017 Economic Report
SVB Q1 2017 Economic Report
 
Economic Snapshot March 23, 2015
Economic Snapshot   March 23, 2015Economic Snapshot   March 23, 2015
Economic Snapshot March 23, 2015
 
January 2015 Coming Soon
January 2015 Coming SoonJanuary 2015 Coming Soon
January 2015 Coming Soon
 
Economic Snapshot - March 9, 2015
Economic Snapshot - March 9, 2015Economic Snapshot - March 9, 2015
Economic Snapshot - March 9, 2015
 
Year ahead 2020 v2
Year ahead 2020 v2Year ahead 2020 v2
Year ahead 2020 v2
 
Premia Weekly Market Commentary April 22 2019
Premia Weekly Market Commentary April 22 2019Premia Weekly Market Commentary April 22 2019
Premia Weekly Market Commentary April 22 2019
 
Commodity research report Ways2Capital 29 june 2015
Commodity research report Ways2Capital 29 june 2015Commodity research report Ways2Capital 29 june 2015
Commodity research report Ways2Capital 29 june 2015
 
4Q_2015_RetailReport_email
4Q_2015_RetailReport_email4Q_2015_RetailReport_email
4Q_2015_RetailReport_email
 
Promises and Price Tags: A Fiscal Guide to the 2016 Election
Promises and Price Tags: A Fiscal Guide to the 2016 ElectionPromises and Price Tags: A Fiscal Guide to the 2016 Election
Promises and Price Tags: A Fiscal Guide to the 2016 Election
 
February 2016 - Municipal Market Report
February 2016 - Municipal Market ReportFebruary 2016 - Municipal Market Report
February 2016 - Municipal Market Report
 

Viewers also liked

Minicurso android
Minicurso androidMinicurso android
Minicurso android
Felix Soares
 
Visio Academy Eğitim&Koçluk&Danışmanlık Hizmetleri Şirket Tanıtımımız
Visio Academy Eğitim&Koçluk&Danışmanlık Hizmetleri Şirket TanıtımımızVisio Academy Eğitim&Koçluk&Danışmanlık Hizmetleri Şirket Tanıtımımız
Visio Academy Eğitim&Koçluk&Danışmanlık Hizmetleri Şirket Tanıtımımız
Visio Academy
 
What is Financial Management - Short notes
What is Financial Management - Short notesWhat is Financial Management - Short notes
What is Financial Management - Short notes
M Riaz Khan
 
Altaf Hossain_Biodata_July 2016
Altaf Hossain_Biodata_July 2016Altaf Hossain_Biodata_July 2016
Altaf Hossain_Biodata_July 2016Altaf Hossain
 
Portafolio electronico inglés
Portafolio electronico inglésPortafolio electronico inglés
Portafolio electronico inglés
Lianis Pagán
 
Albietz article in Tropical Resources Bulletin_2007
Albietz article in Tropical Resources Bulletin_2007Albietz article in Tropical Resources Bulletin_2007
Albietz article in Tropical Resources Bulletin_2007Jessica Albietz
 
RecreationManagementPlansTablesExhibits
RecreationManagementPlansTablesExhibitsRecreationManagementPlansTablesExhibits
RecreationManagementPlansTablesExhibitsJessica Albietz
 
Portafolio Electrónico Español
Portafolio Electrónico EspañolPortafolio Electrónico Español
Portafolio Electrónico Español
Lianis Pagán
 
Dover ALS Safety Moment of the Week 07-Nov-2016
Dover ALS Safety Moment of the Week 07-Nov-2016Dover ALS Safety Moment of the Week 07-Nov-2016
Dover ALS Safety Moment of the Week 07-Nov-2016
albertaoiltool
 
EQUATEL DIGITAL HEALTH BY GERSHON GUTMER
EQUATEL DIGITAL HEALTH  BY GERSHON GUTMEREQUATEL DIGITAL HEALTH  BY GERSHON GUTMER
EQUATEL DIGITAL HEALTH BY GERSHON GUTMER
Gershon Gutmer
 
Tarea damian
Tarea damianTarea damian
Tarea damian
damian242619
 
Tarea damian
Tarea damianTarea damian
Tarea damian
damian242619
 

Viewers also liked (14)

Minicurso android
Minicurso androidMinicurso android
Minicurso android
 
Visio Academy Eğitim&Koçluk&Danışmanlık Hizmetleri Şirket Tanıtımımız
Visio Academy Eğitim&Koçluk&Danışmanlık Hizmetleri Şirket TanıtımımızVisio Academy Eğitim&Koçluk&Danışmanlık Hizmetleri Şirket Tanıtımımız
Visio Academy Eğitim&Koçluk&Danışmanlık Hizmetleri Şirket Tanıtımımız
 
What is Financial Management - Short notes
What is Financial Management - Short notesWhat is Financial Management - Short notes
What is Financial Management - Short notes
 
TASBA Talk
TASBA TalkTASBA Talk
TASBA Talk
 
Resume dande 1
Resume dande 1Resume dande 1
Resume dande 1
 
Altaf Hossain_Biodata_July 2016
Altaf Hossain_Biodata_July 2016Altaf Hossain_Biodata_July 2016
Altaf Hossain_Biodata_July 2016
 
Portafolio electronico inglés
Portafolio electronico inglésPortafolio electronico inglés
Portafolio electronico inglés
 
Albietz article in Tropical Resources Bulletin_2007
Albietz article in Tropical Resources Bulletin_2007Albietz article in Tropical Resources Bulletin_2007
Albietz article in Tropical Resources Bulletin_2007
 
RecreationManagementPlansTablesExhibits
RecreationManagementPlansTablesExhibitsRecreationManagementPlansTablesExhibits
RecreationManagementPlansTablesExhibits
 
Portafolio Electrónico Español
Portafolio Electrónico EspañolPortafolio Electrónico Español
Portafolio Electrónico Español
 
Dover ALS Safety Moment of the Week 07-Nov-2016
Dover ALS Safety Moment of the Week 07-Nov-2016Dover ALS Safety Moment of the Week 07-Nov-2016
Dover ALS Safety Moment of the Week 07-Nov-2016
 
EQUATEL DIGITAL HEALTH BY GERSHON GUTMER
EQUATEL DIGITAL HEALTH  BY GERSHON GUTMEREQUATEL DIGITAL HEALTH  BY GERSHON GUTMER
EQUATEL DIGITAL HEALTH BY GERSHON GUTMER
 
Tarea damian
Tarea damianTarea damian
Tarea damian
 
Tarea damian
Tarea damianTarea damian
Tarea damian
 

Similar to 16TAP YearEndLetter 2016

Oecd interim economic ocde outlook march 2017 embargo (3)
Oecd interim economic ocde outlook march 2017   embargo (3)Oecd interim economic ocde outlook march 2017   embargo (3)
Oecd interim economic ocde outlook march 2017 embargo (3)
Daniel BASTIEN
 
PSMJ's 2015 A/E/C Market Outlook
PSMJ's 2015 A/E/C Market OutlookPSMJ's 2015 A/E/C Market Outlook
PSMJ's 2015 A/E/C Market Outlook
Frank A. Stasiowski, FAIA
 
Thailand Blockchain Community Initiative
Thailand Blockchain Community InitiativeThailand Blockchain Community Initiative
Thailand Blockchain Community Initiative
Rein Mahatma
 
2023-14-06_Financial Statement for the Govt of Canada - 2018-2019.pdf
2023-14-06_Financial Statement for the Govt of Canada - 2018-2019.pdf2023-14-06_Financial Statement for the Govt of Canada - 2018-2019.pdf
2023-14-06_Financial Statement for the Govt of Canada - 2018-2019.pdf
paul young cpa, cga
 
Tax Reform: Time for Rubber to meet the road!
Tax Reform: Time for Rubber to meet the road!Tax Reform: Time for Rubber to meet the road!
Tax Reform: Time for Rubber to meet the road!
David Apted
 
Monthly Newsletter 12/2015
Monthly Newsletter 12/2015Monthly Newsletter 12/2015
Monthly Newsletter 12/2015
Latvijas Banka
 
Global Powers of Retailing 2020
Global Powers of Retailing 2020Global Powers of Retailing 2020
Global Powers of Retailing 2020
Paperjam_redaction
 
3 Rd Qtr Economic Review
3 Rd Qtr Economic Review3 Rd Qtr Economic Review
3 Rd Qtr Economic ReviewGary Crosbie
 
Economic growth is slowing downGlobalization contributes many.docx
Economic growth is slowing downGlobalization contributes many.docxEconomic growth is slowing downGlobalization contributes many.docx
Economic growth is slowing downGlobalization contributes many.docx
tidwellveronique
 
Prévisions économiques du printemps 2019 pour le Luxembourg
Prévisions économiques du printemps 2019 pour le LuxembourgPrévisions économiques du printemps 2019 pour le Luxembourg
Prévisions économiques du printemps 2019 pour le Luxembourg
Paperjam_redaction
 
Trade Nivesh Stock Advice
Trade Nivesh Stock AdviceTrade Nivesh Stock Advice
Trade Nivesh Stock Advice
AnkitDubey174
 
Budget and Financial Plan Through 2019
Budget and Financial Plan Through 2019Budget and Financial Plan Through 2019
Budget and Financial Plan Through 2019
Luis Taveras EMBA, MS
 
Economic forecast-summary-russia-oecd-economic-outlook-november-2016
Economic forecast-summary-russia-oecd-economic-outlook-november-2016Economic forecast-summary-russia-oecd-economic-outlook-november-2016
Economic forecast-summary-russia-oecd-economic-outlook-november-2016
Bankir_Ru
 
Trade nivesh stock_advice
Trade nivesh stock_adviceTrade nivesh stock_advice
Trade nivesh stock_advice
AnkitDubey174
 
Nifty Intraday Trading Tips | Nifty50 Cash Trading Tips | Nifty50 Cash Tips
Nifty Intraday Trading Tips | Nifty50 Cash Trading Tips | Nifty50 Cash TipsNifty Intraday Trading Tips | Nifty50 Cash Trading Tips | Nifty50 Cash Tips
Nifty Intraday Trading Tips | Nifty50 Cash Trading Tips | Nifty50 Cash Tips
AnkitDubey174
 
Capital Markets Insights - Fall 2017
Capital Markets Insights - Fall 2017Capital Markets Insights - Fall 2017
Capital Markets Insights - Fall 2017
Duff & Phelps
 
The 2020 Budget and Economic Outlook
The 2020 Budget and Economic OutlookThe 2020 Budget and Economic Outlook
The 2020 Budget and Economic Outlook
Congressional Budget Office
 
Insolvency forecasts feb 2016
Insolvency forecasts   feb 2016Insolvency forecasts   feb 2016
Insolvency forecasts feb 2016
Ignacio Jimenez
 

Similar to 16TAP YearEndLetter 2016 (20)

2015 Year End Outlook
2015 Year End Outlook2015 Year End Outlook
2015 Year End Outlook
 
OKC_1_16
OKC_1_16OKC_1_16
OKC_1_16
 
Oecd interim economic ocde outlook march 2017 embargo (3)
Oecd interim economic ocde outlook march 2017   embargo (3)Oecd interim economic ocde outlook march 2017   embargo (3)
Oecd interim economic ocde outlook march 2017 embargo (3)
 
PSMJ's 2015 A/E/C Market Outlook
PSMJ's 2015 A/E/C Market OutlookPSMJ's 2015 A/E/C Market Outlook
PSMJ's 2015 A/E/C Market Outlook
 
Thailand Blockchain Community Initiative
Thailand Blockchain Community InitiativeThailand Blockchain Community Initiative
Thailand Blockchain Community Initiative
 
2023-14-06_Financial Statement for the Govt of Canada - 2018-2019.pdf
2023-14-06_Financial Statement for the Govt of Canada - 2018-2019.pdf2023-14-06_Financial Statement for the Govt of Canada - 2018-2019.pdf
2023-14-06_Financial Statement for the Govt of Canada - 2018-2019.pdf
 
Tax Reform: Time for Rubber to meet the road!
Tax Reform: Time for Rubber to meet the road!Tax Reform: Time for Rubber to meet the road!
Tax Reform: Time for Rubber to meet the road!
 
Monthly Newsletter 12/2015
Monthly Newsletter 12/2015Monthly Newsletter 12/2015
Monthly Newsletter 12/2015
 
Global Powers of Retailing 2020
Global Powers of Retailing 2020Global Powers of Retailing 2020
Global Powers of Retailing 2020
 
3 Rd Qtr Economic Review
3 Rd Qtr Economic Review3 Rd Qtr Economic Review
3 Rd Qtr Economic Review
 
Economic growth is slowing downGlobalization contributes many.docx
Economic growth is slowing downGlobalization contributes many.docxEconomic growth is slowing downGlobalization contributes many.docx
Economic growth is slowing downGlobalization contributes many.docx
 
Prévisions économiques du printemps 2019 pour le Luxembourg
Prévisions économiques du printemps 2019 pour le LuxembourgPrévisions économiques du printemps 2019 pour le Luxembourg
Prévisions économiques du printemps 2019 pour le Luxembourg
 
Trade Nivesh Stock Advice
Trade Nivesh Stock AdviceTrade Nivesh Stock Advice
Trade Nivesh Stock Advice
 
Budget and Financial Plan Through 2019
Budget and Financial Plan Through 2019Budget and Financial Plan Through 2019
Budget and Financial Plan Through 2019
 
Economic forecast-summary-russia-oecd-economic-outlook-november-2016
Economic forecast-summary-russia-oecd-economic-outlook-november-2016Economic forecast-summary-russia-oecd-economic-outlook-november-2016
Economic forecast-summary-russia-oecd-economic-outlook-november-2016
 
Trade nivesh stock_advice
Trade nivesh stock_adviceTrade nivesh stock_advice
Trade nivesh stock_advice
 
Nifty Intraday Trading Tips | Nifty50 Cash Trading Tips | Nifty50 Cash Tips
Nifty Intraday Trading Tips | Nifty50 Cash Trading Tips | Nifty50 Cash TipsNifty Intraday Trading Tips | Nifty50 Cash Trading Tips | Nifty50 Cash Tips
Nifty Intraday Trading Tips | Nifty50 Cash Trading Tips | Nifty50 Cash Tips
 
Capital Markets Insights - Fall 2017
Capital Markets Insights - Fall 2017Capital Markets Insights - Fall 2017
Capital Markets Insights - Fall 2017
 
The 2020 Budget and Economic Outlook
The 2020 Budget and Economic OutlookThe 2020 Budget and Economic Outlook
The 2020 Budget and Economic Outlook
 
Insolvency forecasts feb 2016
Insolvency forecasts   feb 2016Insolvency forecasts   feb 2016
Insolvency forecasts feb 2016
 

16TAP YearEndLetter 2016

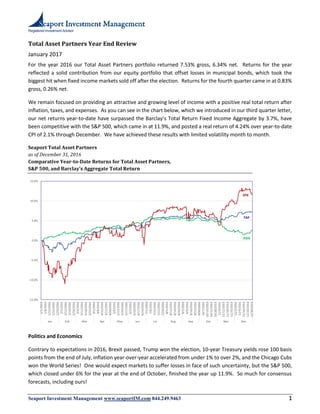
  • 1. Registered Investment Advisor Seaport Investment Management www.seaportIM.com 844.249.9463 1 Total Asset Partners Year End Review January 2017 For the year 2016 our Total Asset Partners portfolio returned 7.53% gross, 6.34% net. Returns for the year reflected a solid contribution from our equity portfolio that offset losses in municipal bonds, which took the biggest hit when fixed income markets sold off after the election. Returns for the fourth quarter came in at 0.83% gross, 0.26% net. We remain focused on providing an attractive and growing level of income with a positive real total return after inflation, taxes, and expenses. As you can see in the chart below, which we introduced in our third quarter letter, our net returns year-to-date have surpassed the Barclay’s Total Return Fixed Income Aggregate by 3.7%, have been competitive with the S&P 500, which came in at 11.9%, and posted a real return of 4.24% over year-to-date CPI of 2.1% through December. We have achieved these results with limited volatility month to month. Seaport Total Asset Partners as of December 31, 2016 Comparative Year-to-Date Returns for Total Asset Partners, S&P 500, and Barclay’s Aggregate Total Return Politics and Economics Contrary to expectations in 2016, Brexit passed, Trump won the election, 10-year Treasury yields rose 100 basis points from the end of July, inflation year-over-year accelerated from under 1% to over 2%, and the Chicago Cubs won the World Series! One would expect markets to suffer losses in face of such uncertainty, but the S&P 500, which closed under 6% for the year at the end of October, finished the year up 11.9%. So much for consensus forecasts, including ours! -15.0% -10.0% -5.0% 0.0% 5.0% 10.0% 15.0% 1/1/2016 1/8/2016 1/15/2016 1/22/2016 1/29/2016 2/5/2016 2/12/2016 2/19/2016 2/26/2016 3/4/2016 3/11/2016 3/18/2016 3/25/2016 4/1/2016 4/8/2016 4/15/2016 4/22/2016 4/29/2016 5/6/2016 5/13/2016 5/20/2016 5/27/2016 6/3/2016 6/10/2016 6/17/2016 6/24/2016 7/1/2016 7/8/2016 7/15/2016 7/22/2016 7/29/2016 8/5/2016 8/12/2016 8/19/2016 8/26/2016 9/2/2016 9/9/2016 9/16/2016 9/23/2016 9/30/2016 10/7/2016 10/14/2016 10/21/2016 10/28/2016 11/4/2016 11/11/2016 11/18/2016 11/25/2016 12/2/2016 12/9/2016 12/16/2016 12/23/2016 12/30/2016 Jan Feb Mar Apr May Jun Jul Aug Sep Oct Nov Dec TAF AGG SPX
  • 2. Registered Investment Advisor Seaport Investment Management www.seaportIM.com 844.249.9463 2 Over the past 12 months, we have taken a cautious stance in managing our portfolio. Global economic growth has been anemic, valuations expensive, and market liquidity tight throughout the year. Whatever your political views, the results of the election will change the national political agenda and rearrange the various political coalitions in the government. The ultimate outcomes of this regime change are impossible to predict, but we believe they are likely to be positive for growth. A broad consensus appears to be emerging on the need for tax reform, investment in infrastructure, and deregulation—and the Republican party has the levers of power to implement all three. Investment in infrastructure is a clear and present need. In 2015 some 10% of the 610,000 bridges in the U.S., serving daily over 200 million drivers, were rated structurally deficient. At current levels of maintenance expenditures, it will take almost 20 years to replace them. The American Society of Civil Engineers reports that 32% of our major roads are in poor condition and gives the U.S. a D+ for infrastructure. Trump has quoted a $1 trillion target for investment in infrastructure over the next 10 years. With the time required to pass the necessary legislation and clear regulatory hurdles, little of this is likely to occur in 2017, but once the programs are in place, the level of investment could reach 0.5% of GDP, which is a meaningful number in an economy that has experienced growth of just 2.2% since 2009. On the subject of deregulation, the cost of compliance with federal regulations in 2015 was estimated at $1.9 trillion according to the Competitive Enterprise Institute’s annual survey. The number of pages in the Federal Register, which details every rule and regulation passed by Congress, has almost tripled since the 1970’s, and the cost of compliance almost certainly higher today with the regulatory burden of the Affordable Care Act. Small businesses, which account for 50% of all new jobs, are closing at a faster rate than they are opening. Regulation is consistently cited as one of the most significant concerns in surveys of small business owners by The National Federation of Small Business. Any reduction in regulatory compliance can’t help but have a positive impact on new business formation and growth. Two components to the broad based corporate tax reform currently under discussion: repatriation of overseas cash balances and lower corporate tax rates. We don’t believe that repatriating corporate cash will increase business investment in the face of limited pricing power and anemic revenue growth. A more likely outcome is the cash will be used to reduce debt and finance share buybacks. Corporate balance sheets and reported earnings per share will benefit, but the impact on economic growth will be marginal. Unlike repatriation of overseas cash, lower corporate tax rates should support both growth and wages. Among 188 countries surveyed by the Tax Foundation, the U.S. has the third highest corporate tax rate at 35%. Since 2000, most major trading partners of the U.S. have lowered corporate tax rates. While large multi-national companies have the resources and international domiciles to reduce taxes through sophisticated legal structures, this option has not been available to a broad swath of domestic American businesses. The inverse relationship between corporate tax rates, wages, and new business formation has been well documented. Trump has also proposed lowering marginal rates for individuals while broadening the tax base by eliminating many currently available deductions. In the past, such changes in tax policies have been politically challenging to implement because any tax cut will benefit the wealthy when those with income in the top 20% pay more than 80% of total individual income taxes. However, a tax regime, such as the one outlined by Treasury Secretary Mnuchin that offsets tax cuts for the wealthy with the elimination of deductions and directs the majority of
  • 3. Registered Investment Advisor Seaport Investment Management www.seaportIM.com 844.249.9463 3 benefits to the middle class, would be positive for growth since middle class wage earners tend to spend their disposable income while those in the top 20% will save a much larger portion of any incremental income they receive. Despite what could be highly favorable policies of the new administration, a populist policy of trade protectionism, to which the president appears to be committed, raises the specter of a trade war that could seriously undermine global and thereby domestic economic growth. That does not mean that changes in incentives to encourage domestic production, such as the border adjustments under discussion in the press, might accomplish similar objectives without the adversarial character and consequences of protectionist policies. However, the knock on effects of such policies on the dollar and inflation are difficult to predict and could be highly disruptive. Secular Trends Demographics, excessive sovereign debt, and declining productivity have impeded the pace of economic growth and slowed the recovery that began in June 2009. With the decline in birth rates since 1960, the growth of the labor force has slowed dramatically across most industrialized markets as their populations have grown older. It was excessive debt in the private sector to finance a housing bubble that caused the financial crisis and the ensuing recession of 2008-2009. The policies put in place in response transferred significant portions of this debt from private to public balance sheets. At the same time six years of artificially low interest rates have encouraged borrowing, driving private and public debt to record levels. To reduce real debt burdens, central banks are likely to keep interest rates low and tolerate higher inflation. A strong U.S. dollar from higher rates would threaten domestic manufacturing and employment, creating political risk in the current populist environment. Statements from the Fed to let the economy run hot should be taken seriously, which suggest the Fed will tolerate higher inflation rather than put any economic expansion at risk with higher interest rates. Over the next several years, deflationary forces are likely to recede as inflation picks up. The degree to which real growth follows depends, of course, on productivity gains and a successful implementation of the Administration’s economic programs. From the perspective of the market, however, there is no trend to take the place of the spectacular decline in interest rates from over 15% to under 2% that occurred over the past 30 years and took fixed income and equity valuations to historically expensive levels. Periods of extreme valuation are followed by periods of low returns. Investors who expect the experience of the past 30 years to repeat itself are likely to be disappointed. Economic Outlook After a weak start, domestic growth in 2016 staged a modest recovery over the balance of the year. Real growth came in at 1.6% for 2016 after the fourth quarter fell short of expectations due to a drop in exports. On a positive note, final sales to domestic purchasers, excluding inventories and exports, grew 2.5% in the fourth quarter, up from 2.1% in third. We believe growth in the US economy this year will fall in the range of 2% to 2.5%. With little slack remaining in the labor market, rising wages should continue to support growth in real incomes and personal consumption. A recovery in the energy sector and in manufacturing after a protracted inventory destocking cycle should support
  • 4. Registered Investment Advisor Seaport Investment Management www.seaportIM.com 844.249.9463 4 a modest increase in capital spending. Significant commitments to capital investments, however, will be delayed until the outline and timing of anticipated changes in tax and fiscal policy become clearer. After several years of false starts, there is a reasonable likelihood we will see two hikes in interest rates this year by the Fed. Meanwhile Libor continues to move higher with the benchmark 3-month rate now over 1% versus 0.61% at the beginning of 2016; the 10-year Treasury yield has risen from 1.78% before the election to 2.36%; and the U.S. monetary base, which has been contracting at over 11% year-over-year since the end of September, is down over 10% since the beginning of 2016. So far, the data does not indicate any significant threat of inflation in the near or intermediate term. The recession in corporate profits appears to have ended after 5 quarters of negative comparisons. We expect a gradual improvement in revenue growth, but a strong U.S. dollar will suppress pricing power for exports, while profit margins will come under pressure from increased wages, higher cost of energy, and to a lesser extent higher interest rates. A strong U.S. dollar poses the greatest risk to growth and market returns in 2017. By several measures the dollar appears overvalued, in some cases by as much as 20%. Any appreciation in the dollar poses risks to the domestic economy and the emerging market issuers of dollar-denominated debt. The Federal Reserve recognizes this risk and is likely err on the side of caution in raising rates. Nevertheless, the broad consensus of market commentators expects the dollar to remain strong, if not strengthen, which increases systemic risk from reverses in capital flows should the consensus prove wrong. Portfolio Strategy and Structure Expectations for the economy have improved with the election and investors have bid up stocks, sold fixed income securities, and bought the dollar. Unfortunately, new policies that get actually get implemented will have minimal impact in 2017 while debate over trade policy, tax reform, and the budget will likely fuel volatility. Across the spectrum in fixed income, most asset prices remain distorted by negative real interest rates with a quarter of the global fixed income assets trading at nominal (forget about real) negative yields. In the U.S, equity valuations rank in the 9th and 10th quartiles of virtually every measure of value that we follow. The chart on the next page, which we introduced in our last quarterly letter, plots enterprise value to net capital and 12-month rolling forward returns for the S&P 500 from 1990 through September 2016. We’ve chosen enterprise value to net capital as our valuation benchmark because it is based on physical assets and liabilities that can be measured precisely, unlike net income, which includes estimates and other arbitrary assumptions. It is a more stable valuation measure since it can be negative only under rare circumstances. Finally, companies do not trade below their net capital for long periods unless there are significant assets of questionable and hard-to- determine value on their balance sheets. Consider this a simpler version of Tobin’s Q Ratio, which measures market capitalization of stock to their replacement value, but requires a vastly greater number of estimates than enterprise value to net capital. The other element of the chart plots the 12-month forward returns for the S&P 500. In other words, for each point on the chart we’ve calculated the rolling return for the next 12 months. A comparison of the two series demonstrates the common sense point that lower future returns naturally follow higher valuations.
  • 5. Registered Investment Advisor Seaport Investment Management www.seaportIM.com 844.249.9463 5 At the end of December, the S&P 500 closed trading at an enterprise/net capital valuation of 1.51x. As you can see in the chart below, this comes close to the top of the range, leaving aside the elevated valuations that accompanied the telecom internet boom of the late 1990’s. We don’t consider this to be a tool for market timing, but it is hard to avoid the conclusion that equities are trading at historically high levels. S&P 500 Enterprise Value to Net Capital versus SPX Forward 12-month Returns, 1990-2016 Source: Bloomberg, Seaport Investment Management Against this backdrop, we enter 2017 with a just over a third of the portfolio in equities with a below market beta of 0.91 and above market yield of 3.1%. We have also maintained a defensive position in fixed income, which has limited exposure to rising interest rates with duration of 1.6 and a solidly investment grade average quality, as you can see in the table below. Seaport Total Asset Partners as of December 31, 2016 Exposure and Contribution to Gross Portfolio Returns by Asset Class -60% -40% -20% 0% 20% 40% 60% - 0.50 1.00 1.50 2.00 1990 1991 1992 1993 1994 1995 1996 1997 1998 1999 2000 2001 2002 2003 2004 2005 2006 2007 2008 2009 2010 2011 2012 2013 2014 2015 2016 12monthforwardrollingreturn enterprisevaluetonetcapital enterprise value/net capital forward 12-mo SPX rolling return gross returns category asset class exposure beta duration yield rating ytd ytd contrib Fixed Income Credit 36.7% 0.09 0.83 2.8% BBB2 3.61% 1.21% Mortgage 8.7% 0.03 3.01 2.4% B1 4.08% 0.48% Muni 4.6% 0.18 5.51 4.9% BBB1 4.60% 0.23% Fixed Income Total 50.0% 0.09 1.64 2.9% BBB3 3.82% 1.91% Equity Equity 26.3% 0.94 - 2.3% 14.60% 4.09% MLP 3.9% 0.86 - 5.7% 28.16% 0.95% REIT 4.5% 0.79 - 4.9% 7.91% 0.33% Options (0.4%) 1.20 - - 12.98% 0.16% Equity Total 34.3% 0.91 - 3.1% 15.02% 5.53% Commodity Commodity 1.1% 0.14 - - 6.77% 0.10% Commodity Total 1.1% 0.14 - - 6.77% 0.10% Cash Cash 14.6% - - - AAA - - Cash Total 14.6% - - - AAA - - Grand Total 100.0% 0.36 0.82 2.5% BBB1 7.54% 7.52%
  • 6. Registered Investment Advisor Seaport Investment Management www.seaportIM.com 844.249.9463 6 The positions in the table below were the top 15 contributors to portfolio returns in 2016 and accounted for over half of the gross return before fees and expenses of 7.52%. With the exception of the DoubleLine closed end credit and mortgage fund, the rest were high yielding equities from 11 different industries that benefitted from attractive valuations at the beginning of the year. Many of them are positions we have held over several years. Three of them—Brookfield Infrastructure Partnership Units, Macquarie Infrastructure Common Stock, and SJW Corp Common Stock—reflect our longstanding secular focus on companies that will benefit from positions in infrastructure and water supplies. Seaport Total Asset Partners as of December 31, 2016 Top 15 Contributors to Portfolio Returns Equities (34%) Equity exposure, which includes equities, MLP’s, REITs, and options, held more or less steady at 34%-35% over the fourth quarter. As a measure of volatility relative to the market, the beta of our equity portfolio increased marginally from 0.87 to 0.91, versus 1.0 for the S&P 500 (the beta for the entire portfolio is 0.35). To increase our exposure to water utilities and service providers, we added two new positions in the fourth quarter. The first, Consolidated Water Company, operates desalination plants in the Bahamas and several emerging market countries. We believe that operational mistakes in Indonesia have been resolved and that the company is moving steadily towards completion of a transaction to build and operate a large desalinization plant in Rosarita Mexico that will supply Baja and San Diego markets, both of which are coping with water shortages. This contract represents a catalyst that would lead to a revaluation of the stock on the back of a substantial increase in earnings. Currently, Consolidated Water yields 3% and trades slightly above book value at a discount to other water utilities. Our second addition is Econolab, a specialty chemical company that supplies a broad range of chemicals used to purify and process water across a broad range of industries. Econolab should benefit from increasing secular demand for water products and services. The stock currently yields 1.25% and anticipated dividends are expected to grow 6%-8% over the next several years. security asset class industry exposure ytd return ytd contrib Spectra Energy Common Stock Equity Pipelines 1.1% 65.0% 0.55% DoubleLine Income CEF (DSL) Credit Global Total Return 1.9% 30.3% 0.48% SJW Corp Common Stock Equity Utilities 1.0% 65.3% 0.43% Time Warner Common Stock Equity Broadcasting & Cable 0.9% 49.9% 0.35% AmeriGas Partners MLP MLP Pipelines 0.9% 42.2% 0.34% Xylem Common Stock Equity Diversified Manufacturing 0.9% 38.3% 0.31% Brookfield Infrastructure Ptnrship Units MLP Utilities 0.9% 38.9% 0.28% Republic Services Common Stock Equity Environmental 1.0% 31.0% 0.26% BlackRock CE Bank Debt Fund (FRA) Credit US Corporates 1.5% 18.7% 0.25% Macquarie Infrastructure Common Stock Equity Industrial Services 1.0% 25.6% 0.21% SunTrust Banks Common Stock Equity Banking 0.6% 58.4% 0.21% Seaboard Corp Common Stock Equity Food & Beverage 0.7% 38.9% 0.18% Everest Re Common Stock Equity Insurance 0.9% 20.9% 0.17% Alleghany Corp Common Stock Equity Insurance 0.7% 27.1% 0.17% Ventas REIT REIT Real Estate 0.8% 20.2% 0.17% Total 14.5% 37.0% 4.36%
  • 7. Registered Investment Advisor Seaport Investment Management www.seaportIM.com 844.249.9463 7 To expand our exposure to companies operating or building infrastructure we added Heidelberg Cement and 8Point3 Energy Partners L.P. Heidelberg Cement is positioned to benefit from infrastructure spending in both the U.S and global markets. We believe management’s announced strategy to double earnings and cash flow is achievable, even though the stock trades at a discount to its peer group and yields 1.5%. 8Point3 Energy Partners L.P operates solar energy facilities serving residential, commercial, and industrial users. With dramatic increases in solar efficiency and battery storage solar energy is becoming more competitive with other sources of electricity. The stock yields 7% with the potential for low double digit increases in the distribution over the next several years. Fixed Income (50%) We increased our exposure to fixed income securities in the fourth quarter from 45% to 50% primarily through short maturity bonds to achieve higher returns than we can earn on excess cash balances, which we reduced from 20% to 15%. In a period of rising interest rates, we remain understandably cautious towards investment grade corporate debt. Long term debt issued by the S&P 500 companies has risen 75% since 2010 and leverage ratios have risen to levels that appear excessive at this late stage of the business cycle. The rating agencies have taken notice and downgrades have increased. We continue to manage our fixed income risk actively with a short position in the iShares Investment Grade ETF (LQD), currently at 2.3% of the total portfolio and 24% of portfolio duration. LQD reduces the duration of our fixed income holdings by that amount and limits our exposure to rising interest rates and widening credit spreads. The incremental yield offered by non-agency mortgage and high yield bonds has narrowed substantially over the past year, and, in aggregate, offers little in the way of returns beyond the current yield. Our positions in these sectors are determined by individual issue selection, rather than a broader allocation to the sectors, which are trading a historically rich levels. In contrast to mortgages and high yield, which have managed to hold their value, municipal bonds were hit hard after the election. Proposed cuts to individual tax rates would not only reduce the value of the municipal tax exemption, but would also weaken the credit quality of hospitals and states from any repeal of the Affordable Care Act. These concerns drove the ratio of municipal to treasury yield to the highest levels since the summer of 2015. The biggest factor affecting the magnitude and duration of any move higher in municipal yields may be where corporate tax rates land. At a 20%-25% tax rate, insurance companies and banks, the most significant corporate buyers, would demand higher yields to compensate for lower rates after taxes. The cost to us of the market adjustment to a lower corporate tax rate is less than the capital gains we would have to pay if we sold our municipal holdings. We continue to avoid issuers with substantial unfunded pension obligations while seeking opportunities from potential dislocations in this sector.
  • 8. Registered Investment Advisor Seaport Investment Management www.seaportIM.com 844.249.9463 8 We are appreciative of our Seaport clients who share our view of long-term, fundamental, value-driven investing, independent of short-term market moves. Thank you for your continued trust and support. Sincerely, Ben Trosky January 30, 2017 Legal Disclaimer Although the information contained herein has been obtained from sources Seaport Wealth Management, LLC, doing business as Seaport Investment Management (hereinafter “Seaport Investment Management” or “Seaport”) believes to be reliable, its accuracy and completeness cannot be guaranteed. This correspondence is for informational purposes only and under no circumstances should be construed as an offer to sell, or a solicitation to buy, any security. At various times Seaport may have positions in and effect transactions in securities referred to herein. Any recommendation contained in this correspondence may not be appropriate for all investors. The recipient must independently evaluate any investment including the tax, legal, accounting and credit aspects of any transaction. Instruments and trading strategies of the type described herein may involve a high degree of risk, and the value of such instruments may be highly volatile and may be adversely affected by the absence of a market to provide liquidity. Additional information is available upon request. This communication includes data about capital markets generally for discussion purposes only. It should not be assumed that market conditions will be the same in the future. This communication also contains “forward-looking statements” based on certain assumptions (e.g., availability and terms of investments and market conditions) that may not be available to, experienced or realized by the Fund. In addition, information contained in this document constitutes “forward-looking statements,” which can be identified by the use of forward- looking terminology such as “may”, “will”, “should”, “expect”, “anticipate”, “target”, “project”, “estimate”, “intend”, “continue” or “believe” or the negatives thereof or other variations thereon or comparable terminology. Due to various risks and uncertainties, actual events or results or the actual performance of the Fund may differ materially from those reflected or contemplated in such forward-looking statements. No part of this article may be reproduced in any form, or referred to in any other publication, without express written permission of Seaport Investment Management. ©2017, Seaport Investment Management.