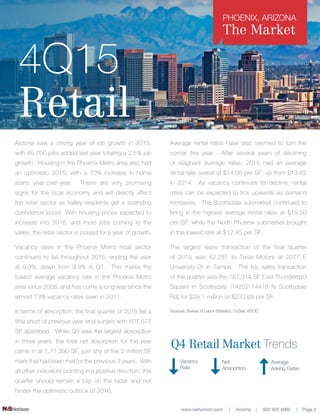
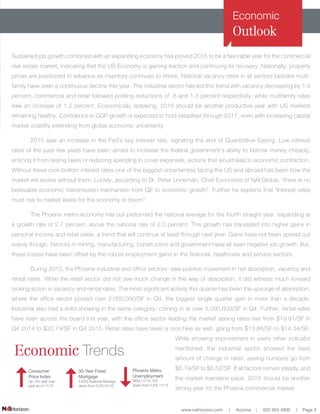
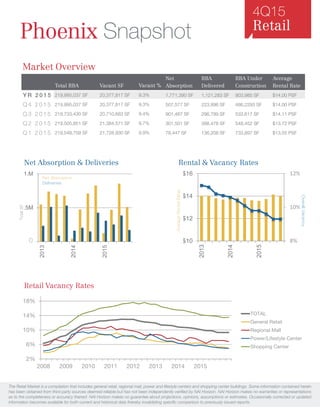
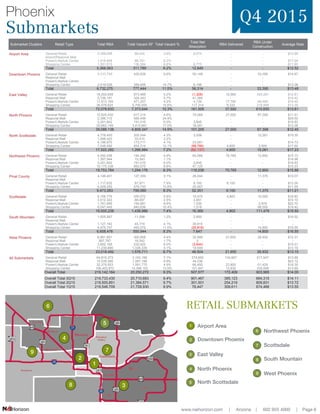
The retail market report summarizes 2015 trends in the Phoenix metro area. It notes that 65,700 jobs were added in 2015, home starts increased 70% year-over-year, and these economic gains are boosting consumer confidence. Retail vacancy rates declined to 9.3% while net absorption was 1.77 million square feet. Average rental rates increased to $14/sqft, up from $13.62/sqft in 2014. The report concludes that with continued job and housing growth, the retail sector is poised for growth in 2016.
2. www.naihorizon.com | Arizona | 602 955 4000 | Page 2
Arizona saw a strong year of job growth in 2015,
with 65,700 jobs added last year totaling a 2.5% job
growth. Housing in the Phoenix Metro area also had
an optimistic 2015, with a 70% increase in home
starts year-over-year. These are very promising
signs for the local economy and will directly affect
the retail sector as Valley residents get a spending
confidence boost. With housing prices expected to
increase into 2016, and more jobs coming to the
valley, the retail sector is poised for a year of growth.
Vacancy rates in the Phoenix Metro retail sector
continued to fall throughout 2015, ending the year
at 9.3%, down from 9.9% in Q1. This marks the
lowest average vacancy rate in the Phoenix Metro
area since 2008, and has come a long way since the
almost 13% vacancy rates seen in 2011.
In terms of absorption, the final quarter of 2015 fell a
little short of previous year-end surges with 507,577
SF absorbed. While Q3 saw the largest absorption
in three years, the total net absorption for the year
came in at 1,71,390 SF, just shy of the 2 million SF
mark that had been met for the previous 3 years. With
all other indicators pointing in a positive direction, this
quarter should remain a blip on the radar and not
hinder the optimistic outlook of 2016.
Average rental rates have also seemed to turn the
corner this year. After several years of declining
or stagnant average rates, 2015 had an average
rental rate overall of $14.00 per SF, up from $13.62
in 2014. As vacancy continues its decline, rental
rates can be expected to tick upwards as demand
increases. The Scottsdale submarket continued to
bring in the highest average rental rates at $19.50
per SF, while the North Phoenix submarket brought
in the lowest rate at $12.45 per SF.
The largest lease transaction of the final quarter
of 2015 was 42,281 to Tesla Motors at 2077 E
University Dr in Tempe. The top sales transaction
of the quarter was the 167,314 SF East Thunderbird
Square in Scottsdale (14202-14418 N Scottsdale
Rd) for $39.1 million or $233.69 per SF.
PHOENIX, ARIZONA
The Market
Sources: Bureau of Labor Statistics, CoStar, ADOD
Vacancy
Rate
Net
Absoprtion
Average
Asking Rates
Q4 Retail Market Trends
4Q15
Retail
PHOENIX, ARIZONA
The Market
3. www.naihorizon.com | Arizona | 602 955 4000 | Page 3
Economic
Outlook
Economic Trends
Consumer
Price Index
Up .5% year over
year as of 11/15
30-Year Fixed
Mortgage
3.65% National Average,
down from 3.5% 01/15
Phoenix Metro
Unemployment
MSA,11/15- 5%
down from 5.6% 11/14
Sustained job growth combined with an expanding economy has proved 2015 to be a favorable year for the commercial
real estate market, indicating that the US Economy is gaining traction and continuing its recovery. Nationally, property
prices are positioned to advance as inventory continues to shrink. National vacancy rates in all sectors besides multi-
family have seen a continuous decline this year. The industrial sector has led this trend with vacancy decreasing by 1.4
percent, commercial and retail followed posting reductions of .8 and 1.3 percent respectfully, while multifamily rates
saw an increase of 1.2 percent. Economically speaking, 2016 should be another productive year with US markets
remaining healthy. Confidence in GDP growth is expected to hold steadfast through 2017, even with increasing capital
market volatility extending from global economic uncertainty.
2015 saw an increase in the Fed’s key interest rate, signaling the end of Quantitative Easing. Low interest
rates of the past few years have been aimed to increase the federal government’s ability to borrow money cheaply,
enticing it from raising taxes or reducing spending to cover expenses, actions that would lead to economic contraction.
Without these rock bottom interest rates one of the biggest uncertainties facing the US and abroad has been how the
market will evolve without them. Luckily, according to Dr. Peter Linneman, Chief Economist of NAI Global, “there is no
believable economic transmission mechanism from QE to economic growth”. Further he explains that “Interest rates
must rise to market levels for the economy to boom”.
The Phoenix metro economy has out preformed the national average for the fourth straight year, expanding at
a growth rate of 2.7 percent, above the national rate of 2.0 percent. This growth has translated into higher gains in
personal income and retail sales, a trend that will continue at least through next year. Gains have not been spread out
evenly though, Sectors in mining, manufacturing, construction and government have all seen negative job growth. But,
these losses have been offset by the robust employment gains in the financial, healthcare and service sectors.
During 2015, the Phoenix industrial and office sectors- saw positive movement in net absorption, vacancy and
rental rates. While the retail sector did not see much change in the way of absorption, it did witness much forward
looking action in vacancy and rental rates. The most significant activity this quarter has been the upsurge of absorption,
where the office sector posted over 2,000,000/SF in Q4, the biggest single quarter gain in more than a decade.
Industrial also had a solid showing in the same category, coming in at over 3,000,000/SF in Q4. Further, rental rates
have risen across the board this year, with the office sector leading the market seeing rates rise from $19.91/SF in
Q4 2014 to $20.79/SF in Q4 2015. Retail rates have taken a nice hike as well, going from $13.88/SF to $14.34/SF.
While showing improvement in every other indicator
mentioned, the industrial sector showed the least
amount of change in rates, seeing numbers go from
$6.19/SF to $6.52/SF. If all factors remain steady, and
the market maintains pace, 2016 should be another
strong year for the Phoenix commercial market.
4. Retail Vacancy Rates
4Q15
Retail
Phoenix Snapshot
Market Overview
2%
6%
10%
14%
18%
2008 2009 2010 2011 2012 2013 2014 2015
TOTAL
General Retail
Regional Mall
Power/Lifestyle Center
Shopping Center
Vacant %
9.3%
9.3%
9.4%
9.7%
9.9%
Net
Absorption
1,771,390 SF
507,577 SF
901,467 SF
301,501 SF
78,447 SF
RBA Under
Construction
903,985 SF
486,2293 SF
533,617 SF
548,452 SF
733,897 SF
RBA
Delivered
1,121,283 SF
223,896 SF
296,799 SF
398,478 SF
136,208 SF
Vacant SF
20,377,817 SF
20,377,817 SF
20,710,683 SF
21,384,571 SF
21,728,930 SF
Total RBA
219,995,037 SF
219,995,037 SF
219,733,430 SF
219,505,851 SF
219,548,709 SF
Average
Rental Rate
$14.00 PSF
$14.00 PSF
$14.11 PSF
$13.72 PSF
$13.55 PSF
Y R 2 0 1 5
Q 4 2 0 1 5
Q 3 2 0 1 5
Q 2 2 0 1 5
Q 1 2 0 1 5
The Retail Market is a compilation that includes general retail, regional mall, power and lifestyle centers and shopping center buildings. Some information contained herein
has been obtained from third party sources deemed reliable but has not been independently verified by NAI Horizon. NAI Horizon makes no warranties or representations
as to the completeness or accuracy thereof. NAI Horizon makes no guarantee about projections, opinions, assumptions or estimates. Occasionally corrected or updated
information becomes available for both current and historical data thereby invalidating specific comparison to previously issued reports.
.M
.5M
1.M
2013
2014
2015
Net Absorption & Deliveries
8%
10%
12%
$10
$12
$14
$16
2013
2014
2015
Rental & Vacancy Rates
AverageRentalRates
OverallVacancy
Net Absorption
Deliveries
TotalSF
0
5. www.naihorizon.com | Arizona | 602 955 4000 | Page 5
NAI Horizon
Featured
Transactions
Round Valley Plaza
205 South Mountain Ave | Springerville
Size: 26,700 SF
Tenant: Shopko
Leased: November 2015
2980 N Alma School Rd
Chandler, AZ
Warner Village
1342 W Warner Rd & 8707 S Priest Dr | Tempe
Size: 19,643 SF
Price: $4.47 million
Sold: December 2015
Size: 25,000 SF
Tenant: Planet Fitness
Leased: July 2015
7000 E Mayo Blvd
Scottsdale, AZ
Size: 7,600 SF
Tenant: Denny’s
Leased: March 2015
McClintock Fountains
NEC McClintock & Warner | Tempe, AZ
Size: 6,400 SF
Tenant: Zipp’s Sports Grill
Leased: December 2015
Mercado del Lago
8300-8320 N Hayden Rd| Tempe
Size: 61,319 SF
Price: $8.8 million
Sold: August 2015
6. www.naihorizon.com | Arizona | 602 955 4000 | Page 6
Submarket Clusters Retail Type Total RBA Total Vacant SF Total Vacant %
Total Net
Absorption
RBA Delivered
RBA Under
Construction
Average Rate
General Retail 2,398,099 86,434 3.6% 6,074 - - $10.59
Airport/Regional Mall - - - - - - -
Power/Lifestyle Center 1,418,849 88,791 6.3% - - - $17.94
Shopping Center 1,551,615 136,564 8.8% 6,775 - - $11.85
Total 5,368,563 311,789 6.2% 12,849 - - $12.52
General Retail 4,313,749 420,838 9.8% 50,148 - 33,395 $14.87
Regional Mall - - - - - - -
Power/Lifestyle Center - - - - - - -
Shopping Center 2,418,526 356,606 14.7% 6,166 - - $12.08
Total 6,732,275 777,444 11.5% 56,314 - 33,395 $13.48
General Retail 18,250,659 873,489 5.2% (1,328) 10,560 343,291 $12.81
Regional Mall 5,736,181 328,343 5.7% 41,385 - $18.42
Power/Lifestyle Center 11,513,169 471,257 4.2% 4,134 17,700 48,450 $19.45
Shopping Center 36,578,624 5,700,555 15.6% 117,314 9,332 218,909 $13.35
Total 72,078,633 7,373,644 10.3% 161,505 37,592 610,650 $13.61
General Retail 12,825,435 617,214 4.8% 79,269 27,000 67,398 $11.51
Regional Mall 2,396,712 585,456 24.4% - - - $29.50
Power/Lifestyle Center 3,201,842 191,016 6.0% 3,845 - - $18.83
Shopping Center 20,662,149 3,415,661 17.0% 18,091 - - $12.28
Total 39,086,138 4,809,347 14.9% 101,205 27,000 67,398 $12.45
General Retail 4,778,400 205,544 4.3% 3,558 - 12,261 $19.35
Regional Mall 1,498,420 33,415 2.2% - - -
Power/Lifestyle Center 4,196,970 173,711 4.1% 23,091 - $14.73
Shopping Center 7,048,492 854,314 12.1% (88,786) 4,600 2,800 $17.60
Total 17,522,282 1,266,984 7.2% (62,137) 4,600 15,061 $17.23
General Retail 4,050,436 194,242 4.8% 65,066 70,765 12,900 $15.13
Regional Mall 1,397,944 15,343 1.1% - - - $14.99
Power/Lifestyle Center 3,201,842 191,016 6.0% 3,845 - - $18.83
Shopping Center 10,175,338 893,575 8.8% 47,125 - - $15.23
Total 19,753,784 1,294,176 6.3% 116,036 70,765 12,900 $15.88
General Retail 4,146,401 127,359 3.1% 26,244 - 11,370 $10.07
Regional Mall - - - - - - -
Power/Lifestyle Center 1,117,632 87,971 7.9% 6,100 6,100 - $12.00
Shopping Center 4,209,250 579,730 13.8% 20,007 - - $11.55
Total 9,473,283 795,060 8.3% 52,351 6,100 11,370 $11.21
General Retail 6,158,776 355,572 5.8% 10,470 4,802 10,000 $18.83
Regional Mall 3,512,322 88,097 2.5% 2,851 - $72.10
Power/Lifestyle Center 1,781,695 154,681 8.8% 1,530 - 2,979 $22.70
Shopping Center 8,047,445 840,636 10.4% 1,518 - 98,500 $19.42
Total 19,500,238 1,438,986 7.4% 16,369 4,802 111,479 $19.50
General Retail 1,005,567 11,598 1.2% 2,850 - - $16.52
Regional Mall - - - - - - -
Power/Lifestyle Center 1,127,162 45,774 4.1% 30,615 - - -
Shopping Center 4,475,747 493,572 11.0% (25,818) - 14,800 $16.55
Total 6,608,476 550,944 8.3% 7,647 - 14,800 $16.55
General Retail 6,891,851 300,908 4.4% 32,599 21,650 26,932 $12.31
Regional Mall 997,787 16,542 1.7% 0 - - -
Power/Lifestyle Center 3,892,168 232,922 6.0% (3,644) - - $15.01
Shopping Center 11,236,686 1,026,339 9.1% 19,549 - - $13.19
Total 23,018,492 1,576,711 6.7% 48,504 21,650 26,932 $13.15
General Retail 64,819,373 3,193,198 7.1% 274,950 134,667 517,547 $13.89
Regional Mall 15,539,366 1,067,196 6.9% 44,236 - - $23.12
Power/Lifestyle Center 32,379,553 1,591,775 4.9% 66,450 23,800 51,429 $18.35
Shopping Center 106,403,872 14,398,103 13.5% 121,941 13,932 335,009 $13.65
Overall Total 219,142,164 20,250,272 9.3% 507,577 172,409 903,985 $14.00
Overall Total 3Q15 219,733,430 20,710,683 9.4% 901,467 385,123 684,315 $14.11
Overall Total 2Q15 219,505,851 21,384,571 9.7% 301,501 254,219 809,831 $13.72
Overall Total 1Q15 219,548,709 21,728,930 9.9% 78,447 309,611 674,466 $13.55
All Submarkets
Northwest Phoenix
Pinal County
Scottsdale
South Mountain
West Phoenix
Airport Area
Downtown Phoenix
East Valley
North Phoenix
North Scottsdale
Q4 2015Phoenix
Submarkets
Airport Area1
2
3
4
5
RETAIL SUBMARKETS
East Valley
Downtown Phoenix
North Scottsdale
North Phoenix
6 Northwest Phoenix
7 Scottsdale
8
9
South Mountain
West Phoenix
1
2
3
4
5
6
7
8
9
7. www.naihorizon.com | Arizona | 602 955 4000 | Page 7
Retail Specialists
Gabe Ortega
Vice President
gabe.ortega@naihorizon.com
Horth Hong
Vice President
horth.hong@naihorizon.com
Shelby Tworek
First Vice President
shelby.tworek@naihorizon.com
Paul Honeycutt
Vice President
paul.honeycutt@naihorizon.com
Sharon Reeves
First Vice President
sharon.reeves@naihorizon.com
Chris Gerow
Senior Vice President
chris.gerow@naihorizon.com
NAI Horizon knows commercial real estate. With over 25 years in the Valley, NAI Horizon’s extensive market insight
allows us to match client needs with the right solutions. NAI Global member firms span the U.S. and 54 other
countries, with more than 375 offices and more than 6,700 local market experts on the ground. Supported by the
central resources of the NAI Global organization, member firms deliver market-leading services locally, and combine
their in-market strengths to form a powerful bond of insights and execution for clients with multi-market challenges.
www.naihorizon.com
We are here.
Phoenix
@naihorizon
naihorizonblog.com
facebook.com/NAIHorizon
Jennifer Keeler
Senior Associate
kim.kristoff@naihorizon.com
Patrick Anthon
Retail Specialist
patrick.anthon@naihorizon.com
8. 2944 N 44th Street, Suite 200
Phoenix, Arizona 85018
tel +1 602 955 4000
www.naihorizon.com
RetailMarket Report
Year End
2015
REPORT PREPARED BY:
Marissa Russo
Marketing & Research/GIS Manager
marissa.russo@naihorizon.com
Jonathan Collins
Research/GIS