SlideShare a Scribd company logo
1 of 17
Economic growth is slowing down
Globalization contributes many advantages to the global
economy. The global boom is the result from globalization.
Economy had a rapid growth after 1990s. But the globalization
also carries some problems to the economic. As a result, the
economic growth is slowing down in recent years.
In the article The steam has gone out of globalization, the
author states that the globalization is leading our economy to a
new era called “slowbalisation”. The economy has a robust
growth during the golden age of the globalization in 1990-2010.
But the economic growth rate become slower in recently years
because the benefits from the globalization is almost used up.
The cost of shipping has stop falling, multinational firms find a
hard time survive in both global markets and the local markets.
Meanwhile activity is shifting towards service, which is harder
to trade across the borders. Those are the factors cause the
slowbalisation. And globalization remains many issues that slow
the economy down in the recent years.
First, the decline of the total investment in the market
caused the economic growth to slow down. Investment is a very
significant factor that effect the long-term aggregate supply. If
the long-term aggregate supply doesn’t increase, the rise in the
aggregate demand will cause inflation but not economic growth.
Moreover, the high geopolitical risk makes firms unwilling to
put investment in countries and industries that carry high risk.
In the article, “global value of cross-border investment by
multinational companies sank by about 20% in 2018”
(Slowbalisation, page 2 para 3). And the decline in the payoff of
from the investment also slow down the economy. Globalization
bring the production cost significantly lowered than before. But
after the cost of shipping has stop falling and the labor cost can
not be reduced, firms can not lower the production cost anymore
therefore lower the total payoff from investment. This means a
country need to put more money in the investment in order to
reach the same economic growth as before, which is not
sustainable (Ip).
Since the benefits from the globalization become less
significant, trade conflict between two countries become more
ordinary in recent years that reduce the chance of cooperation in
economic and slow down the economic. Country like the United
States is now putting more attention to the domestic economic
growth rather than the global economic growth. Trade conflict
between U.S. and China is the trigger for the latest slowing (Ip).
Moreover, the high tariff set by the U.S. government even hurt
its small domestic business because of the increasing cost in
production (Guo). As a result, trade behavior between countries
will become more regional.
The divergent monetary policies between America and the
rest of the world will hurt the economy in the emerging
markets. The Federal Reserve has already raised the interest
rate 8 times while the European Central Bank has no plan to rise
their interest rate (The world economy, page 1 para 3). And
China on the other hand, is having relaxed monetary policy in
order to offset the outcome from trade war. The current
situation that strength the dollar in the world and makes it
harder for emerging markets to repay their debts (The world
economy, page 1 para 3). A measurement indicates that
emerging markets account for 59% of world’s output. Therefore,
a financial crisis in the emerging markets will definitely
slowdown the global economy and even lead to a recession.
In conclusion, decline in investment, trade conflict and the
crisis in the emerging markets are some of the problems carried
by the globalization when its benefits the economy less than
before. And the global economy is stagnating because of that.
measures of global integration
From this chart we can see eight measures of GDP are in retreat
or stagnating.
Works Cited
Ip, Greg. “The Global Boom, Barely Begun, May Be Over.” The
Wall Street Journal, Dow Jones & Company, 24 Jan. 2019.
“The Steam Has Gone out of Globalisation.” The Economist,
The Economist Newspaper, 24 Jan. 2019.
“The next Recession.” The Economist, The Economist
Newspaper, 11 Oct. 2018.
“Globalisation Has Faltered.” The Economist, The Economist
Newspaper, 24 Jan. 2019.
Yuwei Guo. “slowbalisation” Economic Rhetoric: Using
Economic Theory and Empirical Evidence in Arguing Policy.
UC Santa Cruz. Santa Cruz. 23 January 2019. Lecture.
CBO: Shutdown Will Cost Government $3 Billion of Projected
2019 GDP
The deficit is expected to total $897 billion in 2019
By
Kate Davidson
Updated Jan. 28, 2019 10:38 a.m. ET
WASHINGTON—The partial government shutdown that ended
Friday will cost the government about $3 billion and will
subtract about 0.4 percentage point from annualized gross
domestic product growth in the first quarter, the nonpartisan
Congressional Budget Office said Monday.
In new estimates of the shutdown’s impact, the CBO said the
shutdown dampened economic activity mainly because of the
roughly 380,000 furloughed workers who weren’t contributing
to GDP, as well as the delay in federal spending on goods and
services and the reduction in aggregate demand.
The estimates, which the CBO cautioned are highly uncertain,
don’t incorporate other indirect negative effects of the
shutdown, such as businesses that couldn’t obtain federal
permits or access loans while the government was partially
closed.
“Such factors were probably beginning to lead firms to postpone
investment and hiring decisions,” the CBO said, adding that
risks to the economy were becoming increasingly significant as
the shutdown continued.
“Although their precise effects on economic output are
uncertain, the negative effects of such factors would have
become increasingly important if the partial shutdown had
extended beyond five weeks,” the report said.
The CBO estimated the 35-day shutdown, which was the longest
in U.S. history, reduced fourth-quarter GDP by $3 billion, or
0.1%. The level of real GDP in the first quarter, which ends
March 30, is expected to be $8 billion lower than it would have
been, or 0.2% lower.
Economic growth is expected to be higher in subsequent
quarters this year, as the economy makes up some of the lost
ground. But the CBO estimates about $3 billion—or 0.02% of
projected annual GDP in 2019—will never be recovered.
In estimates prepared before the shutdown, the agency projected
the economy would grow 2.3% in 2019.
President Trump on Friday reached a deal with congressional
leaders to reopen the government for three weeks while
Republicans and Democrats negotiate over border security
provisions in a new spending bill.
Although a shutdown temporarily halts government operations,
previous shutdowns have imposed significant direct and indirect
costs, including billions of dollars in back pay, lost output by
federal workers and weaker economic growth.
Two separate shutdowns in fiscal year 1996 cost the government
about $1.4 billion over 26 days, the Office of Management and
Budget said at the time. The 16-day shutdown in 2013 cost
roughly $2 billion in retroactive pay to furloughed employees,
plus billions more in lost economic output, according to OMB.
Kevin Hassett, the chairman of the White House Council of
Economic Advisers, said Wednesday the U.S. economy may not
grow at all in the first quarter if the shutdown continued
through March. But he added that the economy should recover
any lost ground once the government reopens.
The CBO also estimated the budget deficit would total $897
billion in 2019, and pushed back its estimate for when budget
deficits will exceed $1 trillion to 2022. Last year, the agency
saw deficits topping $1 trillion next year, as government outlays
continue to outstrip revenue growth.
The shift mainly reflected lower projected spending this year on
emergencies, such as hurricanes and wildfires, as well as lower
projected interest rates, which translates to lower expected
interest costs on government debt.
The CBO also projected federal deficits would average $1.2
trillion a year over the next decade, or 4.4% as a share of gross
domestic product, much higher than the 2.9% average over the
past 50 years. Government debt is projected to swell from 78%
of GDP in 2018 to 93% at the end of 2029.
Guidelines for Article Exploration Assignments:
TECHNICAL REQUIREMENTS:
· 1-inch margins all around (we will measure, YOU must make
sure that your printer is printing correctly, this is not my or the
grader’s responsibility, it is yours.)
· Please use MLA formatting for your references.
· Use a clear, readable, font such as Verdana, Calibri, Tahoma
or Arial, etc. Please be consistent and use the same font
throughout.
· Use black text on a white background. Avoid colored
backgrounds or text in a color other than black unless you have
special permission to use them (for example, if you're dyslexic).
· Use 12-point font for the body of your assignment.
· Use double spacing, only one-line space between paragraphs
· Left-justify your work (also known as left-aligned).
· Use bold for headings. Not underlining or italics.
· You must have 50 FULL lines of text at the minimum and 100
FULL lines of text at the maximum.
· You must have a(n) Title, Introduction, Thesis Statement,
Transitions, Topic Sentences, Body Paragraphs, Conclusion, and
References Page(s).
· As well as a reference page, parenthetical references are
required within the text of the paper. The reference page(s) DO
NOT count towards your 50-100 FULL lines of text.
· Graphs and Tables are required for the Article Understanding
assignments. These (Graphs and Tables) should each have their
own page with a title (on the top of the page) and a description
of no less than two sentences (below the table or graph). These
pages DO NOT count towards your 50-100 FULL lines of text,
and should be located after the conclusion and before the
references.
· All papers should include a header on the front page. This
header DOES NOT count toward your 50-100 FULL lines of
text. It should include:
· Your name
· Student ID#
· The Course Number
SPECIFIC REQUIREMENTS:
· You cannot use contractions
· UP TO (no more than) one paragraph (10 lines) may
summarize the article(s) itself (themselves).
· Must have relevant charts/figures/equations.
· Must have reference page (4 references) and in text
parenthetical references.
· Must have policy implications or suggestions in the conclusion
of the essay.
Your essays should focus on one of the following major topics:
Macro:
Economic Growth; Unemployment, Inflation; Monetary Policy;
or Fiscal Policy.
Micro:
Demand, Supply, and Equilibrium; Elasticity; Consumer
Demand Theory; Theory of Production; Costs of Production;
Opportunity Cost; Market Structure; Competition; Game
Theory; Labor; Welfare; or Economics of Information.
My Thoughts:
You are writing about an idea in the article (many are listed
above), and you are using the article as a baseline reference
point for the overarching idea.
What are the policy implications or suggestions of the idea(s) in
the article(s)?
Your supporting paragraphs should use your technical
knowledge of economics in order to support or refute the
original claims of the article, or claims made by your own
personal opinions. This means that you have to take some time
(space: 1 or 2 sentences) to talk about the theoretical economic
model involved (labor market, goods market, AD-AS, etc.).
10 years after the Great Financial Crash: Economics needs more
than ‘Reformation’
Steve Keen
Published time: 28 Dec, 2017 16:15
The only way to avoid future financial crashes is to
revolutionize economics because catastrophic turmoil is built
into the current system.
A year ago, I was looking forward to 2017 as the tenth
anniversary of an event that
mainstream “neoclassical” economists said couldn’t happen: the
global financial crisis which kicked off in 2007. You’d have
thought the epoch would have presented a chance to reflect on
the past, but it turned out the reflection on that event by the
economics profession and the financial press was minimal: it
was an event they’d rather forget than commemorate.
There was only trivial coverage of the anniversary in the
mainstream media. For instance, the UK media could have made
a big song and dance of it being ten years since the collapse of
Northern Rock since it was the first bank run in Britain for 150
years. But there were only a couple of light articles in the
Financial Times (“In charts: UK banking ten years after
Northern Rock”; “Ten years after Northern Rock: has UK
banking changed?”) a fluff piece by BBC TV—in which I was
interviewed, but not understood (“BBC Business Live interview
on 10th anniversary of Northern Rock”)—and a smattering of
coverage elsewhere.
Because learning lessons from history now seems to be so last
century!
Thus, just as it was only the rebel economists like me who saw
the crisis coming, it was only the rebels who
indeed commemorated it. One way we did was by latching on to
another anniversary in 2017: it was 500 years since Martin
Luther triggered the Reformation by nailing his 95 Theses to the
door of All Saints Church in Wittenberg. Rather late in the year,
some students suggested using this anniversary as a hook to call
for a ‘Reformation of Economics.’Future's the past
I gladly took part in it, dressing up in a monk’s
robe, speaking briefly (along with The Guardian’s Larry Elliott,
and the prominent heterodox economists Vicki Chick, Mariana
Mazzucato, and Kate Raworth), and then blue-tacking a hastily
and committee-drafted 33 Theses to the entrance to the London
School of Economics.
That event has garnered more critical reaction from mainstream
economists than the tenth anniversary of the crisis itself,
including Ben Chu’s recent piece in The
Independent stating that “The economics profession does not
need a ‘reformation’.”
I’m going to surprise Ben by agreeing with him. Economics
doesn’t need a Reformation: it needs a scientific revolution,
similar to that triggered by Copernicus’s publication of “On the
Revolutions of the Heavenly Spheres” in 1543.
The astronomical orthodoxy when Copernicus published
Revolutions was Ptolemy’s model, which put the Earth at the
center of the Universe, with the Sun, Moon, planets, and stars
rotating about it on perfect spheres called Deferents. However,
their observed motion wasn’t perfectly circular, so Ptolemy
offset the center of the Universe slightly from Earth itself, and
added other elements to explain other anomalies—especially the
apparent reversal of the direction of the planets. Here he had the
brilliant idea of placing them on other circles (called Epicycles)
which rotated on their Deferents so that sometimes they traveled
east to west in the sky as seen from Earth, and other times west
to east.
There was just one problem: this model of the Universe was
fundamentally wrong. But this didn’t stop Ptolemaic
astronomers because Ptolemy’s basic paradigm of circles on
circles was capable of describing any path by any object in
space. They spent their time devising and perfecting this
paradigm, generating models which could predict the motion of
the planets for centuries ahead.
Then along came Copernicus, with an initially less accurate
(because he still thought that the planets had circular orbits) but
fundamentally correct model, which put the Sun, and not the
Earth, at the center of the Solar System.
This was the first great scientific revolution, and it inverted our
understanding of the Universe: rather than the Sun orbiting the
Earth, the Earth orbited the Sun; rather than the stars being
nearby, they were far away; and gravity, not God, told
the “Heavenly Bodies” how to move.
The revolution in astronomy that Copernicus triggered with his
fundamentally different paradigm took over a century. And
Galileo played a key role here, by building the first serious
telescope and observing four of Jupiter’s moons—which orbited
Jupiter rather than the Earth. Faced with both a far simpler
model, and observations that were serious anomalies in
Ptolemy’s theory, the old way of thinking gave way to the
new.Slow coaches
This revolution didn’t come peacefully, and it wasn’t led by the
Ptolemaic astronomers themselves, but by new entrants to the
field—including, crucially, Isaac Newton, whose equations of
motion provided a mathematical explanation for why the orbits
of planets were elliptical rather than circular.
I hope that the revolution we need in economics takes less than
a century, but if it is left to today’s neoclassical economists, it
won’t happen at all. That revolution says the economy is not in
or even near its equilibrium, but far from equilibrium; that
cycles are caused not by exogenous shocks to a stable system,
but by the inherent cyclicality of a complex system, where the
whole is far more than the sum of its parts; and that money,
rather than merely a “veil over barter” which can be ignored in
macroeconomic modeling (Oh, you didn’t realize that
mainstream economists don’t include banks, debt and money in
their models?), is crucial to both the functioning of capitalism
and its occasional financial crises, of which 2007 was merely
the most recent example.
Instead, like Ptolemaic astronomers confronted with the
existence of Jupiter’s moons, they’re busy adding “financial
frictions” (the equivalent of Epicycles) to their equilibrium
models, and disparaging critics in the belief that their
framework is the only way one can do macroeconomic
modeling.Cross purposes
Balderdash. What they are instead illustrating is how little they
know about alternative modeling approaches that dominate
genuine sciences today.
I’m rather glad the students chose to pin their Theses to the
door of the London School of Economics, because the most
recent example of economists displaying ignorance while
thinking they were being wise came from Professor Reis of the
LSE, in a paper entitled“Is something really wrong with
macroeconomics?” In defending economics against the criticism
that it didn’t forecast the 2007 crisis, he argued that this didn’t
look so bad when you compared economic forecasting to
weather forecasting over the same time horizon:
“Comparing macroeconomic forecasts to forecasts of average
temperature or precipitation over the next 1-5 years, as opposed
to over the next few days, it is far from clear that economic
forecasting is doing so poorly. (Reis 2017)”
This “killer comparison” actually shows how ignorant
mainstream economists are of the modern complex systems
techniques that have made meteorology so much more accurate
than it was fifty years ago.
Meteorologists would justifiably laugh at Reis’s comparison—
and would know instantly that he knew nothing about complex
systems modeling. It is an ignorance he shares with the
mainstream of the economics profession.
Let the revolution begin.
Jobless Claims Jumped Last Week
Initial claims, a proxy for layoffs across the U.S., increased to
253,000, the highest level since Sept. 30
By
Harriet Torry and
Sarah Chaney
Jan. 31, 2019 8:33 a.m. ET
WASHINGTON—The number of Americans filing applications
for new unemployment benefits rose sharply last week, although
claims filed by federal employees ticked down during the fourth
week of a monthlong partial government shutdown.
Initial jobless claims, a proxy for layoffs across the U.S.,
increased by 53,000 to a seasonally adjusted 253,000 in the
week ended Jan. 26, the Labor Department said Thursday. That
was the highest level for initial claims since Sept. 30, 2017.
Economists surveyed by The Wall Street Journal expected
215,000 new claims last week. Claims for the previous week
were revised to 200,000. That still marked the lowest level
since 1969, despite the upward revision.
The jump in claims could be due to several factors, including a
shorter workweek due to the Martin Luther King public holiday.
The headline jobless claims number doesn’t include federal
employees, who file for unemployment benefits under a
different system, although the number would include contractors
potentially impacted by the federal government shutdown.
The four-week moving average of claims, a steadier measure,
rose last week by 5,000 to 220,250.
Thursday’s report showed the number of claims workers made
for longer than a week increased by 69,000 to 1,782,000 in the
week ended Jan. 19. The figure, also known as continuing
claims, is reported with a one-week lag.
The report also shed further light on how some federal
employees responded to the partial government shutdown,
which ended on Jan. 25.
Federal employees file under a separate program than regular
state programs. Federal claims are reported with a one-week
lag.
For the week ended Jan. 19, the fourth week of the partial
government shutdown, 14,739 federal employees filed for first-
time benefits. That was down from 25,419 in the prior week.
Claims by federal workers aren’t adjusted for seasonality.
More broadly, the U.S. labor market is tight, leaving businesses
reluctant to let workers go. The unemployment rate was 3.9% in
December, and nonfarm payrolls rose a seasonally adjusted
312,000, the Labor Department said in early January. That
compared with the average gain of 215,000 a month over the
previous five years.
Economists surveyed by The Wall Street Journal expect the
unemployment rate in January held steady at 3.9%, and
employers added 170,000 new jobs. The Labor Department will
release the jobs report for January on Friday.Economy Notches
100th Straight Month of Increased Employment
Nonfarm payrolls rose a seasonally adjusted 304,000 in January
By
Eric Morath
Updated Feb. 1, 2019 10:12 a.m. ET
WASHINGTON—Tested in January by a 35-day government
shutdown, market volatility and uncertainty about global
growth, the U.S. labor market passed with high marks, notching
its 100th straight month of increased employment and sustaining
robust wage growth.
Nonfarm payrolls increased a seasonally adjusted 304,000 in
January, the Labor Department said Friday. The gain was well
above last year’s average monthly job growth—showing most
private-sector businesses shrugged off the shutdown and kept on
hiring. Meanwhile, wages rose at better than a 3% rate from a
year earlier for the sixth straight month, revised figures showed,
extending the best pay improvements since the recession ended
in 2009.
The unemployment rate rose to 4.0% last month from 3.9% in
December. The Labor Department said the shutdown caused
thousands of federal workers to be counted as on temporary
layoff, contributing to the uptick. The rate has edged up the past
two months since touching a 49-year low of 3.7% last fall.
Economists surveyed by The Wall Street Journal had expected
170,000 new jobs in January and a 3.9% unemployment rate.
Century MarkJob growth continued in January, with nonfarm
payrolls adding the most jobs in a month since last February.
“Payrolls crushed expectations,” Omair Sharif, economist at
Société Générale, wrote in a note to clients. “Not bad for an
economy that is supposedly softening.”
Revised figures show employers added 222,000 jobs in
December and 196,000 jobs in November, a net downward
revision of 70,000.
While more than 300,000 federal workers were furloughed,
meaning not reporting to work during much of January, they
didn’t impact the count in the payroll survey because they
received back pay. Federal employment increased by 1,000
during the month.
But since those workers didn’t report to work at all during the
survey week, the week that includes the 12th of the month,
many were counted as unemployed due to temporary layoff, in a
separate survey of households that determines the
unemployment rate. That caused the jobless rate to rise to the
highest level since June 2018.
Federal workers who worked without receiving their paychecks
as scheduled were counted as employed in both surveys.
Outside of the government, private-sector payrolls rose by
296,000. That is well above average gain in recent years,
suggesting businesses largely shrugged off any impact from the
35-day shutdown ended Jan. 25. The Labor Department
remained open because it was among the agencies funded by
Congress earlier in 2018.
Hiring last month increased in nearly every major category. The
leisure and hospitality sector, including restaurants, added
74,000 employees. Construction firms hired 52,000. The
manufacturing, health-care and retail sectors also added jobs.
Employment declined slightly in the information sector. Local
and state governments added 7,000 jobs.
The labor market has been a pillar of stability during the
economic expansion, with employers adding jobs every month
since October 2010. The streak is more than twice as long as the
next longest such stretch on record, the 48 months concluding in
June 1990.
During much of those 100 months wage growth was weak, but
gains improved in the second half of last year. In January,
average hourly earnings for all private-sector workers increased
3 cents to $27.56 an hour. Hourly wages rose by 10 cents in
December. The average workweek in January was unchanged at
34.5 hours.
The labor market’s relative strength stands in contrast to signs
the economy may be cooling.
The Federal Reserve indicated Wednesday that it was done
raising interest rates for now, after lifting its benchmark rate
four times last year.
Fed Chairman Jerome Powell, in a news conference
Wednesday, raised concerns about slowing growth in major
foreign economies, particularly China and Europe, and about the
elevated uncertainty due to Brexit, ongoing trade negotiations
and the effects from the government shutdown.
“Like many forecasters, we still see sustained expansion of
economic activity, strong labor-market conditions, and inflation
near 2% as the likeliest case,” he said. “But the crosscurrents I
mentioned suggest the risk of a less-favorable outlook.”
Some major U.S. companies,
including Apple Inc. and Caterpillar Inc., recently reported
disappointing profits. But other firms,
including Facebook Inc. and Amazon.com Inc.,posted record
profits. Those gains alongside strong results from banks and
smaller companies helped propel the best January gain for
stocks in 30 years.
Friday’s jobs report included benchmark revisions, which
incorporate payroll data from tax records. The total nonfarm
employment level for March 2018, the benchmark month, was
revised down by 1,000 to 148.28 million. But for all of last
year, employers added 2.674 million jobs, and upward revision
from 2.638 million. Monthly seasonally adjusted data was
revised back to January 2014.
The report also showed a broader measure of unemployment,
including those too discouraged to look for work, plus
Americans stuck in part-time jobs but who want to work full-
time, rose to 8.1% in January from 7.6% the prior month. The
rate, known as the U-6, was the highest since February 2018.
The rate remains elevated compared with last time the headline
unemployment rate stayed near 4%, suggesting there may still
be some slack in corners of the labor market.
While unemployment is near a historic low, the labor-force
participation rate is still only modestly above multidecade lows
touched in 2015. Friday’s report showed the share of American
adults working or looking for work rose to 63.2%, up a half
percentage point from a year earlier.
With just a small share of Americans out of work but seeking
jobs, and the labor force growing only slowly, some employers
have had difficulty filling job openings. Separate Labor
Department data show the number of job openings exceeds the
number of unemployed Americans. Prior to last year, that had
not occurred in nearly two decades of records.

More Related Content

Similar to Economic growth is slowing downGlobalization contributes many.docx

Return of the Recession
Return of the RecessionReturn of the Recession
Return of the RecessionCharu Rastogi
 
Ricky sobrevinas
Ricky sobrevinasRicky sobrevinas
Ricky sobrevinasEduardo Roa
 
Issues in retail
Issues in retailIssues in retail
Issues in retailpinakamaano
 
Current Thinking, Q1 2015
Current Thinking, Q1 2015Current Thinking, Q1 2015
Current Thinking, Q1 2015Kevin Lenox
 
Third Quarter 2015 Economic Report (Oct 2015)
Third Quarter 2015 Economic Report (Oct 2015) Third Quarter 2015 Economic Report (Oct 2015)
Third Quarter 2015 Economic Report (Oct 2015) Marketing Durban Chamber
 
Financial Analysis HINDALCO 2009
Financial Analysis HINDALCO 2009Financial Analysis HINDALCO 2009
Financial Analysis HINDALCO 2009Govind Kumar Rai
 
Baltic Outlook January 2009
Baltic Outlook January 2009Baltic Outlook January 2009
Baltic Outlook January 2009Swedbank
 
State of the Construction and Surety Industry Report (2010)
State of the Construction and Surety Industry Report (2010)State of the Construction and Surety Industry Report (2010)
State of the Construction and Surety Industry Report (2010)Lisa Dehner
 
State of the Construction Industry Report (2010)
State of the Construction Industry Report (2010)State of the Construction Industry Report (2010)
State of the Construction Industry Report (2010)The Vertex Companies, LLC
 
The Baltic Outlook: Update, July 2009
The Baltic Outlook: Update, July 2009The Baltic Outlook: Update, July 2009
The Baltic Outlook: Update, July 2009Swedbank
 

Similar to Economic growth is slowing downGlobalization contributes many.docx (14)

2015 Year End Outlook
2015 Year End Outlook2015 Year End Outlook
2015 Year End Outlook
 
q32015update
q32015updateq32015update
q32015update
 
Return of the Recession
Return of the RecessionReturn of the Recession
Return of the Recession
 
Ricky sobrevinas
Ricky sobrevinasRicky sobrevinas
Ricky sobrevinas
 
Issues in retail
Issues in retailIssues in retail
Issues in retail
 
Current Thinking, Q1 2015
Current Thinking, Q1 2015Current Thinking, Q1 2015
Current Thinking, Q1 2015
 
Third Quarter 2015 Economic Report (Oct 2015)
Third Quarter 2015 Economic Report (Oct 2015) Third Quarter 2015 Economic Report (Oct 2015)
Third Quarter 2015 Economic Report (Oct 2015)
 
xTAP QuarterlyLetter 201609
xTAP QuarterlyLetter 201609xTAP QuarterlyLetter 201609
xTAP QuarterlyLetter 201609
 
Financial Analysis HINDALCO 2009
Financial Analysis HINDALCO 2009Financial Analysis HINDALCO 2009
Financial Analysis HINDALCO 2009
 
The economy
The economyThe economy
The economy
 
Baltic Outlook January 2009
Baltic Outlook January 2009Baltic Outlook January 2009
Baltic Outlook January 2009
 
State of the Construction and Surety Industry Report (2010)
State of the Construction and Surety Industry Report (2010)State of the Construction and Surety Industry Report (2010)
State of the Construction and Surety Industry Report (2010)
 
State of the Construction Industry Report (2010)
State of the Construction Industry Report (2010)State of the Construction Industry Report (2010)
State of the Construction Industry Report (2010)
 
The Baltic Outlook: Update, July 2009
The Baltic Outlook: Update, July 2009The Baltic Outlook: Update, July 2009
The Baltic Outlook: Update, July 2009
 

More from tidwellveronique

EDUC 742EDUC 742Reading Summary and Reflective Comments .docx
EDUC 742EDUC 742Reading Summary and Reflective Comments .docxEDUC 742EDUC 742Reading Summary and Reflective Comments .docx
EDUC 742EDUC 742Reading Summary and Reflective Comments .docxtidwellveronique
 
EDUC 380 Blog Post Samples Module 1 The Brain Below .docx
EDUC 380 Blog Post Samples Module 1 The Brain  Below .docxEDUC 380 Blog Post Samples Module 1 The Brain  Below .docx
EDUC 380 Blog Post Samples Module 1 The Brain Below .docxtidwellveronique
 
EDUC 741Course Project Part 1 Grading RubricCriteriaLevels .docx
EDUC 741Course Project Part 1 Grading RubricCriteriaLevels .docxEDUC 741Course Project Part 1 Grading RubricCriteriaLevels .docx
EDUC 741Course Project Part 1 Grading RubricCriteriaLevels .docxtidwellveronique
 
EDUC 740Prayer Reflection Report Grading RubricCriteriaLev.docx
EDUC 740Prayer Reflection Report Grading RubricCriteriaLev.docxEDUC 740Prayer Reflection Report Grading RubricCriteriaLev.docx
EDUC 740Prayer Reflection Report Grading RubricCriteriaLev.docxtidwellveronique
 
EDUC 6733 Action Research for EducatorsReading LiteracyDraft.docx
EDUC 6733 Action Research for EducatorsReading LiteracyDraft.docxEDUC 6733 Action Research for EducatorsReading LiteracyDraft.docx
EDUC 6733 Action Research for EducatorsReading LiteracyDraft.docxtidwellveronique
 
EDUC 637Technology Portfolio InstructionsGeneral OverviewF.docx
EDUC 637Technology Portfolio InstructionsGeneral OverviewF.docxEDUC 637Technology Portfolio InstructionsGeneral OverviewF.docx
EDUC 637Technology Portfolio InstructionsGeneral OverviewF.docxtidwellveronique
 
EDUC 364 The Role of Cultural Diversity in Schooling A dialecti.docx
EDUC 364 The Role of Cultural Diversity in Schooling A dialecti.docxEDUC 364 The Role of Cultural Diversity in Schooling A dialecti.docx
EDUC 364 The Role of Cultural Diversity in Schooling A dialecti.docxtidwellveronique
 
EDUC 144 Writing Tips The writing assignments in this cla.docx
EDUC 144 Writing Tips  The writing assignments in this cla.docxEDUC 144 Writing Tips  The writing assignments in this cla.docx
EDUC 144 Writing Tips The writing assignments in this cla.docxtidwellveronique
 
EDUC 1300- LEARNING FRAMEWORK Portfolio Page Prompts .docx
EDUC 1300- LEARNING FRAMEWORK Portfolio Page Prompts .docxEDUC 1300- LEARNING FRAMEWORK Portfolio Page Prompts .docx
EDUC 1300- LEARNING FRAMEWORK Portfolio Page Prompts .docxtidwellveronique
 
EDU734 Teaching and Learning Environment Week 5.docx
EDU734 Teaching and  Learning Environment Week 5.docxEDU734 Teaching and  Learning Environment Week 5.docx
EDU734 Teaching and Learning Environment Week 5.docxtidwellveronique
 
EDU 505 – Contemporary Issues in EducationCOURSE DESCRIPTION.docx
EDU 505 – Contemporary Issues in EducationCOURSE DESCRIPTION.docxEDU 505 – Contemporary Issues in EducationCOURSE DESCRIPTION.docx
EDU 505 – Contemporary Issues in EducationCOURSE DESCRIPTION.docxtidwellveronique
 
EDU 3338 Lesson Plan TemplateCandidate NameCooperatin.docx
EDU 3338 Lesson Plan TemplateCandidate NameCooperatin.docxEDU 3338 Lesson Plan TemplateCandidate NameCooperatin.docx
EDU 3338 Lesson Plan TemplateCandidate NameCooperatin.docxtidwellveronique
 
EDU 3215 Lesson Plan Template & Elements Name Andres Rod.docx
EDU 3215 Lesson Plan Template & Elements  Name Andres Rod.docxEDU 3215 Lesson Plan Template & Elements  Name Andres Rod.docx
EDU 3215 Lesson Plan Template & Elements Name Andres Rod.docxtidwellveronique
 
EDST 1100R SITUATED LEARNING EDST 1100 N Situated Learning .docx
EDST 1100R SITUATED LEARNING  EDST 1100 N Situated Learning .docxEDST 1100R SITUATED LEARNING  EDST 1100 N Situated Learning .docx
EDST 1100R SITUATED LEARNING EDST 1100 N Situated Learning .docxtidwellveronique
 
EDU 151 Thematic Unit Required ComponentsThematic Unit Requireme.docx
EDU 151 Thematic Unit Required ComponentsThematic Unit Requireme.docxEDU 151 Thematic Unit Required ComponentsThematic Unit Requireme.docx
EDU 151 Thematic Unit Required ComponentsThematic Unit Requireme.docxtidwellveronique
 
EDSP 429Differentiated Instruction PowerPoint InstructionsThe .docx
EDSP 429Differentiated Instruction PowerPoint InstructionsThe .docxEDSP 429Differentiated Instruction PowerPoint InstructionsThe .docx
EDSP 429Differentiated Instruction PowerPoint InstructionsThe .docxtidwellveronique
 
EDSP 429Fact Sheet on Disability Categories InstructionsThe pu.docx
EDSP 429Fact Sheet on Disability Categories InstructionsThe pu.docxEDSP 429Fact Sheet on Disability Categories InstructionsThe pu.docx
EDSP 429Fact Sheet on Disability Categories InstructionsThe pu.docxtidwellveronique
 
EDSP 370Individualized Education Plan (IEP) InstructionsThe .docx
EDSP 370Individualized Education Plan (IEP) InstructionsThe .docxEDSP 370Individualized Education Plan (IEP) InstructionsThe .docx
EDSP 370Individualized Education Plan (IEP) InstructionsThe .docxtidwellveronique
 
EDSP 377Scenario InstructionsScenario 2 Teaching communicatio.docx
EDSP 377Scenario InstructionsScenario 2 Teaching communicatio.docxEDSP 377Scenario InstructionsScenario 2 Teaching communicatio.docx
EDSP 377Scenario InstructionsScenario 2 Teaching communicatio.docxtidwellveronique
 
EDSP 377Autism Interventions1. Applied Behavior Analysis (ABA).docx
EDSP 377Autism Interventions1. Applied Behavior Analysis (ABA).docxEDSP 377Autism Interventions1. Applied Behavior Analysis (ABA).docx
EDSP 377Autism Interventions1. Applied Behavior Analysis (ABA).docxtidwellveronique
 

More from tidwellveronique (20)

EDUC 742EDUC 742Reading Summary and Reflective Comments .docx
EDUC 742EDUC 742Reading Summary and Reflective Comments .docxEDUC 742EDUC 742Reading Summary and Reflective Comments .docx
EDUC 742EDUC 742Reading Summary and Reflective Comments .docx
 
EDUC 380 Blog Post Samples Module 1 The Brain Below .docx
EDUC 380 Blog Post Samples Module 1 The Brain  Below .docxEDUC 380 Blog Post Samples Module 1 The Brain  Below .docx
EDUC 380 Blog Post Samples Module 1 The Brain Below .docx
 
EDUC 741Course Project Part 1 Grading RubricCriteriaLevels .docx
EDUC 741Course Project Part 1 Grading RubricCriteriaLevels .docxEDUC 741Course Project Part 1 Grading RubricCriteriaLevels .docx
EDUC 741Course Project Part 1 Grading RubricCriteriaLevels .docx
 
EDUC 740Prayer Reflection Report Grading RubricCriteriaLev.docx
EDUC 740Prayer Reflection Report Grading RubricCriteriaLev.docxEDUC 740Prayer Reflection Report Grading RubricCriteriaLev.docx
EDUC 740Prayer Reflection Report Grading RubricCriteriaLev.docx
 
EDUC 6733 Action Research for EducatorsReading LiteracyDraft.docx
EDUC 6733 Action Research for EducatorsReading LiteracyDraft.docxEDUC 6733 Action Research for EducatorsReading LiteracyDraft.docx
EDUC 6733 Action Research for EducatorsReading LiteracyDraft.docx
 
EDUC 637Technology Portfolio InstructionsGeneral OverviewF.docx
EDUC 637Technology Portfolio InstructionsGeneral OverviewF.docxEDUC 637Technology Portfolio InstructionsGeneral OverviewF.docx
EDUC 637Technology Portfolio InstructionsGeneral OverviewF.docx
 
EDUC 364 The Role of Cultural Diversity in Schooling A dialecti.docx
EDUC 364 The Role of Cultural Diversity in Schooling A dialecti.docxEDUC 364 The Role of Cultural Diversity in Schooling A dialecti.docx
EDUC 364 The Role of Cultural Diversity in Schooling A dialecti.docx
 
EDUC 144 Writing Tips The writing assignments in this cla.docx
EDUC 144 Writing Tips  The writing assignments in this cla.docxEDUC 144 Writing Tips  The writing assignments in this cla.docx
EDUC 144 Writing Tips The writing assignments in this cla.docx
 
EDUC 1300- LEARNING FRAMEWORK Portfolio Page Prompts .docx
EDUC 1300- LEARNING FRAMEWORK Portfolio Page Prompts .docxEDUC 1300- LEARNING FRAMEWORK Portfolio Page Prompts .docx
EDUC 1300- LEARNING FRAMEWORK Portfolio Page Prompts .docx
 
EDU734 Teaching and Learning Environment Week 5.docx
EDU734 Teaching and  Learning Environment Week 5.docxEDU734 Teaching and  Learning Environment Week 5.docx
EDU734 Teaching and Learning Environment Week 5.docx
 
EDU 505 – Contemporary Issues in EducationCOURSE DESCRIPTION.docx
EDU 505 – Contemporary Issues in EducationCOURSE DESCRIPTION.docxEDU 505 – Contemporary Issues in EducationCOURSE DESCRIPTION.docx
EDU 505 – Contemporary Issues in EducationCOURSE DESCRIPTION.docx
 
EDU 3338 Lesson Plan TemplateCandidate NameCooperatin.docx
EDU 3338 Lesson Plan TemplateCandidate NameCooperatin.docxEDU 3338 Lesson Plan TemplateCandidate NameCooperatin.docx
EDU 3338 Lesson Plan TemplateCandidate NameCooperatin.docx
 
EDU 3215 Lesson Plan Template & Elements Name Andres Rod.docx
EDU 3215 Lesson Plan Template & Elements  Name Andres Rod.docxEDU 3215 Lesson Plan Template & Elements  Name Andres Rod.docx
EDU 3215 Lesson Plan Template & Elements Name Andres Rod.docx
 
EDST 1100R SITUATED LEARNING EDST 1100 N Situated Learning .docx
EDST 1100R SITUATED LEARNING  EDST 1100 N Situated Learning .docxEDST 1100R SITUATED LEARNING  EDST 1100 N Situated Learning .docx
EDST 1100R SITUATED LEARNING EDST 1100 N Situated Learning .docx
 
EDU 151 Thematic Unit Required ComponentsThematic Unit Requireme.docx
EDU 151 Thematic Unit Required ComponentsThematic Unit Requireme.docxEDU 151 Thematic Unit Required ComponentsThematic Unit Requireme.docx
EDU 151 Thematic Unit Required ComponentsThematic Unit Requireme.docx
 
EDSP 429Differentiated Instruction PowerPoint InstructionsThe .docx
EDSP 429Differentiated Instruction PowerPoint InstructionsThe .docxEDSP 429Differentiated Instruction PowerPoint InstructionsThe .docx
EDSP 429Differentiated Instruction PowerPoint InstructionsThe .docx
 
EDSP 429Fact Sheet on Disability Categories InstructionsThe pu.docx
EDSP 429Fact Sheet on Disability Categories InstructionsThe pu.docxEDSP 429Fact Sheet on Disability Categories InstructionsThe pu.docx
EDSP 429Fact Sheet on Disability Categories InstructionsThe pu.docx
 
EDSP 370Individualized Education Plan (IEP) InstructionsThe .docx
EDSP 370Individualized Education Plan (IEP) InstructionsThe .docxEDSP 370Individualized Education Plan (IEP) InstructionsThe .docx
EDSP 370Individualized Education Plan (IEP) InstructionsThe .docx
 
EDSP 377Scenario InstructionsScenario 2 Teaching communicatio.docx
EDSP 377Scenario InstructionsScenario 2 Teaching communicatio.docxEDSP 377Scenario InstructionsScenario 2 Teaching communicatio.docx
EDSP 377Scenario InstructionsScenario 2 Teaching communicatio.docx
 
EDSP 377Autism Interventions1. Applied Behavior Analysis (ABA).docx
EDSP 377Autism Interventions1. Applied Behavior Analysis (ABA).docxEDSP 377Autism Interventions1. Applied Behavior Analysis (ABA).docx
EDSP 377Autism Interventions1. Applied Behavior Analysis (ABA).docx
 

Recently uploaded

Food safety_Challenges food safety laboratories_.pdf
Food safety_Challenges food safety laboratories_.pdfFood safety_Challenges food safety laboratories_.pdf
Food safety_Challenges food safety laboratories_.pdfSherif Taha
 
Holdier Curriculum Vitae (April 2024).pdf
Holdier Curriculum Vitae (April 2024).pdfHoldier Curriculum Vitae (April 2024).pdf
Holdier Curriculum Vitae (April 2024).pdfagholdier
 
TỔNG ÔN TẬP THI VÀO LỚP 10 MÔN TIẾNG ANH NĂM HỌC 2023 - 2024 CÓ ĐÁP ÁN (NGỮ Â...
TỔNG ÔN TẬP THI VÀO LỚP 10 MÔN TIẾNG ANH NĂM HỌC 2023 - 2024 CÓ ĐÁP ÁN (NGỮ Â...TỔNG ÔN TẬP THI VÀO LỚP 10 MÔN TIẾNG ANH NĂM HỌC 2023 - 2024 CÓ ĐÁP ÁN (NGỮ Â...
TỔNG ÔN TẬP THI VÀO LỚP 10 MÔN TIẾNG ANH NĂM HỌC 2023 - 2024 CÓ ĐÁP ÁN (NGỮ Â...Nguyen Thanh Tu Collection
 
Unit-IV- Pharma. Marketing Channels.pptx
Unit-IV- Pharma. Marketing Channels.pptxUnit-IV- Pharma. Marketing Channels.pptx
Unit-IV- Pharma. Marketing Channels.pptxVishalSingh1417
 
Basic Civil Engineering first year Notes- Chapter 4 Building.pptx
Basic Civil Engineering first year Notes- Chapter 4 Building.pptxBasic Civil Engineering first year Notes- Chapter 4 Building.pptx
Basic Civil Engineering first year Notes- Chapter 4 Building.pptxDenish Jangid
 
How to Manage Global Discount in Odoo 17 POS
How to Manage Global Discount in Odoo 17 POSHow to Manage Global Discount in Odoo 17 POS
How to Manage Global Discount in Odoo 17 POSCeline George
 
ICT Role in 21st Century Education & its Challenges.pptx
ICT Role in 21st Century Education & its Challenges.pptxICT Role in 21st Century Education & its Challenges.pptx
ICT Role in 21st Century Education & its Challenges.pptxAreebaZafar22
 
Jual Obat Aborsi Hongkong ( Asli No.1 ) 085657271886 Obat Penggugur Kandungan...
Jual Obat Aborsi Hongkong ( Asli No.1 ) 085657271886 Obat Penggugur Kandungan...Jual Obat Aborsi Hongkong ( Asli No.1 ) 085657271886 Obat Penggugur Kandungan...
Jual Obat Aborsi Hongkong ( Asli No.1 ) 085657271886 Obat Penggugur Kandungan...ZurliaSoop
 
Third Battle of Panipat detailed notes.pptx
Third Battle of Panipat detailed notes.pptxThird Battle of Panipat detailed notes.pptx
Third Battle of Panipat detailed notes.pptxAmita Gupta
 
Python Notes for mca i year students osmania university.docx
Python Notes for mca i year students osmania university.docxPython Notes for mca i year students osmania university.docx
Python Notes for mca i year students osmania university.docxRamakrishna Reddy Bijjam
 
The basics of sentences session 3pptx.pptx
The basics of sentences session 3pptx.pptxThe basics of sentences session 3pptx.pptx
The basics of sentences session 3pptx.pptxheathfieldcps1
 
Making communications land - Are they received and understood as intended? we...
Making communications land - Are they received and understood as intended? we...Making communications land - Are they received and understood as intended? we...
Making communications land - Are they received and understood as intended? we...Association for Project Management
 
This PowerPoint helps students to consider the concept of infinity.
This PowerPoint helps students to consider the concept of infinity.This PowerPoint helps students to consider the concept of infinity.
This PowerPoint helps students to consider the concept of infinity.christianmathematics
 
Russian Escort Service in Delhi 11k Hotel Foreigner Russian Call Girls in Delhi
Russian Escort Service in Delhi 11k Hotel Foreigner Russian Call Girls in DelhiRussian Escort Service in Delhi 11k Hotel Foreigner Russian Call Girls in Delhi
Russian Escort Service in Delhi 11k Hotel Foreigner Russian Call Girls in Delhikauryashika82
 
Seal of Good Local Governance (SGLG) 2024Final.pptx
Seal of Good Local Governance (SGLG) 2024Final.pptxSeal of Good Local Governance (SGLG) 2024Final.pptx
Seal of Good Local Governance (SGLG) 2024Final.pptxnegromaestrong
 
Spellings Wk 3 English CAPS CARES Please Practise
Spellings Wk 3 English CAPS CARES Please PractiseSpellings Wk 3 English CAPS CARES Please Practise
Spellings Wk 3 English CAPS CARES Please PractiseAnaAcapella
 
General Principles of Intellectual Property: Concepts of Intellectual Proper...
General Principles of Intellectual Property: Concepts of Intellectual  Proper...General Principles of Intellectual Property: Concepts of Intellectual  Proper...
General Principles of Intellectual Property: Concepts of Intellectual Proper...Poonam Aher Patil
 
Mixin Classes in Odoo 17 How to Extend Models Using Mixin Classes
Mixin Classes in Odoo 17  How to Extend Models Using Mixin ClassesMixin Classes in Odoo 17  How to Extend Models Using Mixin Classes
Mixin Classes in Odoo 17 How to Extend Models Using Mixin ClassesCeline George
 
ComPTIA Overview | Comptia Security+ Book SY0-701
ComPTIA Overview | Comptia Security+ Book SY0-701ComPTIA Overview | Comptia Security+ Book SY0-701
ComPTIA Overview | Comptia Security+ Book SY0-701bronxfugly43
 

Recently uploaded (20)

Food safety_Challenges food safety laboratories_.pdf
Food safety_Challenges food safety laboratories_.pdfFood safety_Challenges food safety laboratories_.pdf
Food safety_Challenges food safety laboratories_.pdf
 
Holdier Curriculum Vitae (April 2024).pdf
Holdier Curriculum Vitae (April 2024).pdfHoldier Curriculum Vitae (April 2024).pdf
Holdier Curriculum Vitae (April 2024).pdf
 
TỔNG ÔN TẬP THI VÀO LỚP 10 MÔN TIẾNG ANH NĂM HỌC 2023 - 2024 CÓ ĐÁP ÁN (NGỮ Â...
TỔNG ÔN TẬP THI VÀO LỚP 10 MÔN TIẾNG ANH NĂM HỌC 2023 - 2024 CÓ ĐÁP ÁN (NGỮ Â...TỔNG ÔN TẬP THI VÀO LỚP 10 MÔN TIẾNG ANH NĂM HỌC 2023 - 2024 CÓ ĐÁP ÁN (NGỮ Â...
TỔNG ÔN TẬP THI VÀO LỚP 10 MÔN TIẾNG ANH NĂM HỌC 2023 - 2024 CÓ ĐÁP ÁN (NGỮ Â...
 
Unit-IV- Pharma. Marketing Channels.pptx
Unit-IV- Pharma. Marketing Channels.pptxUnit-IV- Pharma. Marketing Channels.pptx
Unit-IV- Pharma. Marketing Channels.pptx
 
Basic Civil Engineering first year Notes- Chapter 4 Building.pptx
Basic Civil Engineering first year Notes- Chapter 4 Building.pptxBasic Civil Engineering first year Notes- Chapter 4 Building.pptx
Basic Civil Engineering first year Notes- Chapter 4 Building.pptx
 
How to Manage Global Discount in Odoo 17 POS
How to Manage Global Discount in Odoo 17 POSHow to Manage Global Discount in Odoo 17 POS
How to Manage Global Discount in Odoo 17 POS
 
ICT Role in 21st Century Education & its Challenges.pptx
ICT Role in 21st Century Education & its Challenges.pptxICT Role in 21st Century Education & its Challenges.pptx
ICT Role in 21st Century Education & its Challenges.pptx
 
Jual Obat Aborsi Hongkong ( Asli No.1 ) 085657271886 Obat Penggugur Kandungan...
Jual Obat Aborsi Hongkong ( Asli No.1 ) 085657271886 Obat Penggugur Kandungan...Jual Obat Aborsi Hongkong ( Asli No.1 ) 085657271886 Obat Penggugur Kandungan...
Jual Obat Aborsi Hongkong ( Asli No.1 ) 085657271886 Obat Penggugur Kandungan...
 
Third Battle of Panipat detailed notes.pptx
Third Battle of Panipat detailed notes.pptxThird Battle of Panipat detailed notes.pptx
Third Battle of Panipat detailed notes.pptx
 
Python Notes for mca i year students osmania university.docx
Python Notes for mca i year students osmania university.docxPython Notes for mca i year students osmania university.docx
Python Notes for mca i year students osmania university.docx
 
The basics of sentences session 3pptx.pptx
The basics of sentences session 3pptx.pptxThe basics of sentences session 3pptx.pptx
The basics of sentences session 3pptx.pptx
 
Making communications land - Are they received and understood as intended? we...
Making communications land - Are they received and understood as intended? we...Making communications land - Are they received and understood as intended? we...
Making communications land - Are they received and understood as intended? we...
 
This PowerPoint helps students to consider the concept of infinity.
This PowerPoint helps students to consider the concept of infinity.This PowerPoint helps students to consider the concept of infinity.
This PowerPoint helps students to consider the concept of infinity.
 
Russian Escort Service in Delhi 11k Hotel Foreigner Russian Call Girls in Delhi
Russian Escort Service in Delhi 11k Hotel Foreigner Russian Call Girls in DelhiRussian Escort Service in Delhi 11k Hotel Foreigner Russian Call Girls in Delhi
Russian Escort Service in Delhi 11k Hotel Foreigner Russian Call Girls in Delhi
 
Seal of Good Local Governance (SGLG) 2024Final.pptx
Seal of Good Local Governance (SGLG) 2024Final.pptxSeal of Good Local Governance (SGLG) 2024Final.pptx
Seal of Good Local Governance (SGLG) 2024Final.pptx
 
Spatium Project Simulation student brief
Spatium Project Simulation student briefSpatium Project Simulation student brief
Spatium Project Simulation student brief
 
Spellings Wk 3 English CAPS CARES Please Practise
Spellings Wk 3 English CAPS CARES Please PractiseSpellings Wk 3 English CAPS CARES Please Practise
Spellings Wk 3 English CAPS CARES Please Practise
 
General Principles of Intellectual Property: Concepts of Intellectual Proper...
General Principles of Intellectual Property: Concepts of Intellectual  Proper...General Principles of Intellectual Property: Concepts of Intellectual  Proper...
General Principles of Intellectual Property: Concepts of Intellectual Proper...
 
Mixin Classes in Odoo 17 How to Extend Models Using Mixin Classes
Mixin Classes in Odoo 17  How to Extend Models Using Mixin ClassesMixin Classes in Odoo 17  How to Extend Models Using Mixin Classes
Mixin Classes in Odoo 17 How to Extend Models Using Mixin Classes
 
ComPTIA Overview | Comptia Security+ Book SY0-701
ComPTIA Overview | Comptia Security+ Book SY0-701ComPTIA Overview | Comptia Security+ Book SY0-701
ComPTIA Overview | Comptia Security+ Book SY0-701
 

Economic growth is slowing downGlobalization contributes many.docx

  • 1. Economic growth is slowing down Globalization contributes many advantages to the global economy. The global boom is the result from globalization. Economy had a rapid growth after 1990s. But the globalization also carries some problems to the economic. As a result, the economic growth is slowing down in recent years. In the article The steam has gone out of globalization, the author states that the globalization is leading our economy to a new era called “slowbalisation”. The economy has a robust growth during the golden age of the globalization in 1990-2010. But the economic growth rate become slower in recently years because the benefits from the globalization is almost used up. The cost of shipping has stop falling, multinational firms find a hard time survive in both global markets and the local markets. Meanwhile activity is shifting towards service, which is harder to trade across the borders. Those are the factors cause the slowbalisation. And globalization remains many issues that slow the economy down in the recent years. First, the decline of the total investment in the market caused the economic growth to slow down. Investment is a very significant factor that effect the long-term aggregate supply. If the long-term aggregate supply doesn’t increase, the rise in the aggregate demand will cause inflation but not economic growth. Moreover, the high geopolitical risk makes firms unwilling to put investment in countries and industries that carry high risk. In the article, “global value of cross-border investment by multinational companies sank by about 20% in 2018” (Slowbalisation, page 2 para 3). And the decline in the payoff of from the investment also slow down the economy. Globalization bring the production cost significantly lowered than before. But after the cost of shipping has stop falling and the labor cost can not be reduced, firms can not lower the production cost anymore therefore lower the total payoff from investment. This means a
  • 2. country need to put more money in the investment in order to reach the same economic growth as before, which is not sustainable (Ip). Since the benefits from the globalization become less significant, trade conflict between two countries become more ordinary in recent years that reduce the chance of cooperation in economic and slow down the economic. Country like the United States is now putting more attention to the domestic economic growth rather than the global economic growth. Trade conflict between U.S. and China is the trigger for the latest slowing (Ip). Moreover, the high tariff set by the U.S. government even hurt its small domestic business because of the increasing cost in production (Guo). As a result, trade behavior between countries will become more regional. The divergent monetary policies between America and the rest of the world will hurt the economy in the emerging markets. The Federal Reserve has already raised the interest rate 8 times while the European Central Bank has no plan to rise their interest rate (The world economy, page 1 para 3). And China on the other hand, is having relaxed monetary policy in order to offset the outcome from trade war. The current situation that strength the dollar in the world and makes it harder for emerging markets to repay their debts (The world economy, page 1 para 3). A measurement indicates that emerging markets account for 59% of world’s output. Therefore, a financial crisis in the emerging markets will definitely slowdown the global economy and even lead to a recession. In conclusion, decline in investment, trade conflict and the crisis in the emerging markets are some of the problems carried by the globalization when its benefits the economy less than before. And the global economy is stagnating because of that.
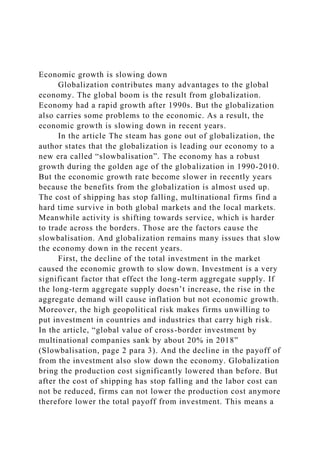
  • 3. measures of global integration From this chart we can see eight measures of GDP are in retreat or stagnating. Works Cited Ip, Greg. “The Global Boom, Barely Begun, May Be Over.” The Wall Street Journal, Dow Jones & Company, 24 Jan. 2019. “The Steam Has Gone out of Globalisation.” The Economist, The Economist Newspaper, 24 Jan. 2019. “The next Recession.” The Economist, The Economist Newspaper, 11 Oct. 2018. “Globalisation Has Faltered.” The Economist, The Economist Newspaper, 24 Jan. 2019. Yuwei Guo. “slowbalisation” Economic Rhetoric: Using Economic Theory and Empirical Evidence in Arguing Policy. UC Santa Cruz. Santa Cruz. 23 January 2019. Lecture.
  • 4. CBO: Shutdown Will Cost Government $3 Billion of Projected 2019 GDP The deficit is expected to total $897 billion in 2019 By Kate Davidson Updated Jan. 28, 2019 10:38 a.m. ET WASHINGTON—The partial government shutdown that ended Friday will cost the government about $3 billion and will subtract about 0.4 percentage point from annualized gross domestic product growth in the first quarter, the nonpartisan Congressional Budget Office said Monday. In new estimates of the shutdown’s impact, the CBO said the shutdown dampened economic activity mainly because of the roughly 380,000 furloughed workers who weren’t contributing to GDP, as well as the delay in federal spending on goods and services and the reduction in aggregate demand. The estimates, which the CBO cautioned are highly uncertain, don’t incorporate other indirect negative effects of the shutdown, such as businesses that couldn’t obtain federal permits or access loans while the government was partially closed. “Such factors were probably beginning to lead firms to postpone investment and hiring decisions,” the CBO said, adding that risks to the economy were becoming increasingly significant as the shutdown continued. “Although their precise effects on economic output are uncertain, the negative effects of such factors would have become increasingly important if the partial shutdown had extended beyond five weeks,” the report said. The CBO estimated the 35-day shutdown, which was the longest in U.S. history, reduced fourth-quarter GDP by $3 billion, or 0.1%. The level of real GDP in the first quarter, which ends March 30, is expected to be $8 billion lower than it would have been, or 0.2% lower.
  • 5. Economic growth is expected to be higher in subsequent quarters this year, as the economy makes up some of the lost ground. But the CBO estimates about $3 billion—or 0.02% of projected annual GDP in 2019—will never be recovered. In estimates prepared before the shutdown, the agency projected the economy would grow 2.3% in 2019. President Trump on Friday reached a deal with congressional leaders to reopen the government for three weeks while Republicans and Democrats negotiate over border security provisions in a new spending bill. Although a shutdown temporarily halts government operations, previous shutdowns have imposed significant direct and indirect costs, including billions of dollars in back pay, lost output by federal workers and weaker economic growth. Two separate shutdowns in fiscal year 1996 cost the government about $1.4 billion over 26 days, the Office of Management and Budget said at the time. The 16-day shutdown in 2013 cost roughly $2 billion in retroactive pay to furloughed employees, plus billions more in lost economic output, according to OMB. Kevin Hassett, the chairman of the White House Council of Economic Advisers, said Wednesday the U.S. economy may not grow at all in the first quarter if the shutdown continued through March. But he added that the economy should recover any lost ground once the government reopens. The CBO also estimated the budget deficit would total $897 billion in 2019, and pushed back its estimate for when budget deficits will exceed $1 trillion to 2022. Last year, the agency saw deficits topping $1 trillion next year, as government outlays continue to outstrip revenue growth. The shift mainly reflected lower projected spending this year on emergencies, such as hurricanes and wildfires, as well as lower projected interest rates, which translates to lower expected interest costs on government debt. The CBO also projected federal deficits would average $1.2 trillion a year over the next decade, or 4.4% as a share of gross domestic product, much higher than the 2.9% average over the
  • 6. past 50 years. Government debt is projected to swell from 78% of GDP in 2018 to 93% at the end of 2029. Guidelines for Article Exploration Assignments: TECHNICAL REQUIREMENTS: · 1-inch margins all around (we will measure, YOU must make sure that your printer is printing correctly, this is not my or the grader’s responsibility, it is yours.) · Please use MLA formatting for your references. · Use a clear, readable, font such as Verdana, Calibri, Tahoma or Arial, etc. Please be consistent and use the same font throughout. · Use black text on a white background. Avoid colored backgrounds or text in a color other than black unless you have special permission to use them (for example, if you're dyslexic). · Use 12-point font for the body of your assignment. · Use double spacing, only one-line space between paragraphs · Left-justify your work (also known as left-aligned). · Use bold for headings. Not underlining or italics. · You must have 50 FULL lines of text at the minimum and 100 FULL lines of text at the maximum. · You must have a(n) Title, Introduction, Thesis Statement, Transitions, Topic Sentences, Body Paragraphs, Conclusion, and References Page(s). · As well as a reference page, parenthetical references are required within the text of the paper. The reference page(s) DO NOT count towards your 50-100 FULL lines of text. · Graphs and Tables are required for the Article Understanding assignments. These (Graphs and Tables) should each have their own page with a title (on the top of the page) and a description of no less than two sentences (below the table or graph). These pages DO NOT count towards your 50-100 FULL lines of text, and should be located after the conclusion and before the references.
  • 7. · All papers should include a header on the front page. This header DOES NOT count toward your 50-100 FULL lines of text. It should include: · Your name · Student ID# · The Course Number SPECIFIC REQUIREMENTS: · You cannot use contractions · UP TO (no more than) one paragraph (10 lines) may summarize the article(s) itself (themselves). · Must have relevant charts/figures/equations. · Must have reference page (4 references) and in text parenthetical references. · Must have policy implications or suggestions in the conclusion of the essay. Your essays should focus on one of the following major topics: Macro: Economic Growth; Unemployment, Inflation; Monetary Policy; or Fiscal Policy. Micro: Demand, Supply, and Equilibrium; Elasticity; Consumer Demand Theory; Theory of Production; Costs of Production; Opportunity Cost; Market Structure; Competition; Game Theory; Labor; Welfare; or Economics of Information.
  • 8. My Thoughts: You are writing about an idea in the article (many are listed above), and you are using the article as a baseline reference point for the overarching idea. What are the policy implications or suggestions of the idea(s) in the article(s)? Your supporting paragraphs should use your technical knowledge of economics in order to support or refute the original claims of the article, or claims made by your own personal opinions. This means that you have to take some time (space: 1 or 2 sentences) to talk about the theoretical economic model involved (labor market, goods market, AD-AS, etc.). 10 years after the Great Financial Crash: Economics needs more than ‘Reformation’ Steve Keen Published time: 28 Dec, 2017 16:15 The only way to avoid future financial crashes is to revolutionize economics because catastrophic turmoil is built into the current system. A year ago, I was looking forward to 2017 as the tenth anniversary of an event that mainstream “neoclassical” economists said couldn’t happen: the global financial crisis which kicked off in 2007. You’d have thought the epoch would have presented a chance to reflect on the past, but it turned out the reflection on that event by the economics profession and the financial press was minimal: it was an event they’d rather forget than commemorate.
  • 9. There was only trivial coverage of the anniversary in the mainstream media. For instance, the UK media could have made a big song and dance of it being ten years since the collapse of Northern Rock since it was the first bank run in Britain for 150 years. But there were only a couple of light articles in the Financial Times (“In charts: UK banking ten years after Northern Rock”; “Ten years after Northern Rock: has UK banking changed?”) a fluff piece by BBC TV—in which I was interviewed, but not understood (“BBC Business Live interview on 10th anniversary of Northern Rock”)—and a smattering of coverage elsewhere. Because learning lessons from history now seems to be so last century! Thus, just as it was only the rebel economists like me who saw the crisis coming, it was only the rebels who indeed commemorated it. One way we did was by latching on to another anniversary in 2017: it was 500 years since Martin Luther triggered the Reformation by nailing his 95 Theses to the door of All Saints Church in Wittenberg. Rather late in the year, some students suggested using this anniversary as a hook to call for a ‘Reformation of Economics.’Future's the past I gladly took part in it, dressing up in a monk’s robe, speaking briefly (along with The Guardian’s Larry Elliott, and the prominent heterodox economists Vicki Chick, Mariana Mazzucato, and Kate Raworth), and then blue-tacking a hastily and committee-drafted 33 Theses to the entrance to the London School of Economics. That event has garnered more critical reaction from mainstream economists than the tenth anniversary of the crisis itself, including Ben Chu’s recent piece in The Independent stating that “The economics profession does not need a ‘reformation’.” I’m going to surprise Ben by agreeing with him. Economics
  • 10. doesn’t need a Reformation: it needs a scientific revolution, similar to that triggered by Copernicus’s publication of “On the Revolutions of the Heavenly Spheres” in 1543. The astronomical orthodoxy when Copernicus published Revolutions was Ptolemy’s model, which put the Earth at the center of the Universe, with the Sun, Moon, planets, and stars rotating about it on perfect spheres called Deferents. However, their observed motion wasn’t perfectly circular, so Ptolemy offset the center of the Universe slightly from Earth itself, and added other elements to explain other anomalies—especially the apparent reversal of the direction of the planets. Here he had the brilliant idea of placing them on other circles (called Epicycles) which rotated on their Deferents so that sometimes they traveled east to west in the sky as seen from Earth, and other times west to east. There was just one problem: this model of the Universe was fundamentally wrong. But this didn’t stop Ptolemaic astronomers because Ptolemy’s basic paradigm of circles on circles was capable of describing any path by any object in space. They spent their time devising and perfecting this paradigm, generating models which could predict the motion of the planets for centuries ahead. Then along came Copernicus, with an initially less accurate (because he still thought that the planets had circular orbits) but fundamentally correct model, which put the Sun, and not the Earth, at the center of the Solar System. This was the first great scientific revolution, and it inverted our understanding of the Universe: rather than the Sun orbiting the Earth, the Earth orbited the Sun; rather than the stars being nearby, they were far away; and gravity, not God, told the “Heavenly Bodies” how to move. The revolution in astronomy that Copernicus triggered with his
  • 11. fundamentally different paradigm took over a century. And Galileo played a key role here, by building the first serious telescope and observing four of Jupiter’s moons—which orbited Jupiter rather than the Earth. Faced with both a far simpler model, and observations that were serious anomalies in Ptolemy’s theory, the old way of thinking gave way to the new.Slow coaches This revolution didn’t come peacefully, and it wasn’t led by the Ptolemaic astronomers themselves, but by new entrants to the field—including, crucially, Isaac Newton, whose equations of motion provided a mathematical explanation for why the orbits of planets were elliptical rather than circular. I hope that the revolution we need in economics takes less than a century, but if it is left to today’s neoclassical economists, it won’t happen at all. That revolution says the economy is not in or even near its equilibrium, but far from equilibrium; that cycles are caused not by exogenous shocks to a stable system, but by the inherent cyclicality of a complex system, where the whole is far more than the sum of its parts; and that money, rather than merely a “veil over barter” which can be ignored in macroeconomic modeling (Oh, you didn’t realize that mainstream economists don’t include banks, debt and money in their models?), is crucial to both the functioning of capitalism and its occasional financial crises, of which 2007 was merely the most recent example. Instead, like Ptolemaic astronomers confronted with the existence of Jupiter’s moons, they’re busy adding “financial frictions” (the equivalent of Epicycles) to their equilibrium models, and disparaging critics in the belief that their framework is the only way one can do macroeconomic modeling.Cross purposes Balderdash. What they are instead illustrating is how little they know about alternative modeling approaches that dominate genuine sciences today.
  • 12. I’m rather glad the students chose to pin their Theses to the door of the London School of Economics, because the most recent example of economists displaying ignorance while thinking they were being wise came from Professor Reis of the LSE, in a paper entitled“Is something really wrong with macroeconomics?” In defending economics against the criticism that it didn’t forecast the 2007 crisis, he argued that this didn’t look so bad when you compared economic forecasting to weather forecasting over the same time horizon: “Comparing macroeconomic forecasts to forecasts of average temperature or precipitation over the next 1-5 years, as opposed to over the next few days, it is far from clear that economic forecasting is doing so poorly. (Reis 2017)” This “killer comparison” actually shows how ignorant mainstream economists are of the modern complex systems techniques that have made meteorology so much more accurate than it was fifty years ago. Meteorologists would justifiably laugh at Reis’s comparison— and would know instantly that he knew nothing about complex systems modeling. It is an ignorance he shares with the mainstream of the economics profession. Let the revolution begin. Jobless Claims Jumped Last Week Initial claims, a proxy for layoffs across the U.S., increased to 253,000, the highest level since Sept. 30 By Harriet Torry and Sarah Chaney Jan. 31, 2019 8:33 a.m. ET WASHINGTON—The number of Americans filing applications for new unemployment benefits rose sharply last week, although claims filed by federal employees ticked down during the fourth
  • 13. week of a monthlong partial government shutdown. Initial jobless claims, a proxy for layoffs across the U.S., increased by 53,000 to a seasonally adjusted 253,000 in the week ended Jan. 26, the Labor Department said Thursday. That was the highest level for initial claims since Sept. 30, 2017. Economists surveyed by The Wall Street Journal expected 215,000 new claims last week. Claims for the previous week were revised to 200,000. That still marked the lowest level since 1969, despite the upward revision. The jump in claims could be due to several factors, including a shorter workweek due to the Martin Luther King public holiday. The headline jobless claims number doesn’t include federal employees, who file for unemployment benefits under a different system, although the number would include contractors potentially impacted by the federal government shutdown. The four-week moving average of claims, a steadier measure, rose last week by 5,000 to 220,250. Thursday’s report showed the number of claims workers made for longer than a week increased by 69,000 to 1,782,000 in the week ended Jan. 19. The figure, also known as continuing claims, is reported with a one-week lag. The report also shed further light on how some federal employees responded to the partial government shutdown, which ended on Jan. 25. Federal employees file under a separate program than regular state programs. Federal claims are reported with a one-week lag. For the week ended Jan. 19, the fourth week of the partial government shutdown, 14,739 federal employees filed for first- time benefits. That was down from 25,419 in the prior week. Claims by federal workers aren’t adjusted for seasonality. More broadly, the U.S. labor market is tight, leaving businesses reluctant to let workers go. The unemployment rate was 3.9% in December, and nonfarm payrolls rose a seasonally adjusted 312,000, the Labor Department said in early January. That
  • 14. compared with the average gain of 215,000 a month over the previous five years. Economists surveyed by The Wall Street Journal expect the unemployment rate in January held steady at 3.9%, and employers added 170,000 new jobs. The Labor Department will release the jobs report for January on Friday.Economy Notches 100th Straight Month of Increased Employment Nonfarm payrolls rose a seasonally adjusted 304,000 in January By Eric Morath Updated Feb. 1, 2019 10:12 a.m. ET WASHINGTON—Tested in January by a 35-day government shutdown, market volatility and uncertainty about global growth, the U.S. labor market passed with high marks, notching its 100th straight month of increased employment and sustaining robust wage growth. Nonfarm payrolls increased a seasonally adjusted 304,000 in January, the Labor Department said Friday. The gain was well above last year’s average monthly job growth—showing most private-sector businesses shrugged off the shutdown and kept on hiring. Meanwhile, wages rose at better than a 3% rate from a year earlier for the sixth straight month, revised figures showed, extending the best pay improvements since the recession ended in 2009. The unemployment rate rose to 4.0% last month from 3.9% in December. The Labor Department said the shutdown caused thousands of federal workers to be counted as on temporary layoff, contributing to the uptick. The rate has edged up the past two months since touching a 49-year low of 3.7% last fall. Economists surveyed by The Wall Street Journal had expected 170,000 new jobs in January and a 3.9% unemployment rate. Century MarkJob growth continued in January, with nonfarm payrolls adding the most jobs in a month since last February.
  • 15. “Payrolls crushed expectations,” Omair Sharif, economist at Société Générale, wrote in a note to clients. “Not bad for an economy that is supposedly softening.” Revised figures show employers added 222,000 jobs in December and 196,000 jobs in November, a net downward revision of 70,000. While more than 300,000 federal workers were furloughed, meaning not reporting to work during much of January, they didn’t impact the count in the payroll survey because they received back pay. Federal employment increased by 1,000 during the month. But since those workers didn’t report to work at all during the survey week, the week that includes the 12th of the month, many were counted as unemployed due to temporary layoff, in a separate survey of households that determines the unemployment rate. That caused the jobless rate to rise to the highest level since June 2018. Federal workers who worked without receiving their paychecks as scheduled were counted as employed in both surveys. Outside of the government, private-sector payrolls rose by 296,000. That is well above average gain in recent years, suggesting businesses largely shrugged off any impact from the 35-day shutdown ended Jan. 25. The Labor Department remained open because it was among the agencies funded by Congress earlier in 2018. Hiring last month increased in nearly every major category. The leisure and hospitality sector, including restaurants, added 74,000 employees. Construction firms hired 52,000. The manufacturing, health-care and retail sectors also added jobs. Employment declined slightly in the information sector. Local and state governments added 7,000 jobs. The labor market has been a pillar of stability during the economic expansion, with employers adding jobs every month since October 2010. The streak is more than twice as long as the next longest such stretch on record, the 48 months concluding in June 1990.
  • 16. During much of those 100 months wage growth was weak, but gains improved in the second half of last year. In January, average hourly earnings for all private-sector workers increased 3 cents to $27.56 an hour. Hourly wages rose by 10 cents in December. The average workweek in January was unchanged at 34.5 hours. The labor market’s relative strength stands in contrast to signs the economy may be cooling. The Federal Reserve indicated Wednesday that it was done raising interest rates for now, after lifting its benchmark rate four times last year. Fed Chairman Jerome Powell, in a news conference Wednesday, raised concerns about slowing growth in major foreign economies, particularly China and Europe, and about the elevated uncertainty due to Brexit, ongoing trade negotiations and the effects from the government shutdown. “Like many forecasters, we still see sustained expansion of economic activity, strong labor-market conditions, and inflation near 2% as the likeliest case,” he said. “But the crosscurrents I mentioned suggest the risk of a less-favorable outlook.” Some major U.S. companies, including Apple Inc. and Caterpillar Inc., recently reported disappointing profits. But other firms, including Facebook Inc. and Amazon.com Inc.,posted record profits. Those gains alongside strong results from banks and smaller companies helped propel the best January gain for stocks in 30 years. Friday’s jobs report included benchmark revisions, which incorporate payroll data from tax records. The total nonfarm employment level for March 2018, the benchmark month, was revised down by 1,000 to 148.28 million. But for all of last year, employers added 2.674 million jobs, and upward revision from 2.638 million. Monthly seasonally adjusted data was revised back to January 2014. The report also showed a broader measure of unemployment,
  • 17. including those too discouraged to look for work, plus Americans stuck in part-time jobs but who want to work full- time, rose to 8.1% in January from 7.6% the prior month. The rate, known as the U-6, was the highest since February 2018. The rate remains elevated compared with last time the headline unemployment rate stayed near 4%, suggesting there may still be some slack in corners of the labor market. While unemployment is near a historic low, the labor-force participation rate is still only modestly above multidecade lows touched in 2015. Friday’s report showed the share of American adults working or looking for work rose to 63.2%, up a half percentage point from a year earlier. With just a small share of Americans out of work but seeking jobs, and the labor force growing only slowly, some employers have had difficulty filling job openings. Separate Labor Department data show the number of job openings exceeds the number of unemployed Americans. Prior to last year, that had not occurred in nearly two decades of records.