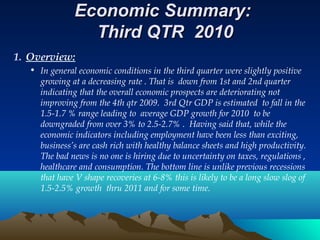
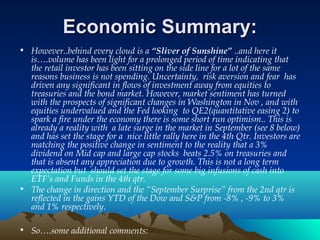
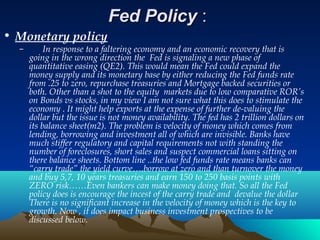
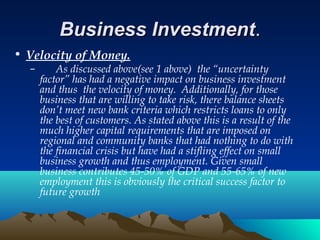
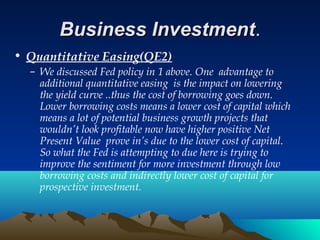
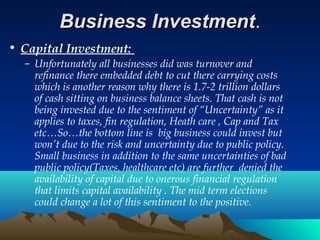
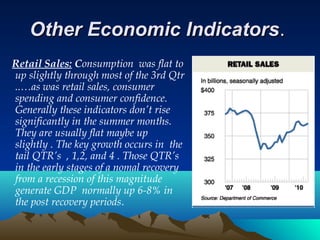
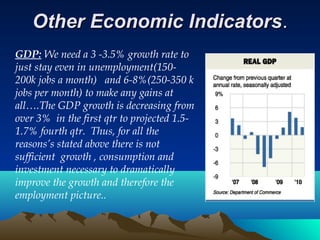
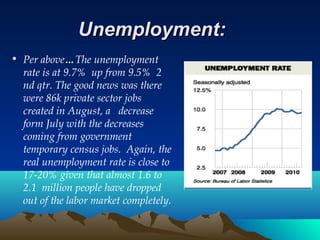
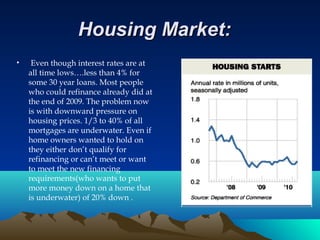
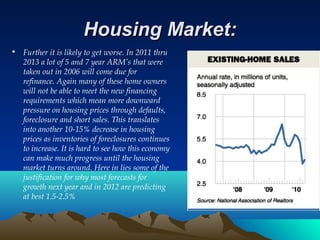
Economic SummaryEconomic Summary
33rdrd
Quarter 2010Quarter 2010
Gary CrosbieGary Crosbie
Economic Summary:Economic Summary:
Third QTR 2010Third QTR 2010
1. Overview:
• In general economic conditions in the third quarter were slightly positive
growing at a decreasing rate . That is down from 1st and 2nd quarter
indicating that the overall economic prospects are deteriorating not
improving from the 4th qtr 2009. 3rd Qtr GDP is estimated to fall in the
1.5-1.7 % range leading to average GDP growth for 2010 to be
downgraded from over 3% to 2.5-2.7% . Having said that, while the
economic indicators including employment have been less than exciting,
business’s are cash rich with healthy balance sheets and high productivity.
The bad news is no one is hiring due to uncertainty on taxes, regulations ,
healthcare and consumption. The bottom line is unlike previous recessions
that have V shape recoveries at 6-8% this is likely to be a long slow slog of
1.5-2.5% growth thru 2011 and for some time.
Economic Summary:Economic Summary:
• However..behind every cloud is a “Sliver of Sunshine” ..and here it
is….volume has been light for a prolonged period of time indicating that
the retail investor has been sitting on the side line for a lot of the same
reasons business is not spending. Uncertainty, risk aversion and fear has
driven any significant in flows of investment away from equities to
treasuries and the bond market. However, market sentiment has turned
with the prospects of significant changes in Washington in Nov , and with
equities undervalued and the Fed looking to QE2(quantitative easing 2) to
spark a fire under the economy there is some short run optimism.. This is
already a reality with a late surge in the market in September (see 8 below)
and has set the stage for a nice little rally here in the 4th Qtr. Investors are
matching the positive change in sentiment to the reality that a 3%
dividend on Mid cap and large cap stocks beats 2.5% on treasuries and
that is absent any appreciation due to growth. This is not a long term
expectation but should set the stage for some big infusions of cash into
ETF’s and Funds in the 4th qtr.
• The change in direction and the “September Surprise” from the 2nd qtr is
reflected in the gains YTD of the Dow and S&P from -8% , -9% to 3%
and 1% respectively.
• So….some additional comments:
Fed PolicyFed Policy ::
• Monetary policy
– In response to a faltering economy and an economic recovery that is
going in the wrong direction the Fed is signaling a new phase of
quantitative easing (QE2). This would mean the Fed could expand the
money supply and its monetary base by either reducing the Fed funds rate
from .25 to zero, repurchase treasuries and Mortgage backed securities or
both. Other than a shot to the equity markets due to low comparative ROR’s
on Bonds vs stocks, in my view I am not sure what this does to stimulate the
economy . It might help exports at the expense of further de-valuing the
dollar but the issue is not money availability. The fed has 2 trillion dollars on
its balance sheet(m2). The problem is velocity of money which comes from
lending, borrowing and investment all of which are invisible. Banks have
much stiffer regulatory and capital requirements not with standing the
number of foreclosures, short sales and suspect commercial loans sitting on
there balance sheets. Bottom line ..the low fed funds rate means banks can
“carry trade” the yield curve….borrow at zero and than turnover the money
and buy 5,7, 10 years treasuries and earn 150 to 250 basis points with
ZERO risk……Even bankers can make money doing that. So all the Fed
policy does is encourage the incest of the carry trade and devalue the dollar
There is no significant increase in the velocity of money which is the key to
growth. Now , it does impact business investment prospectives to be
discussed below.
Business InvestmentBusiness Investment..
• Velocity of Money.
– As discussed above(see 1 above) the “uncertainty
factor” has had a negative impact on business investment
and thus the velocity of money. Additionally, for those
business that are willing to take risk, there balance sheets
don’t meet new bank criteria which restricts loans to only
the best of customers. As stated above this is a result of the
much higher capital requirements that are imposed on
regional and community banks that had nothing to do with
the financial crisis but have had a stifling effect on small
business growth and thus employment. Given small
business contributes 45-50% of GDP and 55-65% of new
employment this is obviously the critical success factor to
future growth
Business InvestmentBusiness Investment..
• Quantitative Easing(QE2)
– We discussed Fed policy in 1 above. One advantage to
additional quantitative easing is the impact on lowering
the yield curve ..thus the cost of borrowing goes down.
Lower borrowing costs means a lower cost of capital which
means a lot of potential business growth projects that
wouldn’t look profitable now have higher positive Net
Present Value prove in’s due to the lower cost of capital.
So what the Fed is attempting to due here is trying to
improve the sentiment for more investment through low
borrowing costs and indirectly lower cost of capital for
prospective investment.
Business InvestmentBusiness Investment..
• Capital Investment:
– Unfortunately all businesses did was turnover and
refinance there embedded debt to cut there carrying costs
which is another reason why there is 1.7-2 trillion dollars
of cash sitting on business balance sheets. That cash is not
being invested due to the sentiment of “Uncertainty” as it
applies to taxes, fin regulation, Heath care , Cap and Tax
etc…So…the bottom line is big business could invest but
won’t due to the risk and uncertainty due to public policy.
Small business in addition to the same uncertainties of bad
public policy(Taxes, healthcare etc) are further denied the
availability of capital due to onerous financial regulation
that limits capital availability . The mid term elections
could change a lot of this sentiment to the positive.
Other Economic IndicatorsOther Economic Indicators..
Retail Sales: Consumption was flat to
up slightly through most of the 3rd Qtr
..…as was retail sales, consumer
spending and consumer confidence.
Generally these indicators don’t rise
significantly in the summer months.
They are usually flat maybe up
slightly . The key growth occurs in the
tail QTR’s , 1,2, and 4 . Those QTR’s
in the early stages of a nomal recovery
from a recession of this magnitude
generate GDP normally up 6-8% in
the post recovery periods.
Other Economic IndicatorsOther Economic Indicators..
GDP: We need a 3 -3.5% growth rate to
just stay even in unemployment(150-
200k jobs a month) and 6-8%(250-350 k
jobs per month) to make any gains at
all….The GDP growth is decreasing from
over 3% in the first qtr to projected 1.5-
1.7% fourth qtr. Thus, for all the
reasons’s stated above there is not
sufficient growth , consumption and
investment necessary to dramatically
improve the growth and therefore the
employment picture..
Unemployment:Unemployment:
• Per above…The unemployment
rate is at 9.7% up from 9.5% 2
nd qtr. The good news was there
were 86k private sector jobs
created in August, a decrease
form July with the decreases
coming from government
temporary census jobs. Again, the
real unemployment rate is close to
17-20% given that almost 1.6 to
2.1  million people have dropped
out of the labor market completely.
Unemployment:Unemployment:
As stated last Qtr, that rate of
9.7% is likely to increase as
those workers who dropped
out of the work force make
there way back in and are
counted by the Labor Dept
when the economy improves.
Housing Market:Housing Market:
• Even though interest rates are at
all time lows….less than 4% for
some 30 year loans. Most people
who could refinance already did at
the end of 2009. The problem now
is with downward pressure on
housing prices. 1/3 to 40% of all
mortgages are underwater. Even if
home owners wanted to hold on
they either don’t qualify for
refinancing or can’t meet or want
to meet the new financing
requirements(who wants to put
more money down on a home that
is underwater) of 20% down .
Housing Market:Housing Market:
• Further it is likely to get worse. In 2011 thru
2013 a lot of 5 and 7 year ARM’s that were
taken out in 2006 will come due for
refinance. Again many of these home owners
will not be able to meet the new financing
requirements which mean more downward
pressure on housing prices through defaults,
foreclosure and short sales. This translates
into another 10-15% decrease in housing
prices as inventories of foreclosures continues
to increase. It is hard to see how this economy
can make much progress until the housing
market turns around. Here in lies some of the
justification for why most forecasts for
growth next year and in 2012 are predicting
at best 1.5-2.5%
Mid term Elections:Mid term Elections:
• Political Analytics: Ok…everything up to this point has been pretty
pessimistic. How ever this Nov will be the sole driver to optimism for
investors. Nov 2 looks to be a major turn around in govt. Regardless of your
political preferences, markets prefer the axiom.”Governments that govern
least govern best” and with the strong possibility of a Republican controlled
house and an even split in the senate, investors will reward that result. We
are already seeing signs of this. As mentioned previously, retail investors and
thus volume has been non existent in the markets for over a year leaving the
health of the markets to pure technical traders . But, September ….which
historically is the worst month of the year for the markets saw 18 billion
dollars move off the sideline or out of fixed income investments into Mutual
Funds and ETF’s. This is a stunning turn around given only 10 billion
dollars moved into Mutual funds and ETF’s ALL YEAR. The result…the
indices realized the best September ever. So…as they say ..don’t fight the
trend…the trend is your friend. We should see a nice little rally here through
the 4th qtr. The only hole in this theory is taxes. If the Democrats don’t extend
all the Bush tax cuts , at least temporarily , all bets are off because there will
be a massive sell off in Dec to avoid a significant capital gains penalty in 2011.
Having said that, I believe the tax cuts will be extended in the Lame duck
session.
ForecastForecast
• Given the above and the S& P at 1148 at the end of QTR 3…(it was 1115
at end of 2009)…. The markets are over sold..and there is a lot of value out
there so even in the pessimistic case… my expectations for  the range of
outcomes for the rest of the year are:
– 1-     Optimistic… S&P moves in a trading range of aprox  5% to 8%  for the
next 3 months…. …1205 to 1240 .
– 2-    Pessimistic….S&P moves flat to up …….0 to 2%   … for the next 3
months ………………....1148 to 1171.
– 3-    Most Likely… S&P in a trading range aprox …2- 5% …. for the next 3
months …………… 1171  to 1205

3 Rd Qtr Economic Review

  • 1.
    Economic SummaryEconomic Summary 33rdrd Quarter2010Quarter 2010 Gary CrosbieGary Crosbie
  • 2.
    Economic Summary:Economic Summary: ThirdQTR 2010Third QTR 2010 1. Overview: • In general economic conditions in the third quarter were slightly positive growing at a decreasing rate . That is down from 1st and 2nd quarter indicating that the overall economic prospects are deteriorating not improving from the 4th qtr 2009. 3rd Qtr GDP is estimated to fall in the 1.5-1.7 % range leading to average GDP growth for 2010 to be downgraded from over 3% to 2.5-2.7% . Having said that, while the economic indicators including employment have been less than exciting, business’s are cash rich with healthy balance sheets and high productivity. The bad news is no one is hiring due to uncertainty on taxes, regulations , healthcare and consumption. The bottom line is unlike previous recessions that have V shape recoveries at 6-8% this is likely to be a long slow slog of 1.5-2.5% growth thru 2011 and for some time.
  • 3.
    Economic Summary:Economic Summary: •However..behind every cloud is a “Sliver of Sunshine” ..and here it is….volume has been light for a prolonged period of time indicating that the retail investor has been sitting on the side line for a lot of the same reasons business is not spending. Uncertainty, risk aversion and fear has driven any significant in flows of investment away from equities to treasuries and the bond market. However, market sentiment has turned with the prospects of significant changes in Washington in Nov , and with equities undervalued and the Fed looking to QE2(quantitative easing 2) to spark a fire under the economy there is some short run optimism.. This is already a reality with a late surge in the market in September (see 8 below) and has set the stage for a nice little rally here in the 4th Qtr. Investors are matching the positive change in sentiment to the reality that a 3% dividend on Mid cap and large cap stocks beats 2.5% on treasuries and that is absent any appreciation due to growth. This is not a long term expectation but should set the stage for some big infusions of cash into ETF’s and Funds in the 4th qtr. • The change in direction and the “September Surprise” from the 2nd qtr is reflected in the gains YTD of the Dow and S&P from -8% , -9% to 3% and 1% respectively. • So….some additional comments:
  • 4.
    Fed PolicyFed Policy:: • Monetary policy – In response to a faltering economy and an economic recovery that is going in the wrong direction the Fed is signaling a new phase of quantitative easing (QE2). This would mean the Fed could expand the money supply and its monetary base by either reducing the Fed funds rate from .25 to zero, repurchase treasuries and Mortgage backed securities or both. Other than a shot to the equity markets due to low comparative ROR’s on Bonds vs stocks, in my view I am not sure what this does to stimulate the economy . It might help exports at the expense of further de-valuing the dollar but the issue is not money availability. The fed has 2 trillion dollars on its balance sheet(m2). The problem is velocity of money which comes from lending, borrowing and investment all of which are invisible. Banks have much stiffer regulatory and capital requirements not with standing the number of foreclosures, short sales and suspect commercial loans sitting on there balance sheets. Bottom line ..the low fed funds rate means banks can “carry trade” the yield curve….borrow at zero and than turnover the money and buy 5,7, 10 years treasuries and earn 150 to 250 basis points with ZERO risk……Even bankers can make money doing that. So all the Fed policy does is encourage the incest of the carry trade and devalue the dollar There is no significant increase in the velocity of money which is the key to growth. Now , it does impact business investment prospectives to be discussed below.
  • 5.
    Business InvestmentBusiness Investment.. •Velocity of Money. – As discussed above(see 1 above) the “uncertainty factor” has had a negative impact on business investment and thus the velocity of money. Additionally, for those business that are willing to take risk, there balance sheets don’t meet new bank criteria which restricts loans to only the best of customers. As stated above this is a result of the much higher capital requirements that are imposed on regional and community banks that had nothing to do with the financial crisis but have had a stifling effect on small business growth and thus employment. Given small business contributes 45-50% of GDP and 55-65% of new employment this is obviously the critical success factor to future growth
  • 6.
    Business InvestmentBusiness Investment.. •Quantitative Easing(QE2) – We discussed Fed policy in 1 above. One advantage to additional quantitative easing is the impact on lowering the yield curve ..thus the cost of borrowing goes down. Lower borrowing costs means a lower cost of capital which means a lot of potential business growth projects that wouldn’t look profitable now have higher positive Net Present Value prove in’s due to the lower cost of capital. So what the Fed is attempting to due here is trying to improve the sentiment for more investment through low borrowing costs and indirectly lower cost of capital for prospective investment.
  • 7.
    Business InvestmentBusiness Investment.. •Capital Investment: – Unfortunately all businesses did was turnover and refinance there embedded debt to cut there carrying costs which is another reason why there is 1.7-2 trillion dollars of cash sitting on business balance sheets. That cash is not being invested due to the sentiment of “Uncertainty” as it applies to taxes, fin regulation, Heath care , Cap and Tax etc…So…the bottom line is big business could invest but won’t due to the risk and uncertainty due to public policy. Small business in addition to the same uncertainties of bad public policy(Taxes, healthcare etc) are further denied the availability of capital due to onerous financial regulation that limits capital availability . The mid term elections could change a lot of this sentiment to the positive.
  • 8.
    Other Economic IndicatorsOtherEconomic Indicators.. Retail Sales: Consumption was flat to up slightly through most of the 3rd Qtr ..…as was retail sales, consumer spending and consumer confidence. Generally these indicators don’t rise significantly in the summer months. They are usually flat maybe up slightly . The key growth occurs in the tail QTR’s , 1,2, and 4 . Those QTR’s in the early stages of a nomal recovery from a recession of this magnitude generate GDP normally up 6-8% in the post recovery periods.
  • 9.
    Other Economic IndicatorsOtherEconomic Indicators.. GDP: We need a 3 -3.5% growth rate to just stay even in unemployment(150- 200k jobs a month) and 6-8%(250-350 k jobs per month) to make any gains at all….The GDP growth is decreasing from over 3% in the first qtr to projected 1.5- 1.7% fourth qtr. Thus, for all the reasons’s stated above there is not sufficient growth , consumption and investment necessary to dramatically improve the growth and therefore the employment picture..
  • 10.
    Unemployment:Unemployment: • Per above…Theunemployment rate is at 9.7% up from 9.5% 2 nd qtr. The good news was there were 86k private sector jobs created in August, a decrease form July with the decreases coming from government temporary census jobs. Again, the real unemployment rate is close to 17-20% given that almost 1.6 to 2.1  million people have dropped out of the labor market completely.
  • 11.
    Unemployment:Unemployment: As stated lastQtr, that rate of 9.7% is likely to increase as those workers who dropped out of the work force make there way back in and are counted by the Labor Dept when the economy improves.
  • 12.
    Housing Market:Housing Market: •Even though interest rates are at all time lows….less than 4% for some 30 year loans. Most people who could refinance already did at the end of 2009. The problem now is with downward pressure on housing prices. 1/3 to 40% of all mortgages are underwater. Even if home owners wanted to hold on they either don’t qualify for refinancing or can’t meet or want to meet the new financing requirements(who wants to put more money down on a home that is underwater) of 20% down .
  • 13.
    Housing Market:Housing Market: •Further it is likely to get worse. In 2011 thru 2013 a lot of 5 and 7 year ARM’s that were taken out in 2006 will come due for refinance. Again many of these home owners will not be able to meet the new financing requirements which mean more downward pressure on housing prices through defaults, foreclosure and short sales. This translates into another 10-15% decrease in housing prices as inventories of foreclosures continues to increase. It is hard to see how this economy can make much progress until the housing market turns around. Here in lies some of the justification for why most forecasts for growth next year and in 2012 are predicting at best 1.5-2.5%
  • 14.
    Mid term Elections:Midterm Elections: • Political Analytics: Ok…everything up to this point has been pretty pessimistic. How ever this Nov will be the sole driver to optimism for investors. Nov 2 looks to be a major turn around in govt. Regardless of your political preferences, markets prefer the axiom.”Governments that govern least govern best” and with the strong possibility of a Republican controlled house and an even split in the senate, investors will reward that result. We are already seeing signs of this. As mentioned previously, retail investors and thus volume has been non existent in the markets for over a year leaving the health of the markets to pure technical traders . But, September ….which historically is the worst month of the year for the markets saw 18 billion dollars move off the sideline or out of fixed income investments into Mutual Funds and ETF’s. This is a stunning turn around given only 10 billion dollars moved into Mutual funds and ETF’s ALL YEAR. The result…the indices realized the best September ever. So…as they say ..don’t fight the trend…the trend is your friend. We should see a nice little rally here through the 4th qtr. The only hole in this theory is taxes. If the Democrats don’t extend all the Bush tax cuts , at least temporarily , all bets are off because there will be a massive sell off in Dec to avoid a significant capital gains penalty in 2011. Having said that, I believe the tax cuts will be extended in the Lame duck session.
  • 15.
    ForecastForecast • Given theabove and the S& P at 1148 at the end of QTR 3…(it was 1115 at end of 2009)…. The markets are over sold..and there is a lot of value out there so even in the pessimistic case… my expectations for  the range of outcomes for the rest of the year are: – 1-     Optimistic… S&P moves in a trading range of aprox  5% to 8%  for the next 3 months…. …1205 to 1240 . – 2-    Pessimistic….S&P moves flat to up …….0 to 2%   … for the next 3 months ………………....1148 to 1171. – 3-    Most Likely… S&P in a trading range aprox …2- 5% …. for the next 3 months …………… 1171  to 1205