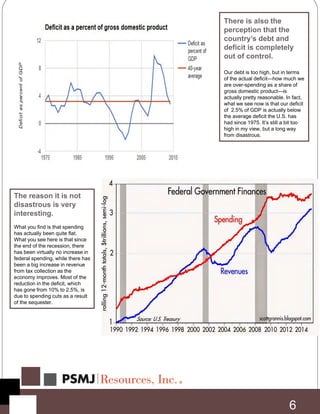
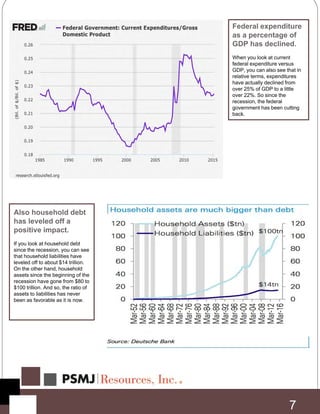
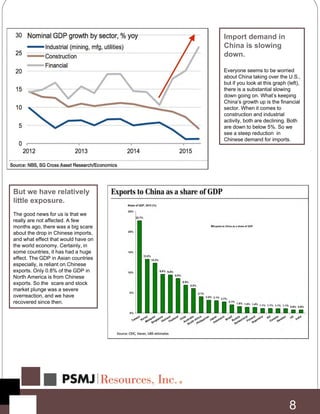
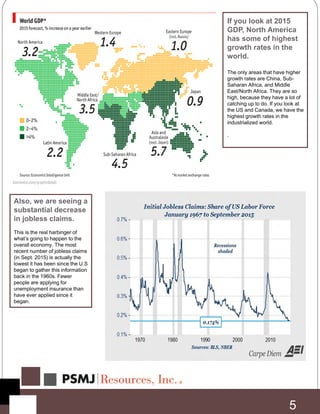
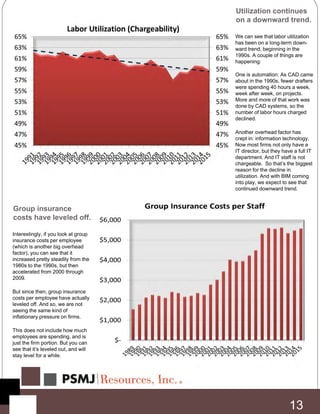
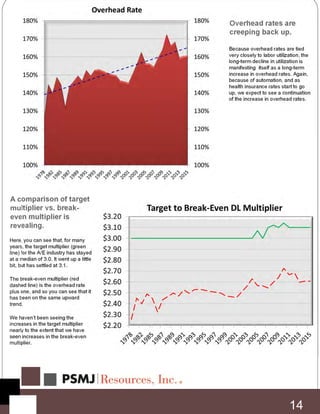
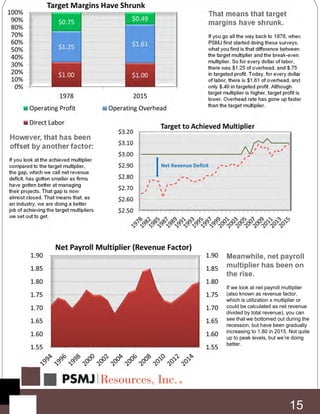
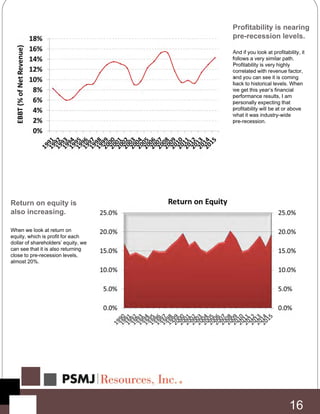
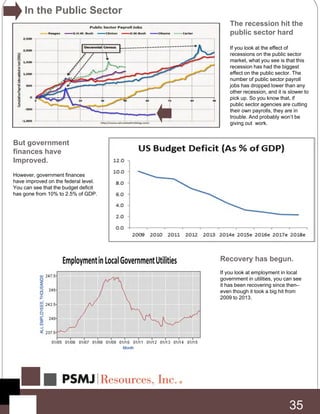
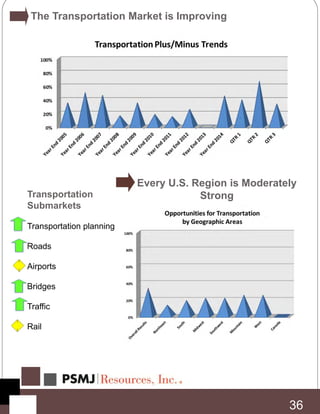
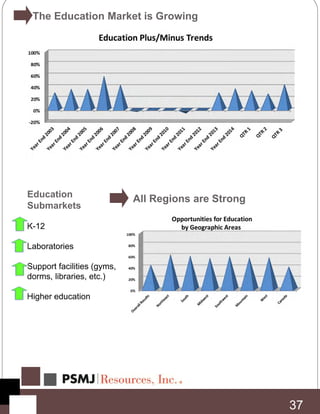
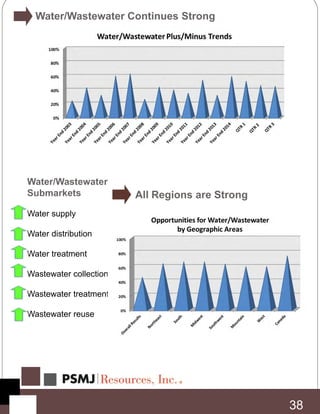
SlideShare a Scribd company logo
1 of 50
Download to read offline
How do the A/E/C
Markets Look
in 2016 and
Beyond?
By David Burstein, P.E.
PSMJ Resources, Inc.
PSMJ’s
A/E/C Market
Outlook
INTRODUCTION
Every year PSMJ does a forecast of the various architecture,
engineering, and construction (A/E/C) markets. This year, we
present PSMJ’s A/E/C Market Outlook: How do the A/E/C
Markets Look in 2016 and Beyond? This report covers A/E/C
industry and market trends for 2015 and 2016.
We begin by looking at trends in the overall economy–especially
those trend that affect A/E/C firms. Next, we detail what is
happening specifically in the A/E/C industry right now.
Then we present our outlook for next year and beyond—what we
think is going to happen in the various market sectors. We look at
which markets are up and which markets are down.
And finally, we conclude with recommendations on what A/E/C
firms should to do to be successful in 2016 and beyond.
We hope that you find this report helpful in your planning for 2016.
For more information and additional resources, please contact us
at 617-965-0055 or www.psmj.com.
2
I. Trends in the overall economy 4
II. What’s happening to the A/E/C industry now? 11
III. Which markets will be up and which will be down? 22
IV. What should you do? 43
Copyright ©2015 by PSMJ Resources, Inc.®
All rights reserved. No part of this publication may be reproduced or transmitted in
any form or by any means, electronic or mechanical, including photocopying and
recording, or by any information storage or retrieval system without the prior written
permission of the publisher.
PSMJ Resources Inc.’s material is protected by copyright. It is illegal under Federal
law to make copies or faxes of the publication without permission—even for internal
use. Violators risk criminal penalties and damages up to $100,000 per offense.
PSMJ Resources, Inc. will pay a reward of up to $1,000 for actionable evidence of
illegal copying or faxing.
PSMJ Resources, Inc.®
P.O. Box 95190 Nonantum, MA 02495
Phone: 617-965-0055 Fax: 617-965-5152
Email: customerservice@psmj.com
www.psmj.com
CONTENTS
3
If you listen to all of the candidates in the various states, there is a lot of anger
about our economy. The way that they talk, you’d think we are going down the
tubes. However, the data doesn’t actually support that view.
I. Trends in the Overall Economy
4
There’s a lot of anger about our economy
Let’s start with trends in the overall economy, especially those the affect the
A/E/C industry.
If you look at 2015
GDP, North America
has some of highest
growth rates in the
world.
The only areas that have higher
growth rates are China, Sub-
Saharan Africa, and Middle
East/North Africa. They are so
high, because they have a lot of
catching up to do. If you look at
the US and Canada, we have the
highest growth rates in the
industrialized world.
.
Also, we are seeing a
substantial decrease
in jobless claims.
This is the real harbinger of
what’s going to happen to the
overall economy. The most
recent number of jobless claims
(in Sept. 2015) is actually the
lowest it has been since the U.S
began to gather this information
back in the 1960s. Fewer
people are applying for
unemployment insurance than
have ever applied since it
began.
5
The reason it is not
disastrous is very
interesting.
What you find is that spending
has actually been quite flat.
What you see here is that since
the end of the recession, there
has been virtually no increase in
federal spending, while there has
been a big increase in revenue
from tax collection as the
economy improves. Most of the
reduction in the deficit, which
has gone from 10% to 2.5%, is
due to spending cuts as a result
of the sequester.
6
There is also the
perception that the
country’s debt and
deficit is completely
out of control.
Our debt is too high, but in terms
of the actual deficit—how much we
are over-spending as a share of
gross domestic product—is
actually pretty reasonable. In fact,
what we see now is that our deficit
of 2.5% of GDP is actually below
the average deficit the U.S. has
had since 1975. It’s still a bit too
high in my view, but a long way
from disastrous.
Federal expenditure
as a percentage of
GDP has declined.
When you look at current
federal expenditure versus
GDP, you can also see that in
relative terms, expenditures
have actually declined from
over 25% of GDP to a little
over 22%. So since the
recession, the federal
government has been cutting
back.
7
Also household debt
has leveled off a
positive impact.
If you look at household debt
since the recession, you can see
that household liabilities have
leveled off to about $14 trillion.
On the other hand, household
assets since the beginning of the
recession have gone from $80 to
$100 trillion. And so, the ratio of
assets to liabilities has never
been as favorable as it is now.
But we have relatively
little exposure.
The good news for us is that we
really are not affected. A few
months ago, there was a big scare
about the drop in Chinese imports,
and what effect that would have on
the world economy. Certainly, in
some countries, it has had a huge
effect. The GDP in Asian countries
especially, is reliant on Chinese
exports. Only 0.8% of the GDP in
North America is from Chinese
exports. So the scare and stock
market plunge was a severe
overreaction, and we have
recovered since then.
8
Import demand in
China is slowing
down.
Everyone seems to be worried
about China taking over the U.S.,
but if you look at this graph (left),
there is a substantial slowing
down going on. What’s keeping
China’s growth up is the financial
sector. When it comes to
construction and industrial
activity, both are declining. Both
are down to below 5%. So we
see a steep reduction in
Chinese demand for imports.
But it is not going
happen right away.
The most reliable predictor of
future recessions is what
economists call the “yield curve.”
The signal that it shows now is
not at all like it looked when the
country was going into
recession, as indicated by the
deep red circles.
9
We will have another
recession.
Will there be another recession?
Absolutely! Recessions come
and go. When you are in one, it
feels like it will last forever, and
it never does. When you are in
an expansion, that feels like it
will last forever, and it never
does. We are 74 months since
the last recession, and that is
just a little above the median
duration of recessions since
1960. So we are due for another
recession.
A tighter labor market.
The biggest problem we see in
today’s economy is that the labor
market is tighter. You can see in
this survey by the National
Federation of Independent
Businesses, that the percentage of
small businesses reporting few or
no qualified applicants for job
openings is approaching 50%. This
is higher than it was before the
recession.
10
Most sunny with a
few clouds.
Basically, we find that in
2016, we’ll have pretty good
economy!
So our prediction for the U.S. Economy in 2016 is:
The biggest problem in today’s economy is:
II. What’s Happening in the A/E/C Industry
Now?
11
To start, we look at financial trends in the A/E/C
industry now, as reported in PSMJ’s 2015 Financial
Performance Benchmark Survey Report.
Revenue also
continues to grow.
Based on our 2015 Financial
Performance Benchmark
Survey Report, we can see that
revenues are also increasing. In
fact, in the past year, revenues
increased to a high of about
10% for the median A/E firm .
Firm staff continues
to grow.
Based on our 2015 Financial
Performance Benchmark
Survey Report, we can see
that firm staff has been growing
over the past few years. In fact,
in this past year, we had a
median staff growth rate of
almost 4%. The big drops in
staff seen in previous years
have definitely turned around.
12
Group insurance
costs have leveled off.
Interestingly, if you look at group
insurance costs per employee
(which is another big overhead
factor), you can see that it
increased pretty steadily from the
1980s to the 1990s, but then
accelerated from 2000 through
2009.
But since then, group insurance
costs per employee have actually
leveled off. And so, we are not
seeing the same kind of
inflationary pressure on firms.
This does not include how much
employees are spending, and is
just the firm portion. But you can
see that it’s leveled out, and will
stay level for a while.
Utilization continues
on a downward trend.
We can see that labor utilization
has been on a long-term down-
ward trend, beginning in the
1990s. A couple of things are
happening:
One is automation: As CAD came
about in the 1990s, fewer drafters
were spending 40 hours a week,
week after week, on projects.
More and more of that work was
done by CAD systems, so the
number of labor hours charged
declined.
Another overhead factor has
crept in: information technology.
Now most firms not only have a
IT director, but they have a full IT
department. And IT staff is not
chargeable. So that’s the biggest
reason for the decline in
utilization. And with BIM coming
into play, we expect to see that
continued downward trend.
13
A comparison of target
multiplier vs. break-
even multiplier is
revealing.
Here, you can see that, for many
years, the target multiplier (green
line) for the A/E industry has stayed
at a median of 3.0. It went up a little
bit, but has settled at 3.1.
The break-even multiplier (red
dashed line) is the overhead rate
plus one, and so you can see that it
has been on the same upward
trend.
We haven’t been seeing the
increases in the target multiplier
nearly to the extent that we have
seen increases in the break-even
multiplier.
Overhead rates are
creeping back up.
Because overhead rates are tied
very closely to labor utilization, the
long-term decline in utilization is
manifesting itself as a long-term
increase in overhead rates. Again,
because of automation, and as
health insurance rates start to go
up, we expect to see a continuation
of the increase in overhead rates.
14
That means that target
margins have shrunk.
If you go all the way back to 1978, when
PSMJ first started doing these surveys,
what you find is that difference between
the target multiplier and the break-even
multiplier. So for every dollar of labor,
there was $1.25 of overhead, and $.75
in targeted profit. Today, for every dollar
of labor, there is $1.61 of overhead, and
only $.49 in targeted profit. Although
target multiplier is higher, target profit is
lower. Overhead rate has gone up faster
than the target multiplier.
However, that has been
offset by another factor:
If you look at the achieved multiplier
compared to the target multiplier,
the gap, which we call net revenue
deficit, has gotten smaller as firms
have gotten better at managing
their projects. That gap is now
almost closed. That means that, as
an industry, we are doing a better
job of achieving the target multipliers
we set out to get.
Meanwhile, net payroll
multiplier has been on
the rise.
If we look at net payroll multiplier
(also known as revenue factor,
which is utilization x multiplier or
could be calculated as net revenue
divided by total revenue), you can
see that we bottomed out during the
recession, but have been gradually
increasing to 1.80 in 2015. Not quite
up to peak levels, but we’re doing
better.
15
Profitability is nearing
pre-recession levels.
And if you look at profitability, it
follows a very similar path.
Profitability is very highly
correlated with revenue factor,
and you can see it is coming
back to historical levels. When
we get this year’s financial
performance results, I am
personally expecting that
profitability will be at or above
what it was industry-wide
pre-recession.
Return on equity is
also increasing.
When we look at return on
equity, which is profit for each
dollar of shareholders’ equity, we
can see that it is also returning
close to pre-recession levels,
almost 20%.
16
17
PSMJ
Survey
 PSMJ conducts
quarterly market
surveys as a free
service to the industry.
 Input is restricted to A/E
firms.
 200-500 people
respond to these
surveys.
 We use this data to
chart trends using a
“Plus/Minus Index”.
PSMJ’s Quarterly
Market Surveys
Next, we look at financial trends in the A/E/C industry
as reported in PSMJ’s Quarterly Market Surveys.
18
How We Compute the
“Plus/Minus Index”
Sample Question: Are revenues in the transportation sector
increasing or decreasing compared to last quarter?
Sample Calculation:
Total firms reporting = 185
Firms reporting an increase = 60 firms x 1 points = +60
Firms reporting no change = 80 firms x 0 points = 0
Firms reporting a decrease = 45 firms x -1 points = -45
Total “points” = +15
Index = 15 ÷ 185 = +8%
21 consecutive
quarters
of increasing A/E
firm revenues…
If we look at revenue, what we
see is that there has been 21
consecutive quarters where
more A/E firms are seeing
increases in revenues rather
than decreases.
…Have resulted in
more backlog
Ongoing increases in revenue
have resulted in more firms
seeing increases in backlog.
…Creating optimism
about the future
Increased backlog has created
optimism about the future,
because firms are continuing to
project increases in revenue.
19
When Planning
Your Firm’s
Strategy…
“Don’t skate to where the
puck is. Skate to where
it’s going to be.”
-- Wayne Gretzky
In other words: Look at
where things are going to be
in the future, and plan your
strategy to that, rather than to
where things are today.
We find that most predictions are wrong for two reasons:
People tend to look at
lagging indicators.
Lagging indicators are things that
tell you what’s happening today
or yesterday, in some cases. You
should be looking at leading
indicators, things that can tell you
what’s happening tomorrow.
They extrapolate the
past into the future.
Just because there is a trend in
the past, you cannot extrapolate it
into the future, because it does not
necessarily happen the way it was
projected.
Instead, we look at two things:
We look at leading indicators and we look for turning points - where the
trends of the past has changed and gone in a different direction.
Turning Points
A/E proposal opportunities are the most leading
indicator.
We find that the top leading indicator for A/E firms is proposal opportunities.
When firms see more proposal opportunities that means that eventually A/E firms
will win more projects. This will increase their backlog, and then increase their
revenue. More proposal opportunities will also increase the cash flow for A/E
firms, and ultimately revenues and cash flow for construction firms.
23
24
A/E proposal
opportunities
continue their
upward trend
When we look at proposal
opportunities over the past
quarters (and we started
doing this in 2003, so there is
a lot of data to look at), we
see a continued increase in
the optimism of firm, and how
they see proposal
opportunities. In fact, what
you see is that proposal
opportunities are on an
upward slope. Not only are
firms optimistic, but they seem
to be increasingly optimistic,
based on the number of
proposal opportunities they’re
reporting.
All regions are
showing substantial
increases
If you look at proposal trends
regionally, there are very strong
results in all the regions. Canada
is the weakest region (33%), but
even in Canada, things are very
positive.
Now, we will look at what
markets are up and which
markets are down.
III. Which A/E Markets Are…
25
Let’s Look Closer at A/E Proposal Activity
Following is an outline of
proposal activity in all major
markets overall and by region.
We also look at which
submarkets are up or down.
All data was gathered in
PSMJ’s Quarterly Market
Surveys.
Energy/Utilities
Submarkets
Renewable energy
Power plants
Utility distribution
Telecom/cable
Pipelines
In All Regions
26
Energy/Utilities Market Remains Strong
Especially in Canada
27
The Heavy Industry Market is Slowing
In All Regions
Light Industry Looks Better
28
Industrial Submarkets
29
Mining and resource extraction
(including oil)
Primary materials manufacturing
Petroleum facilities
Pharmaceutical manufacturing
Chemical plants
Component assembly (including
telecom)
Warehouse/distribution facilities
Repair/service facilities
In All Regions
30
The Housing Market is Very Strong
Other Housing
Submarkets
Condominiums
Multi-family housing
(apartments)
Single family homes
Senior and assisted
living
In All Regions
31
The Commercial Markets Have Fully Recovered
Commercial
Submarkets
Office Buildings
Retail Buildings (for lease)
Warehouse & Distribution
Facilities
Restaurants
Hotels/motels
Retail Buildings
Call Centers & Data
Facilities
All Regions Are Still Strong
32
Environmental Markets May be Slowing
Environmental
Submarkets
Waste disposal (landfills,
etc.)
Wetlands delineation
Site characterization
Site cleanup
Environmental permitting
Resource management
Air pollution
In All Regions
33
The Healthcare Market Remains Strong
Healthcare
Submarkets
Hospitals
Medical offices
Continuing care facilities
Medical laboratories
There is another factor involved: If you go back to 2007, you can see that the
average firm that specialized in the healthcare market had about 8% higher
profitability than the average A/E firm overall. Fast forward to 2014-2015, profits
for firms that specialize in the healthcare market are less profitable than the
average firm overall. This indicates that, although the market is strong, the
number of firms going into the market is growing faster than the market itself is
growing.
But the profit premium for healthcare firms is gone.
34
The recession hit the
public sector hard
If you look at the effect of
recessions on the public sector
market, what you see is that this
recession has had the biggest
effect on the public sector. The
number of public sector payroll
jobs has dropped lower than any
other recession, and it is slower to
pick up. So you know that, if
public sector agencies are cutting
their own payrolls, they are in
trouble. And probably won’t be
giving out work.
But government
finances have
Improved.
However, government finances
have improved on the federal level.
You can see that the budget deficit
has gone from 10% to 2.5% of GDP.
Recovery has begun.
If you look at employment in local
government in utilities, you can see
it has been recovering since then–
even though it took a big hit from
2009 to 2013.
In the Public Sector
35
Every U.S. Region is Moderately
Strong
36
The Transportation Market is Improving
Transportation
Submarkets
Transportation planning
Roads
Airports
Bridges
Traffic
Rail
All Regions are Strong
37
The Education Market is Growing
Education
Submarkets
K-12
Laboratories
Support facilities (gyms,
dorms, libraries, etc.)
Higher education
All Regions are Strong
38
Water/Wastewater Continues Strong
Water/Wastewater
Submarkets
Water supply
Water distribution
Water treatment
Wastewater collection
Wastewater treatment
Wastewater reuse
Except in Canada
39
Other Government Buildings Are (Finally) Beginning to
Recover
Other Government
Buildings
Submarkets
Public Safety
Public Recreation
Justice Facilities
Sports Facilities
Summary of Proposal Plus/Minus Index
Housing
Commercial Users
Commercial Developer
Light Industrial
Heavy Industrial
Energy & Utilities
Water/Wastewater
Environmental
Education
Transportation
Other Gov’t. Buildings
Health Care
0-20-40-60-80 +20 +40 +60 +80 +100-100
0-20-40-60-80 +20 +40 +60 +80 +100-100
40
The Hottest Submarkets
If you look at the submarkets, the hottest right now is continuing care facilities,
followed closely by retirement/assisted-living facilities. As the population ages,
there is a lot of demand in those markets.
41
Profitability is also important.
You need to get an idea not only of how good market sectors are from a revenue
standpoint, but also of how profitable each market sector is—in comparison to the
median profitability in the A/E industry overall.
In the chart below, we have gone back five years, looking at markets where firms
are less profitable (red), where firms are somewhat less profitable (pink), where
firms are somewhat more profitable (light green), and where firms are significantly
more profitable (dark green).
42
To winning the war for talent
43
IV. So What Should Our Firm Do?
We believe you need to move your focus:
From winning the war for clients
Reason #1: Firms Are Growing Again,
Increasing the Demand for Talent
Source: U.S. Department of Labor
Employment in U.S. A/E Industry
As you can see in the chart below, we reached a peak of 1,450,000 employees in
the A/E industry before the recession. We are coming pretty close to reaching that
peak right now.
44
Reason #2: The Long-term Decline in
Employee Turnover…
If you go all the way
back to 1985…
Do a little regression, and you
can see that the average
employee turnover has declined
from about 40% a year to about
12% a year in 2015. It looks like
there has been a huge decline
in turnover.
45
If you look at it a bit
differently…
Based on a three-year moving
average, what you find is that
the trend in turnover decline
has reversed. There is a turning
point in recent years, where we
see employee turnover is going
up. That creates additional
demand for people.
…May Be Coming to an End
Reason #3 – Boomers Are Beginning to Retire
Back in 1900, only 6.2% of the population was over 65. By 2000, that was up to
16%, and by 2050, it will be almost a quarter of the population (23.8%).
46
Reason #4: There Are Big Gaps in Supply
Source: American Society for Engineering Education
Civil engineering
as an example:
You can see that if you are
looking for a civil engineer,
with about 10-15 years of
experience, they are just not
out there because few
graduated in 2001-2005, for
example. There is an upswing
in people getting degrees but
a big gap in experienced
people.
Architecture is not
as extreme.
However, there is definitely a
big gap in people with about
10-15 years of experience.
They are not out there
because fewer graduated in
1996-2001. And architecture
degrees have actually been
declining recent years.
47
Are we attracting the best and brightest new grads?
Sources:
2014 Salary
Survey, National
Association of
Colleges and
Employers
2014 PSMJ Staff
Salary Survey
Another thing you need to consider is that you are not just competing for graduates
with other A/E firms. You are competing with all kinds of industries. Here, we look
at two sets of data: The blue bar is data from the National Association of Colleges
and Employers. All of their median starting salaries are higher than the top 25%
A/E firms. Even the top quartile of A/E firms are paying less than the median for all
employers.
48
Experienced
Professionals
(who are retiring)
with New Grads,
(of which
there are a
surplus)
Reason #5: You Can’t Simply Replace…
49
What happens if you raise salaries while holding
prices steady?
The answer is that your profit margins, which are thin enough right now, will
become even thinner. And if you raise salaries a lot, they will fall into the
negative. That’s really not a solution.
How many of you have…
• Raised your prices in the past 2 years?
– A number have raised their hand and said yes.
• Regretted doing so because you lost too much work?
– Of all of those firms that raised their prices, only two said they lost business.
Raise your fees and offer higher salaries to attract the
best and brightest!
For all these reasons you need to look to
winning the war for talent.
I have asked this question of many
firms:
So the conclusion is:
ABOUT PSMJ
Over 40 years of helping
A/E/C firms achieve
business success.
PSMJ Resources, Inc. is the world’s leading
authority, publisher, and consultant on
the effective management of architecture,
engineering, and construction firms.
With offices in the United States as well as
the United Kingdom and Australia, PSMJ
offers over 150 titles in book, audio, and video
format.
In addition, the company publishes several
monthly periodicals and delivers dozens of
seminars, roundtables, conferences, webinars,
and in-house training sessions every year for
A/E/C professionals around the world.
PSMJ’s sought-after consulting expertise
covers a range of critical business areas such
as strategic planning, project management,
valuation, succession planning, and mergers &
acquisitions.
PSMJ is also active within the community,
utilizing our resources and the contacts at our
fingertips within the A/E/C Industry to help
those in need.

More Related Content

What's hot

2015 san diego and national economic update july 24 2015
2015 san diego and national economic update july 24 20152015 san diego and national economic update july 24 2015
2015 san diego and national economic update july 24 2015Evan Donaldson
 
4Q_2015_RetailReport_email
4Q_2015_RetailReport_email4Q_2015_RetailReport_email
4Q_2015_RetailReport_emailPatrick Anthon
 
Trump100 days- Implications for the Property Markets
Trump100 days-  Implications for the Property Markets Trump100 days-  Implications for the Property Markets
Trump100 days- Implications for the Property Markets Guy Masse
 
Commercial Real Estate Outlook - November 2010
Commercial Real Estate Outlook - November 2010Commercial Real Estate Outlook - November 2010
Commercial Real Estate Outlook - November 2010NAR Research
 
Articles
ArticlesArticles
ArticlesSHK
 
2017 Zambia Budget analysis and highlights
2017 Zambia Budget analysis and highlights2017 Zambia Budget analysis and highlights
2017 Zambia Budget analysis and highlightsKampamba Shula
 
Trump Tax Cut a Bust for Investment and Hiring
Trump Tax Cut a Bust for Investment and HiringTrump Tax Cut a Bust for Investment and Hiring
Trump Tax Cut a Bust for Investment and HiringInvestingTips
 
2018 Global Outlook Webinar
2018 Global Outlook Webinar2018 Global Outlook Webinar
2018 Global Outlook WebinarDun & Bradstreet
 
United States Unemployment Rate Predictor Model
United States Unemployment Rate Predictor ModelUnited States Unemployment Rate Predictor Model
United States Unemployment Rate Predictor ModelVeshal Arul Prakash
 
The global economy effects on commodity dependent countries like zambia
The global economy effects on commodity dependent countries like zambiaThe global economy effects on commodity dependent countries like zambia
The global economy effects on commodity dependent countries like zambiaKampamba Shula
 
Fiscal management – Conservative Party of Canada - PM Harper
Fiscal management – Conservative Party of Canada  - PM HarperFiscal management – Conservative Party of Canada  - PM Harper
Fiscal management – Conservative Party of Canada - PM Harperpaul young cpa, cga
 
0714 economy report_lvic_02 (1)
0714 economy report_lvic_02 (1)0714 economy report_lvic_02 (1)
0714 economy report_lvic_02 (1)michaellathigee
 
Why is Canada and the World headed to Slow Growth?
Why is Canada and the World headed to Slow Growth? Why is Canada and the World headed to Slow Growth?
Why is Canada and the World headed to Slow Growth? paul young cpa, cga
 
Accenture Spend Trends Report Q1 2015
Accenture Spend Trends Report Q1 2015Accenture Spend Trends Report Q1 2015
Accenture Spend Trends Report Q1 2015Accenture Operations
 
2014 Economy Report by Mike Lathigee
2014 Economy Report by Mike Lathigee2014 Economy Report by Mike Lathigee
2014 Economy Report by Mike Lathigeemichaellathigee
 
2019 Election| World Economy| Slow Growth| Canada| July 2019
2019 Election| World Economy| Slow Growth| Canada| July 20192019 Election| World Economy| Slow Growth| Canada| July 2019
2019 Election| World Economy| Slow Growth| Canada| July 2019paul young cpa, cga
 

What's hot (20)

2015 san diego and national economic update july 24 2015
2015 san diego and national economic update july 24 20152015 san diego and national economic update july 24 2015
2015 san diego and national economic update july 24 2015
 
4Q_2015_RetailReport_email
4Q_2015_RetailReport_email4Q_2015_RetailReport_email
4Q_2015_RetailReport_email
 
Trump100 days- Implications for the Property Markets
Trump100 days-  Implications for the Property Markets Trump100 days-  Implications for the Property Markets
Trump100 days- Implications for the Property Markets
 
Commercial Real Estate Outlook - November 2010
Commercial Real Estate Outlook - November 2010Commercial Real Estate Outlook - November 2010
Commercial Real Estate Outlook - November 2010
 
Articles
ArticlesArticles
Articles
 
Coming Soon February 2016
Coming Soon February 2016Coming Soon February 2016
Coming Soon February 2016
 
2017 Zambia Budget analysis and highlights
2017 Zambia Budget analysis and highlights2017 Zambia Budget analysis and highlights
2017 Zambia Budget analysis and highlights
 
Trump Tax Cut a Bust for Investment and Hiring
Trump Tax Cut a Bust for Investment and HiringTrump Tax Cut a Bust for Investment and Hiring
Trump Tax Cut a Bust for Investment and Hiring
 
16TAP YearEndLetter 2016
16TAP YearEndLetter 201616TAP YearEndLetter 2016
16TAP YearEndLetter 2016
 
2018 Global Outlook Webinar
2018 Global Outlook Webinar2018 Global Outlook Webinar
2018 Global Outlook Webinar
 
United States Unemployment Rate Predictor Model
United States Unemployment Rate Predictor ModelUnited States Unemployment Rate Predictor Model
United States Unemployment Rate Predictor Model
 
The global economy effects on commodity dependent countries like zambia
The global economy effects on commodity dependent countries like zambiaThe global economy effects on commodity dependent countries like zambia
The global economy effects on commodity dependent countries like zambia
 
Fiscal management – Conservative Party of Canada - PM Harper
Fiscal management – Conservative Party of Canada  - PM HarperFiscal management – Conservative Party of Canada  - PM Harper
Fiscal management – Conservative Party of Canada - PM Harper
 
SVB Q1 2017 Economic Report
SVB Q1 2017 Economic ReportSVB Q1 2017 Economic Report
SVB Q1 2017 Economic Report
 
0714 economy report_lvic_02 (1)
0714 economy report_lvic_02 (1)0714 economy report_lvic_02 (1)
0714 economy report_lvic_02 (1)
 
Why is Canada and the World headed to Slow Growth?
Why is Canada and the World headed to Slow Growth? Why is Canada and the World headed to Slow Growth?
Why is Canada and the World headed to Slow Growth?
 
Accenture Spend Trends Report Q1 2015
Accenture Spend Trends Report Q1 2015Accenture Spend Trends Report Q1 2015
Accenture Spend Trends Report Q1 2015
 
Polish Economic Outlook 01/2010
Polish Economic Outlook 01/2010Polish Economic Outlook 01/2010
Polish Economic Outlook 01/2010
 
2014 Economy Report by Mike Lathigee
2014 Economy Report by Mike Lathigee2014 Economy Report by Mike Lathigee
2014 Economy Report by Mike Lathigee
 
2019 Election| World Economy| Slow Growth| Canada| July 2019
2019 Election| World Economy| Slow Growth| Canada| July 20192019 Election| World Economy| Slow Growth| Canada| July 2019
2019 Election| World Economy| Slow Growth| Canada| July 2019
 

Similar to PSMJ's 2015 A/E/C Market Outlook

1Introduction My name is Yinan Hong. I am your port.docx
 1Introduction My name is Yinan Hong. I am your port.docx 1Introduction My name is Yinan Hong. I am your port.docx
1Introduction My name is Yinan Hong. I am your port.docxaryan532920
 
Bust2Boom: Are you ready for the recovery
Bust2Boom: Are you ready for the recoveryBust2Boom: Are you ready for the recovery
Bust2Boom: Are you ready for the recoveryvsivapalan
 
It is about economic analysis for US from 2014-2016Review my paper.docx
It is about economic analysis for US from 2014-2016Review my paper.docxIt is about economic analysis for US from 2014-2016Review my paper.docx
It is about economic analysis for US from 2014-2016Review my paper.docxBHANU281672
 
4th Qtr Year End 2011 Economic Review Feb 15 [Autosaved] [Autosaved]
4th Qtr Year End 2011 Economic  Review Feb 15 [Autosaved] [Autosaved]4th Qtr Year End 2011 Economic  Review Feb 15 [Autosaved] [Autosaved]
4th Qtr Year End 2011 Economic Review Feb 15 [Autosaved] [Autosaved]Gary Crosbie
 
4th Qtr Year End 2011 Economic Review Feb 15 [Autosaved] [Autosaved]
4th Qtr Year End 2011 Economic  Review Feb 15 [Autosaved] [Autosaved]4th Qtr Year End 2011 Economic  Review Feb 15 [Autosaved] [Autosaved]
4th Qtr Year End 2011 Economic Review Feb 15 [Autosaved] [Autosaved]Gary Crosbie
 
4th Qtr Year End 2011 Economic Review Feb 15 [Autosaved] [Autosaved]
4th Qtr Year End 2011 Economic  Review Feb 15 [Autosaved] [Autosaved]4th Qtr Year End 2011 Economic  Review Feb 15 [Autosaved] [Autosaved]
4th Qtr Year End 2011 Economic Review Feb 15 [Autosaved] [Autosaved]Gary Crosbie
 
4th Qtr Year End 2011 Economic Review Feb 15 [Autosaved] [Autosaved]
4th Qtr Year End 2011 Economic  Review Feb 15 [Autosaved] [Autosaved]4th Qtr Year End 2011 Economic  Review Feb 15 [Autosaved] [Autosaved]
4th Qtr Year End 2011 Economic Review Feb 15 [Autosaved] [Autosaved]Gary Crosbie
 
State of the Construction Industry Report (2015)
State of the Construction Industry Report (2015)State of the Construction Industry Report (2015)
State of the Construction Industry Report (2015)The Vertex Companies, LLC
 
2015 State of the Construction Industry
2015 State of the Construction Industry 2015 State of the Construction Industry
2015 State of the Construction Industry Lisa Dehner
 
Skirting the Abyss: From Economic Downturn to Financial Crisis to Long-term M...
Skirting the Abyss: From Economic Downturn to Financial Crisis to Long-term M...Skirting the Abyss: From Economic Downturn to Financial Crisis to Long-term M...
Skirting the Abyss: From Economic Downturn to Financial Crisis to Long-term M...Llinlithgow Associates
 
Fall 2016 Linneman Associates Capital Markets Webinar Transcript Sample
Fall 2016 Linneman Associates Capital Markets Webinar Transcript SampleFall 2016 Linneman Associates Capital Markets Webinar Transcript Sample
Fall 2016 Linneman Associates Capital Markets Webinar Transcript SampleReal Estate Financial Modeling
 
Mr. Wood Block 1 slideshow
Mr. Wood Block 1 slideshowMr. Wood Block 1 slideshow
Mr. Wood Block 1 slideshowdoritrenter
 
3 Rd Qtr Economic Review
3 Rd Qtr Economic Review3 Rd Qtr Economic Review
3 Rd Qtr Economic ReviewGary Crosbie
 
Finlight Research - Market Perspectives - Apr 2016
Finlight Research - Market Perspectives - Apr 2016Finlight Research - Market Perspectives - Apr 2016
Finlight Research - Market Perspectives - Apr 2016FinLight Research
 
The us economy no double dip
The us economy   no double dipThe us economy   no double dip
The us economy no double dipMarkets Beyond
 

Similar to PSMJ's 2015 A/E/C Market Outlook (20)

1Introduction My name is Yinan Hong. I am your port.docx
 1Introduction My name is Yinan Hong. I am your port.docx 1Introduction My name is Yinan Hong. I am your port.docx
1Introduction My name is Yinan Hong. I am your port.docx
 
Bust2Boom: Are you ready for the recovery
Bust2Boom: Are you ready for the recoveryBust2Boom: Are you ready for the recovery
Bust2Boom: Are you ready for the recovery
 
It is about economic analysis for US from 2014-2016Review my paper.docx
It is about economic analysis for US from 2014-2016Review my paper.docxIt is about economic analysis for US from 2014-2016Review my paper.docx
It is about economic analysis for US from 2014-2016Review my paper.docx
 
4th Qtr Year End 2011 Economic Review Feb 15 [Autosaved] [Autosaved]
4th Qtr Year End 2011 Economic  Review Feb 15 [Autosaved] [Autosaved]4th Qtr Year End 2011 Economic  Review Feb 15 [Autosaved] [Autosaved]
4th Qtr Year End 2011 Economic Review Feb 15 [Autosaved] [Autosaved]
 
2015 Year End Outlook
2015 Year End Outlook2015 Year End Outlook
2015 Year End Outlook
 
4th Qtr Year End 2011 Economic Review Feb 15 [Autosaved] [Autosaved]
4th Qtr Year End 2011 Economic  Review Feb 15 [Autosaved] [Autosaved]4th Qtr Year End 2011 Economic  Review Feb 15 [Autosaved] [Autosaved]
4th Qtr Year End 2011 Economic Review Feb 15 [Autosaved] [Autosaved]
 
4th Qtr Year End 2011 Economic Review Feb 15 [Autosaved] [Autosaved]
4th Qtr Year End 2011 Economic  Review Feb 15 [Autosaved] [Autosaved]4th Qtr Year End 2011 Economic  Review Feb 15 [Autosaved] [Autosaved]
4th Qtr Year End 2011 Economic Review Feb 15 [Autosaved] [Autosaved]
 
4th Qtr Year End 2011 Economic Review Feb 15 [Autosaved] [Autosaved]
4th Qtr Year End 2011 Economic  Review Feb 15 [Autosaved] [Autosaved]4th Qtr Year End 2011 Economic  Review Feb 15 [Autosaved] [Autosaved]
4th Qtr Year End 2011 Economic Review Feb 15 [Autosaved] [Autosaved]
 
State of the Construction Industry Report (2015)
State of the Construction Industry Report (2015)State of the Construction Industry Report (2015)
State of the Construction Industry Report (2015)
 
2015 State of the Construction Industry
2015 State of the Construction Industry 2015 State of the Construction Industry
2015 State of the Construction Industry
 
Skirting the Abyss: From Economic Downturn to Financial Crisis to Long-term M...
Skirting the Abyss: From Economic Downturn to Financial Crisis to Long-term M...Skirting the Abyss: From Economic Downturn to Financial Crisis to Long-term M...
Skirting the Abyss: From Economic Downturn to Financial Crisis to Long-term M...
 
xTAP QuarterlyLetter 201609
xTAP QuarterlyLetter 201609xTAP QuarterlyLetter 201609
xTAP QuarterlyLetter 201609
 
Group M TYNY Report
Group M TYNY ReportGroup M TYNY Report
Group M TYNY Report
 
Fall 2016 Linneman Associates Capital Markets Webinar Transcript Sample
Fall 2016 Linneman Associates Capital Markets Webinar Transcript SampleFall 2016 Linneman Associates Capital Markets Webinar Transcript Sample
Fall 2016 Linneman Associates Capital Markets Webinar Transcript Sample
 
Mr. Wood Block 1 slideshow
Mr. Wood Block 1 slideshowMr. Wood Block 1 slideshow
Mr. Wood Block 1 slideshow
 
FNB
FNBFNB
FNB
 
3 Rd Qtr Economic Review
3 Rd Qtr Economic Review3 Rd Qtr Economic Review
3 Rd Qtr Economic Review
 
GOOG_VALUATION
GOOG_VALUATIONGOOG_VALUATION
GOOG_VALUATION
 
Finlight Research - Market Perspectives - Apr 2016
Finlight Research - Market Perspectives - Apr 2016Finlight Research - Market Perspectives - Apr 2016
Finlight Research - Market Perspectives - Apr 2016
 
The us economy no double dip
The us economy   no double dipThe us economy   no double dip
The us economy no double dip
 

Recently uploaded

Keppel Ltd. 1Q 2024 Business Update Presentation Slides
Keppel Ltd. 1Q 2024 Business Update  Presentation SlidesKeppel Ltd. 1Q 2024 Business Update  Presentation Slides
Keppel Ltd. 1Q 2024 Business Update Presentation SlidesKeppelCorporation
 
Regression analysis: Simple Linear Regression Multiple Linear Regression
Regression analysis:  Simple Linear Regression Multiple Linear RegressionRegression analysis:  Simple Linear Regression Multiple Linear Regression
Regression analysis: Simple Linear Regression Multiple Linear RegressionRavindra Nath Shukla
 
rishikeshgirls.in- Rishikesh call girl.pdf
rishikeshgirls.in- Rishikesh call girl.pdfrishikeshgirls.in- Rishikesh call girl.pdf
rishikeshgirls.in- Rishikesh call girl.pdfmuskan1121w
 
Call Girls in Gomti Nagar - 7388211116 - With room Service
Call Girls in Gomti Nagar - 7388211116  - With room ServiceCall Girls in Gomti Nagar - 7388211116  - With room Service
Call Girls in Gomti Nagar - 7388211116 - With room Servicediscovermytutordmt
 
Vip Female Escorts Noida 9711199171 Greater Noida Escorts Service
Vip Female Escorts Noida 9711199171 Greater Noida Escorts ServiceVip Female Escorts Noida 9711199171 Greater Noida Escorts Service
Vip Female Escorts Noida 9711199171 Greater Noida Escorts Serviceankitnayak356677
 
Catalogue ONG NUOC PPR DE NHAT .pdf
Catalogue ONG NUOC PPR DE NHAT      .pdfCatalogue ONG NUOC PPR DE NHAT      .pdf
Catalogue ONG NUOC PPR DE NHAT .pdfOrient Homes
 
7.pdf This presentation captures many uses and the significance of the number...
7.pdf This presentation captures many uses and the significance of the number...7.pdf This presentation captures many uses and the significance of the number...
7.pdf This presentation captures many uses and the significance of the number...Paul Menig
 
Russian Faridabad Call Girls(Badarpur) : ☎ 8168257667, @4999
Russian Faridabad Call Girls(Badarpur) : ☎ 8168257667, @4999Russian Faridabad Call Girls(Badarpur) : ☎ 8168257667, @4999
Russian Faridabad Call Girls(Badarpur) : ☎ 8168257667, @4999Tina Ji
 
/:Call Girls In Jaypee Siddharth - 5 Star Hotel New Delhi ➥9990211544 Top Esc...
/:Call Girls In Jaypee Siddharth - 5 Star Hotel New Delhi ➥9990211544 Top Esc.../:Call Girls In Jaypee Siddharth - 5 Star Hotel New Delhi ➥9990211544 Top Esc...
/:Call Girls In Jaypee Siddharth - 5 Star Hotel New Delhi ➥9990211544 Top Esc...lizamodels9
 
Insurers' journeys to build a mastery in the IoT usage
Insurers' journeys to build a mastery in the IoT usageInsurers' journeys to build a mastery in the IoT usage
Insurers' journeys to build a mastery in the IoT usageMatteo Carbone
 
Cash Payment 9602870969 Escort Service in Udaipur Call Girls
Cash Payment 9602870969 Escort Service in Udaipur Call GirlsCash Payment 9602870969 Escort Service in Udaipur Call Girls
Cash Payment 9602870969 Escort Service in Udaipur Call GirlsApsara Of India
 
Lucknow 💋 Escorts in Lucknow - 450+ Call Girl Cash Payment 8923113531 Neha Th...
Lucknow 💋 Escorts in Lucknow - 450+ Call Girl Cash Payment 8923113531 Neha Th...Lucknow 💋 Escorts in Lucknow - 450+ Call Girl Cash Payment 8923113531 Neha Th...
Lucknow 💋 Escorts in Lucknow - 450+ Call Girl Cash Payment 8923113531 Neha Th...anilsa9823
 
Call Girls Navi Mumbai Just Call 9907093804 Top Class Call Girl Service Avail...
Call Girls Navi Mumbai Just Call 9907093804 Top Class Call Girl Service Avail...Call Girls Navi Mumbai Just Call 9907093804 Top Class Call Girl Service Avail...
Call Girls Navi Mumbai Just Call 9907093804 Top Class Call Girl Service Avail...Dipal Arora
 
Call Girls Pune Just Call 9907093804 Top Class Call Girl Service Available
Call Girls Pune Just Call 9907093804 Top Class Call Girl Service AvailableCall Girls Pune Just Call 9907093804 Top Class Call Girl Service Available
Call Girls Pune Just Call 9907093804 Top Class Call Girl Service AvailableDipal Arora
 
Vip Dewas Call Girls #9907093804 Contact Number Escorts Service Dewas
Vip Dewas Call Girls #9907093804 Contact Number Escorts Service DewasVip Dewas Call Girls #9907093804 Contact Number Escorts Service Dewas
Vip Dewas Call Girls #9907093804 Contact Number Escorts Service Dewasmakika9823
 
VIP Kolkata Call Girl Howrah 👉 8250192130 Available With Room
VIP Kolkata Call Girl Howrah 👉 8250192130  Available With RoomVIP Kolkata Call Girl Howrah 👉 8250192130  Available With Room
VIP Kolkata Call Girl Howrah 👉 8250192130 Available With Roomdivyansh0kumar0
 
2024 Numerator Consumer Study of Cannabis Usage
2024 Numerator Consumer Study of Cannabis Usage2024 Numerator Consumer Study of Cannabis Usage
2024 Numerator Consumer Study of Cannabis UsageNeil Kimberley
 
RE Capital's Visionary Leadership under Newman Leech
RE Capital's Visionary Leadership under Newman LeechRE Capital's Visionary Leadership under Newman Leech
RE Capital's Visionary Leadership under Newman LeechNewman George Leech
 
A DAY IN THE LIFE OF A SALESMAN / WOMAN
A DAY IN THE LIFE OF A  SALESMAN / WOMANA DAY IN THE LIFE OF A  SALESMAN / WOMAN
A DAY IN THE LIFE OF A SALESMAN / WOMANIlamathiKannappan
 

Recently uploaded (20)

Keppel Ltd. 1Q 2024 Business Update Presentation Slides
Keppel Ltd. 1Q 2024 Business Update  Presentation SlidesKeppel Ltd. 1Q 2024 Business Update  Presentation Slides
Keppel Ltd. 1Q 2024 Business Update Presentation Slides
 
Regression analysis: Simple Linear Regression Multiple Linear Regression
Regression analysis:  Simple Linear Regression Multiple Linear RegressionRegression analysis:  Simple Linear Regression Multiple Linear Regression
Regression analysis: Simple Linear Regression Multiple Linear Regression
 
rishikeshgirls.in- Rishikesh call girl.pdf
rishikeshgirls.in- Rishikesh call girl.pdfrishikeshgirls.in- Rishikesh call girl.pdf
rishikeshgirls.in- Rishikesh call girl.pdf
 
Call Girls in Gomti Nagar - 7388211116 - With room Service
Call Girls in Gomti Nagar - 7388211116  - With room ServiceCall Girls in Gomti Nagar - 7388211116  - With room Service
Call Girls in Gomti Nagar - 7388211116 - With room Service
 
Best Practices for Implementing an External Recruiting Partnership
Best Practices for Implementing an External Recruiting PartnershipBest Practices for Implementing an External Recruiting Partnership
Best Practices for Implementing an External Recruiting Partnership
 
Vip Female Escorts Noida 9711199171 Greater Noida Escorts Service
Vip Female Escorts Noida 9711199171 Greater Noida Escorts ServiceVip Female Escorts Noida 9711199171 Greater Noida Escorts Service
Vip Female Escorts Noida 9711199171 Greater Noida Escorts Service
 
Catalogue ONG NUOC PPR DE NHAT .pdf
Catalogue ONG NUOC PPR DE NHAT      .pdfCatalogue ONG NUOC PPR DE NHAT      .pdf
Catalogue ONG NUOC PPR DE NHAT .pdf
 
7.pdf This presentation captures many uses and the significance of the number...
7.pdf This presentation captures many uses and the significance of the number...7.pdf This presentation captures many uses and the significance of the number...
7.pdf This presentation captures many uses and the significance of the number...
 
Russian Faridabad Call Girls(Badarpur) : ☎ 8168257667, @4999
Russian Faridabad Call Girls(Badarpur) : ☎ 8168257667, @4999Russian Faridabad Call Girls(Badarpur) : ☎ 8168257667, @4999
Russian Faridabad Call Girls(Badarpur) : ☎ 8168257667, @4999
 
/:Call Girls In Jaypee Siddharth - 5 Star Hotel New Delhi ➥9990211544 Top Esc...
/:Call Girls In Jaypee Siddharth - 5 Star Hotel New Delhi ➥9990211544 Top Esc.../:Call Girls In Jaypee Siddharth - 5 Star Hotel New Delhi ➥9990211544 Top Esc...
/:Call Girls In Jaypee Siddharth - 5 Star Hotel New Delhi ➥9990211544 Top Esc...
 
Insurers' journeys to build a mastery in the IoT usage
Insurers' journeys to build a mastery in the IoT usageInsurers' journeys to build a mastery in the IoT usage
Insurers' journeys to build a mastery in the IoT usage
 
Cash Payment 9602870969 Escort Service in Udaipur Call Girls
Cash Payment 9602870969 Escort Service in Udaipur Call GirlsCash Payment 9602870969 Escort Service in Udaipur Call Girls
Cash Payment 9602870969 Escort Service in Udaipur Call Girls
 
Lucknow 💋 Escorts in Lucknow - 450+ Call Girl Cash Payment 8923113531 Neha Th...
Lucknow 💋 Escorts in Lucknow - 450+ Call Girl Cash Payment 8923113531 Neha Th...Lucknow 💋 Escorts in Lucknow - 450+ Call Girl Cash Payment 8923113531 Neha Th...
Lucknow 💋 Escorts in Lucknow - 450+ Call Girl Cash Payment 8923113531 Neha Th...
 
Call Girls Navi Mumbai Just Call 9907093804 Top Class Call Girl Service Avail...
Call Girls Navi Mumbai Just Call 9907093804 Top Class Call Girl Service Avail...Call Girls Navi Mumbai Just Call 9907093804 Top Class Call Girl Service Avail...
Call Girls Navi Mumbai Just Call 9907093804 Top Class Call Girl Service Avail...
 
Call Girls Pune Just Call 9907093804 Top Class Call Girl Service Available
Call Girls Pune Just Call 9907093804 Top Class Call Girl Service AvailableCall Girls Pune Just Call 9907093804 Top Class Call Girl Service Available
Call Girls Pune Just Call 9907093804 Top Class Call Girl Service Available
 
Vip Dewas Call Girls #9907093804 Contact Number Escorts Service Dewas
Vip Dewas Call Girls #9907093804 Contact Number Escorts Service DewasVip Dewas Call Girls #9907093804 Contact Number Escorts Service Dewas
Vip Dewas Call Girls #9907093804 Contact Number Escorts Service Dewas
 
VIP Kolkata Call Girl Howrah 👉 8250192130 Available With Room
VIP Kolkata Call Girl Howrah 👉 8250192130  Available With RoomVIP Kolkata Call Girl Howrah 👉 8250192130  Available With Room
VIP Kolkata Call Girl Howrah 👉 8250192130 Available With Room
 
2024 Numerator Consumer Study of Cannabis Usage
2024 Numerator Consumer Study of Cannabis Usage2024 Numerator Consumer Study of Cannabis Usage
2024 Numerator Consumer Study of Cannabis Usage
 
RE Capital's Visionary Leadership under Newman Leech
RE Capital's Visionary Leadership under Newman LeechRE Capital's Visionary Leadership under Newman Leech
RE Capital's Visionary Leadership under Newman Leech
 
A DAY IN THE LIFE OF A SALESMAN / WOMAN
A DAY IN THE LIFE OF A  SALESMAN / WOMANA DAY IN THE LIFE OF A  SALESMAN / WOMAN
A DAY IN THE LIFE OF A SALESMAN / WOMAN
 

PSMJ's 2015 A/E/C Market Outlook

  • 1. How do the A/E/C Markets Look in 2016 and Beyond? By David Burstein, P.E. PSMJ Resources, Inc. PSMJ’s A/E/C Market Outlook
  • 2. INTRODUCTION Every year PSMJ does a forecast of the various architecture, engineering, and construction (A/E/C) markets. This year, we present PSMJ’s A/E/C Market Outlook: How do the A/E/C Markets Look in 2016 and Beyond? This report covers A/E/C industry and market trends for 2015 and 2016. We begin by looking at trends in the overall economy–especially those trend that affect A/E/C firms. Next, we detail what is happening specifically in the A/E/C industry right now. Then we present our outlook for next year and beyond—what we think is going to happen in the various market sectors. We look at which markets are up and which markets are down. And finally, we conclude with recommendations on what A/E/C firms should to do to be successful in 2016 and beyond. We hope that you find this report helpful in your planning for 2016. For more information and additional resources, please contact us at 617-965-0055 or www.psmj.com. 2
  • 3. I. Trends in the overall economy 4 II. What’s happening to the A/E/C industry now? 11 III. Which markets will be up and which will be down? 22 IV. What should you do? 43 Copyright ©2015 by PSMJ Resources, Inc.® All rights reserved. No part of this publication may be reproduced or transmitted in any form or by any means, electronic or mechanical, including photocopying and recording, or by any information storage or retrieval system without the prior written permission of the publisher. PSMJ Resources Inc.’s material is protected by copyright. It is illegal under Federal law to make copies or faxes of the publication without permission—even for internal use. Violators risk criminal penalties and damages up to $100,000 per offense. PSMJ Resources, Inc. will pay a reward of up to $1,000 for actionable evidence of illegal copying or faxing. PSMJ Resources, Inc.® P.O. Box 95190 Nonantum, MA 02495 Phone: 617-965-0055 Fax: 617-965-5152 Email: customerservice@psmj.com www.psmj.com CONTENTS 3
  • 4. If you listen to all of the candidates in the various states, there is a lot of anger about our economy. The way that they talk, you’d think we are going down the tubes. However, the data doesn’t actually support that view. I. Trends in the Overall Economy 4 There’s a lot of anger about our economy Let’s start with trends in the overall economy, especially those the affect the A/E/C industry.
  • 5. If you look at 2015 GDP, North America has some of highest growth rates in the world. The only areas that have higher growth rates are China, Sub- Saharan Africa, and Middle East/North Africa. They are so high, because they have a lot of catching up to do. If you look at the US and Canada, we have the highest growth rates in the industrialized world. . Also, we are seeing a substantial decrease in jobless claims. This is the real harbinger of what’s going to happen to the overall economy. The most recent number of jobless claims (in Sept. 2015) is actually the lowest it has been since the U.S began to gather this information back in the 1960s. Fewer people are applying for unemployment insurance than have ever applied since it began. 5
  • 6. The reason it is not disastrous is very interesting. What you find is that spending has actually been quite flat. What you see here is that since the end of the recession, there has been virtually no increase in federal spending, while there has been a big increase in revenue from tax collection as the economy improves. Most of the reduction in the deficit, which has gone from 10% to 2.5%, is due to spending cuts as a result of the sequester. 6 There is also the perception that the country’s debt and deficit is completely out of control. Our debt is too high, but in terms of the actual deficit—how much we are over-spending as a share of gross domestic product—is actually pretty reasonable. In fact, what we see now is that our deficit of 2.5% of GDP is actually below the average deficit the U.S. has had since 1975. It’s still a bit too high in my view, but a long way from disastrous.
  • 7. Federal expenditure as a percentage of GDP has declined. When you look at current federal expenditure versus GDP, you can also see that in relative terms, expenditures have actually declined from over 25% of GDP to a little over 22%. So since the recession, the federal government has been cutting back. 7 Also household debt has leveled off a positive impact. If you look at household debt since the recession, you can see that household liabilities have leveled off to about $14 trillion. On the other hand, household assets since the beginning of the recession have gone from $80 to $100 trillion. And so, the ratio of assets to liabilities has never been as favorable as it is now.
  • 8. But we have relatively little exposure. The good news for us is that we really are not affected. A few months ago, there was a big scare about the drop in Chinese imports, and what effect that would have on the world economy. Certainly, in some countries, it has had a huge effect. The GDP in Asian countries especially, is reliant on Chinese exports. Only 0.8% of the GDP in North America is from Chinese exports. So the scare and stock market plunge was a severe overreaction, and we have recovered since then. 8 Import demand in China is slowing down. Everyone seems to be worried about China taking over the U.S., but if you look at this graph (left), there is a substantial slowing down going on. What’s keeping China’s growth up is the financial sector. When it comes to construction and industrial activity, both are declining. Both are down to below 5%. So we see a steep reduction in Chinese demand for imports.
  • 9. But it is not going happen right away. The most reliable predictor of future recessions is what economists call the “yield curve.” The signal that it shows now is not at all like it looked when the country was going into recession, as indicated by the deep red circles. 9 We will have another recession. Will there be another recession? Absolutely! Recessions come and go. When you are in one, it feels like it will last forever, and it never does. When you are in an expansion, that feels like it will last forever, and it never does. We are 74 months since the last recession, and that is just a little above the median duration of recessions since 1960. So we are due for another recession.
  • 10. A tighter labor market. The biggest problem we see in today’s economy is that the labor market is tighter. You can see in this survey by the National Federation of Independent Businesses, that the percentage of small businesses reporting few or no qualified applicants for job openings is approaching 50%. This is higher than it was before the recession. 10 Most sunny with a few clouds. Basically, we find that in 2016, we’ll have pretty good economy! So our prediction for the U.S. Economy in 2016 is: The biggest problem in today’s economy is:
  • 11. II. What’s Happening in the A/E/C Industry Now? 11 To start, we look at financial trends in the A/E/C industry now, as reported in PSMJ’s 2015 Financial Performance Benchmark Survey Report.
  • 12. Revenue also continues to grow. Based on our 2015 Financial Performance Benchmark Survey Report, we can see that revenues are also increasing. In fact, in the past year, revenues increased to a high of about 10% for the median A/E firm . Firm staff continues to grow. Based on our 2015 Financial Performance Benchmark Survey Report, we can see that firm staff has been growing over the past few years. In fact, in this past year, we had a median staff growth rate of almost 4%. The big drops in staff seen in previous years have definitely turned around. 12
  • 13. Group insurance costs have leveled off. Interestingly, if you look at group insurance costs per employee (which is another big overhead factor), you can see that it increased pretty steadily from the 1980s to the 1990s, but then accelerated from 2000 through 2009. But since then, group insurance costs per employee have actually leveled off. And so, we are not seeing the same kind of inflationary pressure on firms. This does not include how much employees are spending, and is just the firm portion. But you can see that it’s leveled out, and will stay level for a while. Utilization continues on a downward trend. We can see that labor utilization has been on a long-term down- ward trend, beginning in the 1990s. A couple of things are happening: One is automation: As CAD came about in the 1990s, fewer drafters were spending 40 hours a week, week after week, on projects. More and more of that work was done by CAD systems, so the number of labor hours charged declined. Another overhead factor has crept in: information technology. Now most firms not only have a IT director, but they have a full IT department. And IT staff is not chargeable. So that’s the biggest reason for the decline in utilization. And with BIM coming into play, we expect to see that continued downward trend. 13
  • 14. A comparison of target multiplier vs. break- even multiplier is revealing. Here, you can see that, for many years, the target multiplier (green line) for the A/E industry has stayed at a median of 3.0. It went up a little bit, but has settled at 3.1. The break-even multiplier (red dashed line) is the overhead rate plus one, and so you can see that it has been on the same upward trend. We haven’t been seeing the increases in the target multiplier nearly to the extent that we have seen increases in the break-even multiplier. Overhead rates are creeping back up. Because overhead rates are tied very closely to labor utilization, the long-term decline in utilization is manifesting itself as a long-term increase in overhead rates. Again, because of automation, and as health insurance rates start to go up, we expect to see a continuation of the increase in overhead rates. 14
  • 15. That means that target margins have shrunk. If you go all the way back to 1978, when PSMJ first started doing these surveys, what you find is that difference between the target multiplier and the break-even multiplier. So for every dollar of labor, there was $1.25 of overhead, and $.75 in targeted profit. Today, for every dollar of labor, there is $1.61 of overhead, and only $.49 in targeted profit. Although target multiplier is higher, target profit is lower. Overhead rate has gone up faster than the target multiplier. However, that has been offset by another factor: If you look at the achieved multiplier compared to the target multiplier, the gap, which we call net revenue deficit, has gotten smaller as firms have gotten better at managing their projects. That gap is now almost closed. That means that, as an industry, we are doing a better job of achieving the target multipliers we set out to get. Meanwhile, net payroll multiplier has been on the rise. If we look at net payroll multiplier (also known as revenue factor, which is utilization x multiplier or could be calculated as net revenue divided by total revenue), you can see that we bottomed out during the recession, but have been gradually increasing to 1.80 in 2015. Not quite up to peak levels, but we’re doing better. 15
  • 16. Profitability is nearing pre-recession levels. And if you look at profitability, it follows a very similar path. Profitability is very highly correlated with revenue factor, and you can see it is coming back to historical levels. When we get this year’s financial performance results, I am personally expecting that profitability will be at or above what it was industry-wide pre-recession. Return on equity is also increasing. When we look at return on equity, which is profit for each dollar of shareholders’ equity, we can see that it is also returning close to pre-recession levels, almost 20%. 16
  • 17. 17 PSMJ Survey  PSMJ conducts quarterly market surveys as a free service to the industry.  Input is restricted to A/E firms.  200-500 people respond to these surveys.  We use this data to chart trends using a “Plus/Minus Index”. PSMJ’s Quarterly Market Surveys Next, we look at financial trends in the A/E/C industry as reported in PSMJ’s Quarterly Market Surveys.
  • 18. 18 How We Compute the “Plus/Minus Index” Sample Question: Are revenues in the transportation sector increasing or decreasing compared to last quarter? Sample Calculation: Total firms reporting = 185 Firms reporting an increase = 60 firms x 1 points = +60 Firms reporting no change = 80 firms x 0 points = 0 Firms reporting a decrease = 45 firms x -1 points = -45 Total “points” = +15 Index = 15 ÷ 185 = +8%
  • 19. 21 consecutive quarters of increasing A/E firm revenues… If we look at revenue, what we see is that there has been 21 consecutive quarters where more A/E firms are seeing increases in revenues rather than decreases. …Have resulted in more backlog Ongoing increases in revenue have resulted in more firms seeing increases in backlog. …Creating optimism about the future Increased backlog has created optimism about the future, because firms are continuing to project increases in revenue. 19
  • 20. When Planning Your Firm’s Strategy… “Don’t skate to where the puck is. Skate to where it’s going to be.” -- Wayne Gretzky In other words: Look at where things are going to be in the future, and plan your strategy to that, rather than to where things are today.
  • 21. We find that most predictions are wrong for two reasons: People tend to look at lagging indicators. Lagging indicators are things that tell you what’s happening today or yesterday, in some cases. You should be looking at leading indicators, things that can tell you what’s happening tomorrow. They extrapolate the past into the future. Just because there is a trend in the past, you cannot extrapolate it into the future, because it does not necessarily happen the way it was projected.
  • 22. Instead, we look at two things: We look at leading indicators and we look for turning points - where the trends of the past has changed and gone in a different direction. Turning Points
  • 23. A/E proposal opportunities are the most leading indicator. We find that the top leading indicator for A/E firms is proposal opportunities. When firms see more proposal opportunities that means that eventually A/E firms will win more projects. This will increase their backlog, and then increase their revenue. More proposal opportunities will also increase the cash flow for A/E firms, and ultimately revenues and cash flow for construction firms. 23
  • 24. 24 A/E proposal opportunities continue their upward trend When we look at proposal opportunities over the past quarters (and we started doing this in 2003, so there is a lot of data to look at), we see a continued increase in the optimism of firm, and how they see proposal opportunities. In fact, what you see is that proposal opportunities are on an upward slope. Not only are firms optimistic, but they seem to be increasingly optimistic, based on the number of proposal opportunities they’re reporting. All regions are showing substantial increases If you look at proposal trends regionally, there are very strong results in all the regions. Canada is the weakest region (33%), but even in Canada, things are very positive.
  • 25. Now, we will look at what markets are up and which markets are down. III. Which A/E Markets Are… 25 Let’s Look Closer at A/E Proposal Activity Following is an outline of proposal activity in all major markets overall and by region. We also look at which submarkets are up or down. All data was gathered in PSMJ’s Quarterly Market Surveys.
  • 26. Energy/Utilities Submarkets Renewable energy Power plants Utility distribution Telecom/cable Pipelines In All Regions 26 Energy/Utilities Market Remains Strong
  • 27. Especially in Canada 27 The Heavy Industry Market is Slowing
  • 28. In All Regions Light Industry Looks Better 28
  • 29. Industrial Submarkets 29 Mining and resource extraction (including oil) Primary materials manufacturing Petroleum facilities Pharmaceutical manufacturing Chemical plants Component assembly (including telecom) Warehouse/distribution facilities Repair/service facilities
  • 30. In All Regions 30 The Housing Market is Very Strong Other Housing Submarkets Condominiums Multi-family housing (apartments) Single family homes Senior and assisted living
  • 31. In All Regions 31 The Commercial Markets Have Fully Recovered Commercial Submarkets Office Buildings Retail Buildings (for lease) Warehouse & Distribution Facilities Restaurants Hotels/motels Retail Buildings Call Centers & Data Facilities
  • 32. All Regions Are Still Strong 32 Environmental Markets May be Slowing Environmental Submarkets Waste disposal (landfills, etc.) Wetlands delineation Site characterization Site cleanup Environmental permitting Resource management Air pollution
  • 33. In All Regions 33 The Healthcare Market Remains Strong Healthcare Submarkets Hospitals Medical offices Continuing care facilities Medical laboratories
  • 34. There is another factor involved: If you go back to 2007, you can see that the average firm that specialized in the healthcare market had about 8% higher profitability than the average A/E firm overall. Fast forward to 2014-2015, profits for firms that specialize in the healthcare market are less profitable than the average firm overall. This indicates that, although the market is strong, the number of firms going into the market is growing faster than the market itself is growing. But the profit premium for healthcare firms is gone. 34
  • 35. The recession hit the public sector hard If you look at the effect of recessions on the public sector market, what you see is that this recession has had the biggest effect on the public sector. The number of public sector payroll jobs has dropped lower than any other recession, and it is slower to pick up. So you know that, if public sector agencies are cutting their own payrolls, they are in trouble. And probably won’t be giving out work. But government finances have Improved. However, government finances have improved on the federal level. You can see that the budget deficit has gone from 10% to 2.5% of GDP. Recovery has begun. If you look at employment in local government in utilities, you can see it has been recovering since then– even though it took a big hit from 2009 to 2013. In the Public Sector 35
  • 36. Every U.S. Region is Moderately Strong 36 The Transportation Market is Improving Transportation Submarkets Transportation planning Roads Airports Bridges Traffic Rail
  • 37. All Regions are Strong 37 The Education Market is Growing Education Submarkets K-12 Laboratories Support facilities (gyms, dorms, libraries, etc.) Higher education
  • 38. All Regions are Strong 38 Water/Wastewater Continues Strong Water/Wastewater Submarkets Water supply Water distribution Water treatment Wastewater collection Wastewater treatment Wastewater reuse
  • 39. Except in Canada 39 Other Government Buildings Are (Finally) Beginning to Recover Other Government Buildings Submarkets Public Safety Public Recreation Justice Facilities Sports Facilities
  • 40. Summary of Proposal Plus/Minus Index Housing Commercial Users Commercial Developer Light Industrial Heavy Industrial Energy & Utilities Water/Wastewater Environmental Education Transportation Other Gov’t. Buildings Health Care 0-20-40-60-80 +20 +40 +60 +80 +100-100 0-20-40-60-80 +20 +40 +60 +80 +100-100 40
  • 41. The Hottest Submarkets If you look at the submarkets, the hottest right now is continuing care facilities, followed closely by retirement/assisted-living facilities. As the population ages, there is a lot of demand in those markets. 41
  • 42. Profitability is also important. You need to get an idea not only of how good market sectors are from a revenue standpoint, but also of how profitable each market sector is—in comparison to the median profitability in the A/E industry overall. In the chart below, we have gone back five years, looking at markets where firms are less profitable (red), where firms are somewhat less profitable (pink), where firms are somewhat more profitable (light green), and where firms are significantly more profitable (dark green). 42
  • 43. To winning the war for talent 43 IV. So What Should Our Firm Do? We believe you need to move your focus: From winning the war for clients
  • 44. Reason #1: Firms Are Growing Again, Increasing the Demand for Talent Source: U.S. Department of Labor Employment in U.S. A/E Industry As you can see in the chart below, we reached a peak of 1,450,000 employees in the A/E industry before the recession. We are coming pretty close to reaching that peak right now. 44
  • 45. Reason #2: The Long-term Decline in Employee Turnover… If you go all the way back to 1985… Do a little regression, and you can see that the average employee turnover has declined from about 40% a year to about 12% a year in 2015. It looks like there has been a huge decline in turnover. 45 If you look at it a bit differently… Based on a three-year moving average, what you find is that the trend in turnover decline has reversed. There is a turning point in recent years, where we see employee turnover is going up. That creates additional demand for people. …May Be Coming to an End
  • 46. Reason #3 – Boomers Are Beginning to Retire Back in 1900, only 6.2% of the population was over 65. By 2000, that was up to 16%, and by 2050, it will be almost a quarter of the population (23.8%). 46
  • 47. Reason #4: There Are Big Gaps in Supply Source: American Society for Engineering Education Civil engineering as an example: You can see that if you are looking for a civil engineer, with about 10-15 years of experience, they are just not out there because few graduated in 2001-2005, for example. There is an upswing in people getting degrees but a big gap in experienced people. Architecture is not as extreme. However, there is definitely a big gap in people with about 10-15 years of experience. They are not out there because fewer graduated in 1996-2001. And architecture degrees have actually been declining recent years. 47
  • 48. Are we attracting the best and brightest new grads? Sources: 2014 Salary Survey, National Association of Colleges and Employers 2014 PSMJ Staff Salary Survey Another thing you need to consider is that you are not just competing for graduates with other A/E firms. You are competing with all kinds of industries. Here, we look at two sets of data: The blue bar is data from the National Association of Colleges and Employers. All of their median starting salaries are higher than the top 25% A/E firms. Even the top quartile of A/E firms are paying less than the median for all employers. 48 Experienced Professionals (who are retiring) with New Grads, (of which there are a surplus) Reason #5: You Can’t Simply Replace…
  • 49. 49 What happens if you raise salaries while holding prices steady? The answer is that your profit margins, which are thin enough right now, will become even thinner. And if you raise salaries a lot, they will fall into the negative. That’s really not a solution. How many of you have… • Raised your prices in the past 2 years? – A number have raised their hand and said yes. • Regretted doing so because you lost too much work? – Of all of those firms that raised their prices, only two said they lost business. Raise your fees and offer higher salaries to attract the best and brightest! For all these reasons you need to look to winning the war for talent. I have asked this question of many firms: So the conclusion is:
  • 50. ABOUT PSMJ Over 40 years of helping A/E/C firms achieve business success. PSMJ Resources, Inc. is the world’s leading authority, publisher, and consultant on the effective management of architecture, engineering, and construction firms. With offices in the United States as well as the United Kingdom and Australia, PSMJ offers over 150 titles in book, audio, and video format. In addition, the company publishes several monthly periodicals and delivers dozens of seminars, roundtables, conferences, webinars, and in-house training sessions every year for A/E/C professionals around the world. PSMJ’s sought-after consulting expertise covers a range of critical business areas such as strategic planning, project management, valuation, succession planning, and mergers & acquisitions. PSMJ is also active within the community, utilizing our resources and the contacts at our fingertips within the A/E/C Industry to help those in need.