Downloaded 21 times


![THANK YOU
Web page: http://sri.ciifad.cornell.edu/
Email: ntu1@cornell.edu [NTU-one]](https://image.slidesharecdn.com/1445-phenotypicexpressionofricegenotypes-150331141729-conversion-gate01/85/1445-Improving-the-Phenotypic-Expression-of-Rice-Genotypes-Reasons-to-Rethink-Selection-Practices-and-Intensification-for-Rice-Production-Systems-39-320.jpg)
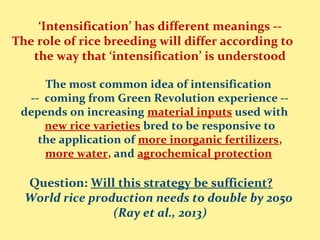
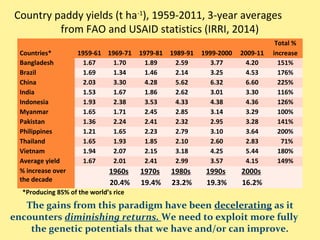
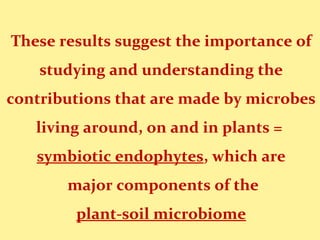
The document discusses the need to rethink rice selection practices and intensification to improve rice production systems, emphasizing that traditional methods relying on increased material inputs are becoming unsustainable. It highlights the System of Rice Intensification (SRI) as a more effective alternative that focuses on knowledge, management, and genetic potentials, resulting in higher yields with lower resources. The findings suggest that improved phenotypic expression through innovative management leads to more resilient rice plants and better adaptation to climate change.