Download as PDF, PPTX
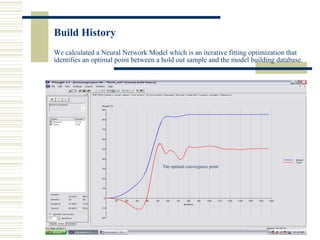


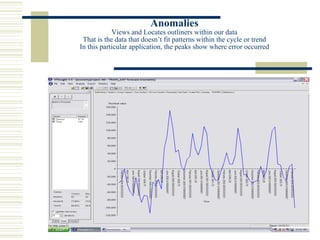


This document discusses the build history of a neural network model that identifies an optimal point between a hold out sample and model building database. It also examines time series data broken into trend and cyclical components, noting that peaks are generally underestimated. Additionally, it determines the impacts of different factors on data, how a target is affected by changing one factor, and what happens when two factors are changed simultaneously.