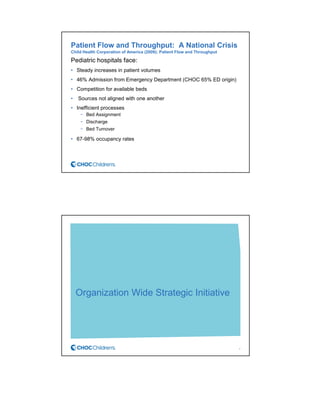
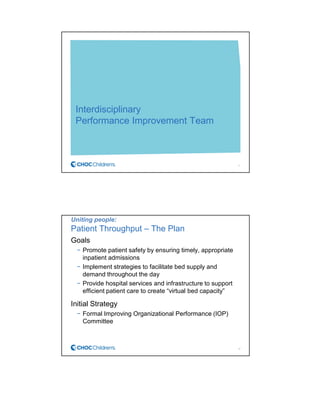
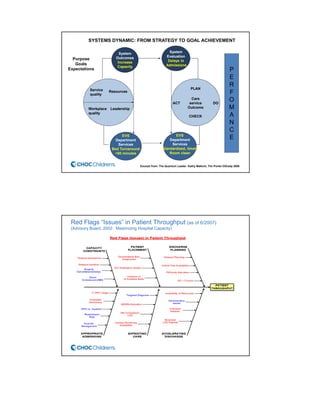
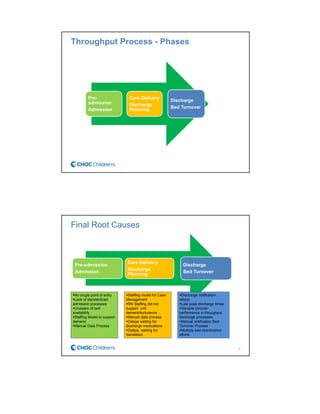
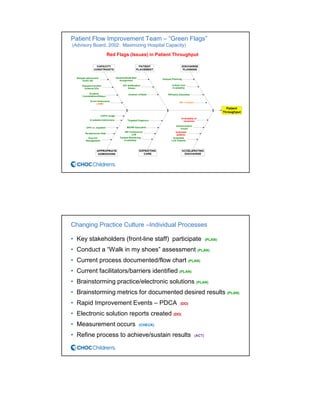
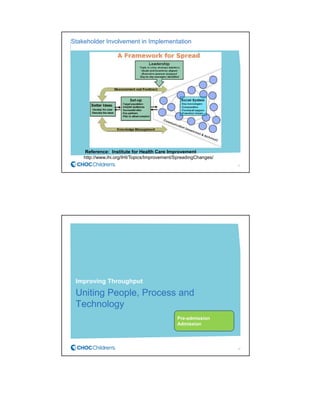
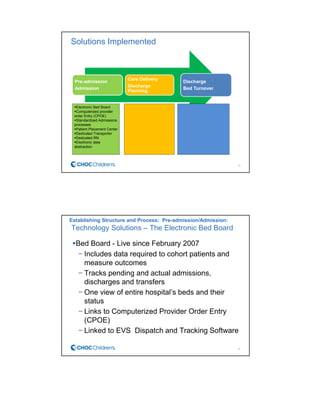
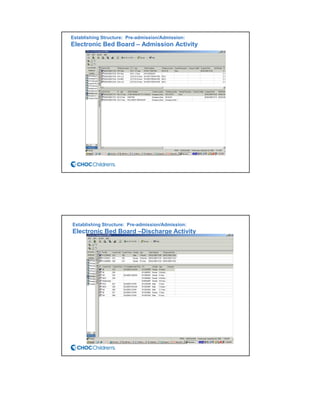
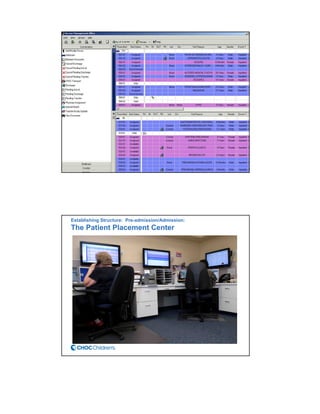
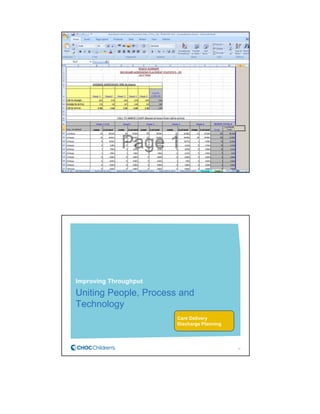
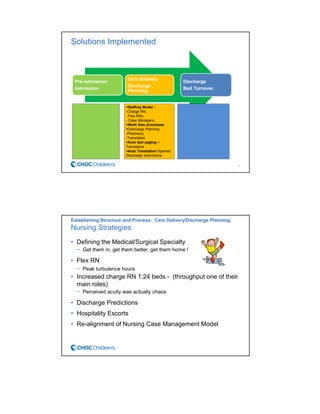
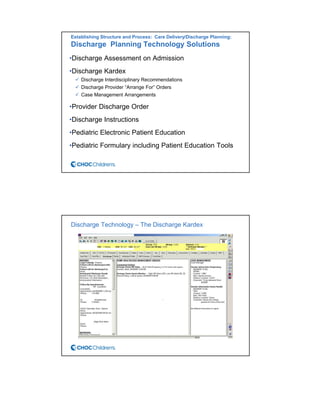
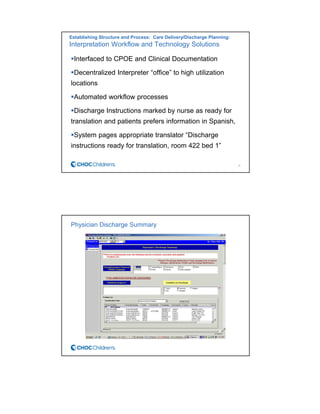
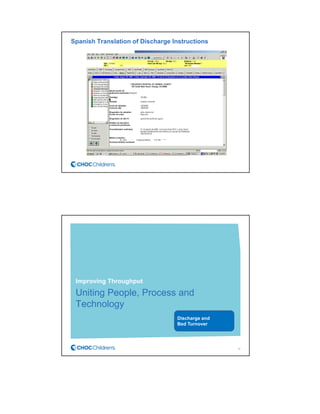
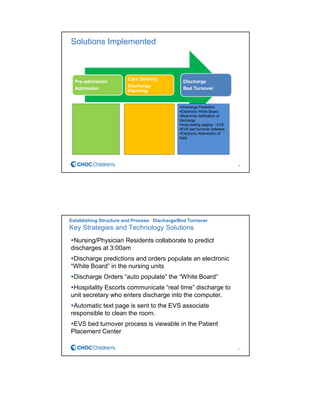
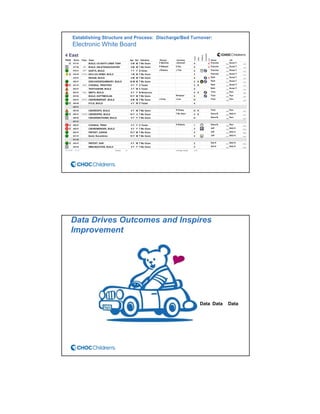
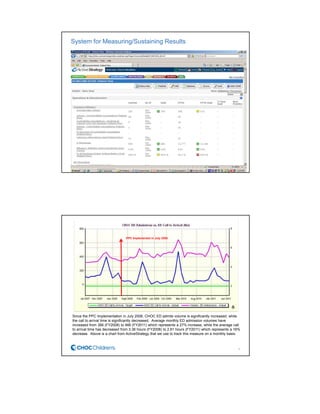
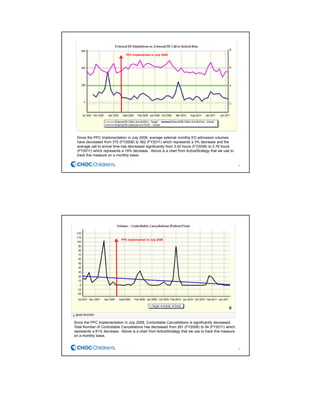
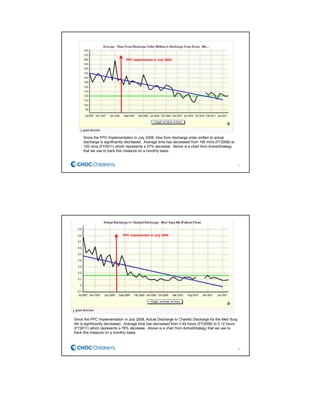
Improving a Mission-Critical Cross-Functional
Measure
THE ACTIVESTRATEGY CONFERENCE
APRIL, 2012
CHERYLCHERYLCHERYLCHERYL MISSILDINEMISSILDINEMISSILDINEMISSILDINE, MSN, RN, NEA, MSN, RN, NEA, MSN, RN, NEA, MSN, RN, NEA----BCBCBCBC
CHOC CHILDREN’S HOSPITAL
ORANGE, CA
Session Objectives
The attendee will:
• Describe how the alignment of strategic initiatives drives
process and practice changes to sustain results.
• Describe how systems theory was utilized to redesign the
care delivery models to improve patient throughput
structure, processes and outcomes.
• Discuss the use of technology to embed structure and
process in support of patient throughput practices.
• Explain how technology was designed to abstract
evidenced-based performance improvement metrics and
systematically disseminate information across the
organization.
CHOC Children’s Hospital(Orange, California)
FY 2011 – Hospital Statistics
• 238 Inpatient Beds
• ED Visits 54,553
• 11,811 Admissions
• 5.0 Average LOS
• 81,713 Primary Clinic Visits
• 86,035 Specialty Clinic Visits
• 4,001 Transports
3
CHOC Children’s Hospital - Mission
Patient Flow and Throughput: A National Crisis
Child Health Corporation of America (2009); Patient Flow and Throughput
Pediatric hospitals face:
• Steady increases in patient volumes
• 46% Admission from Emergency Department (CHOC 65% ED origin)
• Competition for available beds
• Sources not aligned with one another
• Inefficient processes
− Bed Assignment
− Discharge
− Bed Turnover
• 67-98% occupancy rates
Organization Wide Strategic Initiative
6
Data Used to Select the Project
• Executive Management Team and the Quality Oversight
Committee, Joint Leadership Committee (JLC) received the
following concerning data:
− ED Data demonstrated lower volumes and longer wait times for
pediatric vs. adult patients.
− Admission demands peaked prior to patients discharge times resulting
in delays
− Admissions cancellations occurred related to capacity
− Hospital occupancy (73%) was in the lower quartile compared to
other pediatric hospitals in a collaborative comparison group
7
Identified Potential Stakeholders
• External Stakeholders
− Patients/Families
− Community MDs
− Referring Community/Regional
Hospitals
− Clinics
− ED Physicians
− Hospitalists/Surgeons
• Internal Stakeholders
− Admitting Department
− Medical Residents
− Nursing Supervisors
− Transport Team
− Nursing Units
− Case Managers
− Pharmacy
− Interpreters/Translators
− Environmental Services
− Quality
− Informaticist (Technological
Support)
8
Organizational Goals and Mission
• CHOC Children’s Strategic Goals with Metrics
− Operations and Infrastructure (High Impact)
▪ Admission Volumes/Average wait time
▪ Time from order to discharge
▪ Bed turnaround time
− Clinical Quality, Safety, and Service (High Impact)
▪ Emergency Department Scorecard
− Growth and Development (High Impact)
▪ Average daily census
− Financial Stewardship (Medium Impact)
▪ Increased admissions, enhanced efficiencies, and decrease
cancellations
− Partnerships and Affiliations (Medium Impact)
▪ Successful affiliations
10
Interdisciplinary
Performance Improvement Team
11
Uniting people:
Patient Throughput – The Plan
Goals
− Promote patient safety by ensuring timely, appropriate
inpatient admissions
− Implement strategies to facilitate bed supply and
demand throughout the day
− Provide hospital services and infrastructure to support
efficient patient care to create “virtual bed capacity”
Initial Strategy
− Formal Improving Organizational Performance (IOP)
Committee
12
The Patient Flow Improvement Team
Interdisciplinary Team
(Care/Support Services)
• Nursing Director, ED
• Manager, Admitting
• Director, Case Management
• Admissions/Nursing Supervisor
• Nursing Director, Med/Surg
• Nursing Director, PICU
• Manager, PI
• Director, EVS
• Transport Team
• PACU Manager
• Exec. Director Lab/Imaging
• Manager, OP Pharmacy
Interdisciplinary Team, cont.
• CHOC at Mission, RN Manager
• Nursing Informaticist
• Exec. Director, Patient
Access/Throughput
Medical Staff Members
(Internal/External Customers)
• Physician Champion
• ED Medical Director
• Director of Pediatric Residency
• Medical Director of Patient
Safety and Quality
• Chief Residents
• Hospitalists
13
Uniting people:
Overall Team Strategies
Link to organizational Strategic Plan
Interdisciplinary shared goals
Improvements based on evidence
Hardwiring of budget-neutral structure
Interoperability of Electronic Medical Record
Electronic Throughput Balanced Scorecard
14
System
Evaluation
Delays in
Admissions
P
E
R
F
O
M
A
N
C
E
PLAN
Care
ACT service DO
Outcome
CHECK
EVS
Department
Services
Standardized, timely
Room clean
EVS
Department
Services
Bed Turnaround
<60 minutes
System
Outcomes
Increase
Capacity
Purpose
Goals
Expectations
Workplace
quality
Leadership
Service
quality
Resources
SYSTEMS DYNAMIC: FROM STRATEGY TO GOAL ACHIEVEMENT
Excerpt from: The Quantum Leader. Kathy Malloch, Tim Porter-OGrady 2009
Red Flags “Issues” in Patient Throughput (as of 6/2007)
(Advisory Board, 2002: Maximizing Hospital Capacity)
Throughput Process - Phases
Pre-
admission
Admission
Care Delivery
Discharge
Planning
Discharge
Bed Turnover
Final Root Causes
Pre-admission
Admission
Care Delivery
Discharge
Planning
Discharge
Bed Turnover
No single point of entry
Lack of standardized
admission processes
Unaware of bed
availability
Staffing Model to support
demand
Manual Data Process
Staffing model for Case
Management
RN Staffing did not
support unit
demand/turbulence
Manual data process
Delays waiting for
discharge medications
Delays waiting for
translation
Discharge notification
delays
Late peak discharge times
Variable clinician
performance in throughput
discharge processes
Manual notification Bed
Turnover Process
Multiple bed coordination
efforts.
18
Patient Flow Improvement Team – “Green Flags”
(Advisory Board, 2002: Maximizing Hospital Capacity)
Red Flags (Issues) in Patient Throughput
Changing Practice Culture –Individual Processes
• Key stakeholders (front-line staff) participate (PLAN)
• Conduct a “Walk in my shoes” assessment (PLAN)
• Current process documented/flow chart (PLAN)
• Current facilitators/barriers identified (PLAN)
• Brainstorming practice/electronic solutions (PLAN)
• Brainstorming metrics for documented desired results (PLAN)
• Rapid Improvement Events – PDCA (DO)
• Electronic solution reports created (DO)
• Measurement occurs (CHECK)
• Refine process to achieve/sustain results (ACT)
Stakeholder Involvement in Implementation
Reference: Institute for Health Care Improvement
http://www.ihi.org/IHI/Topics/Improvement/SpreadingChanges/
21
Improving Throughput
Uniting People, Process and
Technology
22
Pre-admission
Admission
Solutions Implemented
Pre-admission
Admission
Care Delivery
Discharge
Planning
Discharge
Bed Turnover
Electronic Bed Board
Computerized provider
order Entry (CPOE)
Standardized Admissions
processes
Patient Placement Center
Dedicated Transporter
Dedicated RN
Electronic data
abstraction
23
•
Establishing Structure and Process: Pre-admission/Admission:
Technology Solutions – The Electronic Bed Board
Bed Board - Live since February 2007
− Includes data required to cohort patients and
measure outcomes
− Tracks pending and actual admissions,
discharges and transfers
− One view of entire hospital’s beds and their
status
− Links to Computerized Provider Order Entry
(CPOE)
− Linked to EVS Dispatch and Tracking Software
24
Establishing Structure: Pre-admission/Admission:
Electronic Bed Board – Admission Activity
Establishing Structure: Pre-admission/Admission:
Electronic Bed Board –Discharge Activity
27
Establishing Structure: Pre-admission/Admission:
The Patient Placement Center
Automated Reporting
29
Improving Throughput
Uniting People, Process and
Technology
30
Care Delivery
Discharge Planning
Solutions Implemented
Pre-admission
Admission
Care Delivery
Discharge
Planning
Discharge
Bed Turnover
Staffing Model –
-Charge RN,
-Flex RNs
- Case Managers,
Work flow processes
Discharge Planning
-Pharmacy
-Translation
Auto text paging –
Translators
Auto Translation-Spanish
Discharge Instructions
31
Establishing Structure and Process: Care Delivery/Discharge Planning:
Nursing Strategies
• Defining the Medical/Surgical Specialty
− Get them in, get them better, get them home !
• Flex RN
− Peak turbulence hours
• Increased charge RN 1:24 beds - (throughput one of their
main roles)
− Perceived acuity was actually chaos
• Discharge Predictions
• Hospitality Escorts
• Re-alignment of Nursing Case Management Model
Establishing Structure and Process: Care Delivery/Discharge Planning:
Discharge Planning Technology Solutions
•Discharge Assessment on Admission
•Discharge Kardex
Discharge Interdisciplinary Recommendations
Discharge Provider “Arrange For” Orders
Case Management Arrangements
•Provider Discharge Order
•Discharge Instructions
•Pediatric Electronic Patient Education
•Pediatric Formulary including Patient Education Tools
Discharge Technology – The Discharge Kardex
Establishing Structure and Process: Care Delivery/Discharge Planning:
Interpretation Workflow and Technology Solutions
Interfaced to CPOE and Clinical Documentation
Decentralized Interpreter “office” to high utilization
locations
Automated workflow processes
Discharge Instructions marked by nurse as ready for
translation and patients prefers information in Spanish,
System pages appropriate translator “Discharge
instructions ready for translation, room 422 bed 1”
35
Physician Discharge Summary
Spanish Translation of Discharge Instructions
Improving Throughput
Uniting People, Process and
Technology
38
Discharge and
Bed Turnover
Solutions Implemented
Pre-admission
Admission
Care Delivery
Discharge
Planning
Discharge
Bed Turnover
Discharge Prediction
Electronic White Board
Real-time notification of
discharge
Auto-texting paging – EVS
EVS bed turnover software
Electronic Abstraction of
Data
39
Establishing Structure and Process: Discharge/Bed Turnover
Key Strategies and Technology Solutions
Nursing/Physician Residents collaborate to predict
discharges at 3:00am
Discharge predictions and orders populate an electronic
“White Board” in the nursing units
Discharge Orders “auto populate” the “White Board”
Hospitality Escorts communicate “real time” discharge to
unit secretary who enters discharge into the computer.
Automatic text page is sent to the EVS associate
responsible to clean the room.
EVS bed turnover process is viewable in the Patient
Placement Center
40
Establishing Structure and Process: Discharge/Bed Turnover:
Electronic White Board
Data Drives Outcomes and Inspires
Improvement
Data Data Data
System for Measuring/Sustaining Results
43
44
Since the PPC Implementation in July 2008, CHOC ED admits volume is significantly increased, while
the call to arrival time is significantly decreased. Average monthly ED admission volumes have
increased from 366 (FY2008) to 466 (FY2011) which represents a 27% increase, while the average call
to arrival time has decreased from 3.36 hours (FY2008) to 2.81 hours (FY2011) which represents a 16%
decrease. Above is a chart from ActiveStrategy that we use to track this measure on a monthly basis.
PPC Implemented in July 2008
45
Since the PPC Implementation in July 2008, average external monthly ED admission volumes
have decreased from 375 (FY2008) to 362 (FY2011) which represents a 3% decrease and the
average call to arrival time has decreased significantly from 3.42 hours (FY2008) to 2.76 hours
(FY2011) which represents a 19% decrease. Above is a chart from ActiveStrategy that we use to
track this measure on a monthly basis.
PPC Implemented in July 2008
46
Since the PPC Implementation in July 2008, Controllable Cancellations is significantly decreased.
Total Number of Controllable Cancellations has decreased from 281 (FY2008) to 54 (FY2011) which
represents a 81% decrease. Above is a chart from ActiveStrategy that we use to track this measure
on a monthly basis.
PPC Implemented in July 2008
47
Since the PPC Implementation in July 2008, time from discharge order written to actual
discharge is significantly decreased. Average time has decreased from 165 mins (FY2008) to
120 mins (FY2011) which represents a 27% decrease. Above is a chart from ActiveStrategy
that we use to track this measure on a monthly basis.
PPC Implemented in July 2008
48
Since the PPC Implementation in July 2008, Actual Discharge to Charted Discharge for the Med Surg
4th is significantly decreased. Average time has decreased from 0.49 hours (FY2008) to 0.12 hours
(FY2011) which represents a 76% decrease. Above is a chart from ActiveStrategy that we use to
track this measure on a monthly basis.
PPC Implemented in July 2008
Since the PPC Implementation in July 2008, Actual Discharge to Charted Discharge for the Med Surg
5th is significantly decreased. Average time has decreased from 0.61 hours (FY2008) to 0.12 hours
(FY2011) which represents a 80% decrease. Above is a chart from ActiveStrategy that we use to
track this measure on a monthly basis.
PPC Implemented in July 2008
CHOC in 2013 – Shared Services Onbarding
• Surgical Services
• Laboratory Services
• Imaging Services
• Emergency Services
• Additional Beds
GOAL: INTEROPERABILITY BETWEEN NEW AND
EXISTING SYSTEMS.
Questions?

12 missildine-choc-improving throughput

  • 1.
    Improving a Mission-CriticalCross-Functional Measure THE ACTIVESTRATEGY CONFERENCE APRIL, 2012 CHERYLCHERYLCHERYLCHERYL MISSILDINEMISSILDINEMISSILDINEMISSILDINE, MSN, RN, NEA, MSN, RN, NEA, MSN, RN, NEA, MSN, RN, NEA----BCBCBCBC CHOC CHILDREN’S HOSPITAL ORANGE, CA Session Objectives The attendee will: • Describe how the alignment of strategic initiatives drives process and practice changes to sustain results. • Describe how systems theory was utilized to redesign the care delivery models to improve patient throughput structure, processes and outcomes. • Discuss the use of technology to embed structure and process in support of patient throughput practices. • Explain how technology was designed to abstract evidenced-based performance improvement metrics and systematically disseminate information across the organization.
  • 2.
    CHOC Children’s Hospital(Orange,California) FY 2011 – Hospital Statistics • 238 Inpatient Beds • ED Visits 54,553 • 11,811 Admissions • 5.0 Average LOS • 81,713 Primary Clinic Visits • 86,035 Specialty Clinic Visits • 4,001 Transports 3 CHOC Children’s Hospital - Mission
  • 3.
    Patient Flow andThroughput: A National Crisis Child Health Corporation of America (2009); Patient Flow and Throughput Pediatric hospitals face: • Steady increases in patient volumes • 46% Admission from Emergency Department (CHOC 65% ED origin) • Competition for available beds • Sources not aligned with one another • Inefficient processes − Bed Assignment − Discharge − Bed Turnover • 67-98% occupancy rates Organization Wide Strategic Initiative 6
  • 4.
    Data Used toSelect the Project • Executive Management Team and the Quality Oversight Committee, Joint Leadership Committee (JLC) received the following concerning data: − ED Data demonstrated lower volumes and longer wait times for pediatric vs. adult patients. − Admission demands peaked prior to patients discharge times resulting in delays − Admissions cancellations occurred related to capacity − Hospital occupancy (73%) was in the lower quartile compared to other pediatric hospitals in a collaborative comparison group 7 Identified Potential Stakeholders • External Stakeholders − Patients/Families − Community MDs − Referring Community/Regional Hospitals − Clinics − ED Physicians − Hospitalists/Surgeons • Internal Stakeholders − Admitting Department − Medical Residents − Nursing Supervisors − Transport Team − Nursing Units − Case Managers − Pharmacy − Interpreters/Translators − Environmental Services − Quality − Informaticist (Technological Support) 8
  • 5.
    Organizational Goals andMission • CHOC Children’s Strategic Goals with Metrics − Operations and Infrastructure (High Impact) ▪ Admission Volumes/Average wait time ▪ Time from order to discharge ▪ Bed turnaround time − Clinical Quality, Safety, and Service (High Impact) ▪ Emergency Department Scorecard − Growth and Development (High Impact) ▪ Average daily census − Financial Stewardship (Medium Impact) ▪ Increased admissions, enhanced efficiencies, and decrease cancellations − Partnerships and Affiliations (Medium Impact) ▪ Successful affiliations 10
  • 6.
    Interdisciplinary Performance Improvement Team 11 Unitingpeople: Patient Throughput – The Plan Goals − Promote patient safety by ensuring timely, appropriate inpatient admissions − Implement strategies to facilitate bed supply and demand throughout the day − Provide hospital services and infrastructure to support efficient patient care to create “virtual bed capacity” Initial Strategy − Formal Improving Organizational Performance (IOP) Committee 12
  • 7.
    The Patient FlowImprovement Team Interdisciplinary Team (Care/Support Services) • Nursing Director, ED • Manager, Admitting • Director, Case Management • Admissions/Nursing Supervisor • Nursing Director, Med/Surg • Nursing Director, PICU • Manager, PI • Director, EVS • Transport Team • PACU Manager • Exec. Director Lab/Imaging • Manager, OP Pharmacy Interdisciplinary Team, cont. • CHOC at Mission, RN Manager • Nursing Informaticist • Exec. Director, Patient Access/Throughput Medical Staff Members (Internal/External Customers) • Physician Champion • ED Medical Director • Director of Pediatric Residency • Medical Director of Patient Safety and Quality • Chief Residents • Hospitalists 13 Uniting people: Overall Team Strategies Link to organizational Strategic Plan Interdisciplinary shared goals Improvements based on evidence Hardwiring of budget-neutral structure Interoperability of Electronic Medical Record Electronic Throughput Balanced Scorecard 14
  • 8.
    System Evaluation Delays in Admissions P E R F O M A N C E PLAN Care ACT serviceDO Outcome CHECK EVS Department Services Standardized, timely Room clean EVS Department Services Bed Turnaround <60 minutes System Outcomes Increase Capacity Purpose Goals Expectations Workplace quality Leadership Service quality Resources SYSTEMS DYNAMIC: FROM STRATEGY TO GOAL ACHIEVEMENT Excerpt from: The Quantum Leader. Kathy Malloch, Tim Porter-OGrady 2009 Red Flags “Issues” in Patient Throughput (as of 6/2007) (Advisory Board, 2002: Maximizing Hospital Capacity)
  • 9.
    Throughput Process -Phases Pre- admission Admission Care Delivery Discharge Planning Discharge Bed Turnover Final Root Causes Pre-admission Admission Care Delivery Discharge Planning Discharge Bed Turnover No single point of entry Lack of standardized admission processes Unaware of bed availability Staffing Model to support demand Manual Data Process Staffing model for Case Management RN Staffing did not support unit demand/turbulence Manual data process Delays waiting for discharge medications Delays waiting for translation Discharge notification delays Late peak discharge times Variable clinician performance in throughput discharge processes Manual notification Bed Turnover Process Multiple bed coordination efforts. 18
  • 10.
    Patient Flow ImprovementTeam – “Green Flags” (Advisory Board, 2002: Maximizing Hospital Capacity) Red Flags (Issues) in Patient Throughput Changing Practice Culture –Individual Processes • Key stakeholders (front-line staff) participate (PLAN) • Conduct a “Walk in my shoes” assessment (PLAN) • Current process documented/flow chart (PLAN) • Current facilitators/barriers identified (PLAN) • Brainstorming practice/electronic solutions (PLAN) • Brainstorming metrics for documented desired results (PLAN) • Rapid Improvement Events – PDCA (DO) • Electronic solution reports created (DO) • Measurement occurs (CHECK) • Refine process to achieve/sustain results (ACT)
  • 11.
    Stakeholder Involvement inImplementation Reference: Institute for Health Care Improvement http://www.ihi.org/IHI/Topics/Improvement/SpreadingChanges/ 21 Improving Throughput Uniting People, Process and Technology 22 Pre-admission Admission
  • 12.
    Solutions Implemented Pre-admission Admission Care Delivery Discharge Planning Discharge BedTurnover Electronic Bed Board Computerized provider order Entry (CPOE) Standardized Admissions processes Patient Placement Center Dedicated Transporter Dedicated RN Electronic data abstraction 23 • Establishing Structure and Process: Pre-admission/Admission: Technology Solutions – The Electronic Bed Board Bed Board - Live since February 2007 − Includes data required to cohort patients and measure outcomes − Tracks pending and actual admissions, discharges and transfers − One view of entire hospital’s beds and their status − Links to Computerized Provider Order Entry (CPOE) − Linked to EVS Dispatch and Tracking Software 24
  • 13.
    Establishing Structure: Pre-admission/Admission: ElectronicBed Board – Admission Activity Establishing Structure: Pre-admission/Admission: Electronic Bed Board –Discharge Activity
  • 14.
  • 15.
    Automated Reporting 29 Improving Throughput UnitingPeople, Process and Technology 30 Care Delivery Discharge Planning
  • 16.
    Solutions Implemented Pre-admission Admission Care Delivery Discharge Planning Discharge BedTurnover Staffing Model – -Charge RN, -Flex RNs - Case Managers, Work flow processes Discharge Planning -Pharmacy -Translation Auto text paging – Translators Auto Translation-Spanish Discharge Instructions 31 Establishing Structure and Process: Care Delivery/Discharge Planning: Nursing Strategies • Defining the Medical/Surgical Specialty − Get them in, get them better, get them home ! • Flex RN − Peak turbulence hours • Increased charge RN 1:24 beds - (throughput one of their main roles) − Perceived acuity was actually chaos • Discharge Predictions • Hospitality Escorts • Re-alignment of Nursing Case Management Model
  • 17.
    Establishing Structure andProcess: Care Delivery/Discharge Planning: Discharge Planning Technology Solutions •Discharge Assessment on Admission •Discharge Kardex Discharge Interdisciplinary Recommendations Discharge Provider “Arrange For” Orders Case Management Arrangements •Provider Discharge Order •Discharge Instructions •Pediatric Electronic Patient Education •Pediatric Formulary including Patient Education Tools Discharge Technology – The Discharge Kardex
  • 18.
    Establishing Structure andProcess: Care Delivery/Discharge Planning: Interpretation Workflow and Technology Solutions Interfaced to CPOE and Clinical Documentation Decentralized Interpreter “office” to high utilization locations Automated workflow processes Discharge Instructions marked by nurse as ready for translation and patients prefers information in Spanish, System pages appropriate translator “Discharge instructions ready for translation, room 422 bed 1” 35 Physician Discharge Summary
  • 19.
    Spanish Translation ofDischarge Instructions Improving Throughput Uniting People, Process and Technology 38 Discharge and Bed Turnover
  • 20.
    Solutions Implemented Pre-admission Admission Care Delivery Discharge Planning Discharge BedTurnover Discharge Prediction Electronic White Board Real-time notification of discharge Auto-texting paging – EVS EVS bed turnover software Electronic Abstraction of Data 39 Establishing Structure and Process: Discharge/Bed Turnover Key Strategies and Technology Solutions Nursing/Physician Residents collaborate to predict discharges at 3:00am Discharge predictions and orders populate an electronic “White Board” in the nursing units Discharge Orders “auto populate” the “White Board” Hospitality Escorts communicate “real time” discharge to unit secretary who enters discharge into the computer. Automatic text page is sent to the EVS associate responsible to clean the room. EVS bed turnover process is viewable in the Patient Placement Center 40
  • 21.
    Establishing Structure andProcess: Discharge/Bed Turnover: Electronic White Board Data Drives Outcomes and Inspires Improvement Data Data Data
  • 22.
    System for Measuring/SustainingResults 43 44 Since the PPC Implementation in July 2008, CHOC ED admits volume is significantly increased, while the call to arrival time is significantly decreased. Average monthly ED admission volumes have increased from 366 (FY2008) to 466 (FY2011) which represents a 27% increase, while the average call to arrival time has decreased from 3.36 hours (FY2008) to 2.81 hours (FY2011) which represents a 16% decrease. Above is a chart from ActiveStrategy that we use to track this measure on a monthly basis. PPC Implemented in July 2008
  • 23.
    45 Since the PPCImplementation in July 2008, average external monthly ED admission volumes have decreased from 375 (FY2008) to 362 (FY2011) which represents a 3% decrease and the average call to arrival time has decreased significantly from 3.42 hours (FY2008) to 2.76 hours (FY2011) which represents a 19% decrease. Above is a chart from ActiveStrategy that we use to track this measure on a monthly basis. PPC Implemented in July 2008 46 Since the PPC Implementation in July 2008, Controllable Cancellations is significantly decreased. Total Number of Controllable Cancellations has decreased from 281 (FY2008) to 54 (FY2011) which represents a 81% decrease. Above is a chart from ActiveStrategy that we use to track this measure on a monthly basis. PPC Implemented in July 2008
  • 24.
    47 Since the PPCImplementation in July 2008, time from discharge order written to actual discharge is significantly decreased. Average time has decreased from 165 mins (FY2008) to 120 mins (FY2011) which represents a 27% decrease. Above is a chart from ActiveStrategy that we use to track this measure on a monthly basis. PPC Implemented in July 2008 48 Since the PPC Implementation in July 2008, Actual Discharge to Charted Discharge for the Med Surg 4th is significantly decreased. Average time has decreased from 0.49 hours (FY2008) to 0.12 hours (FY2011) which represents a 76% decrease. Above is a chart from ActiveStrategy that we use to track this measure on a monthly basis. PPC Implemented in July 2008
  • 25.
    Since the PPCImplementation in July 2008, Actual Discharge to Charted Discharge for the Med Surg 5th is significantly decreased. Average time has decreased from 0.61 hours (FY2008) to 0.12 hours (FY2011) which represents a 80% decrease. Above is a chart from ActiveStrategy that we use to track this measure on a monthly basis. PPC Implemented in July 2008 CHOC in 2013 – Shared Services Onbarding • Surgical Services • Laboratory Services • Imaging Services • Emergency Services • Additional Beds GOAL: INTEROPERABILITY BETWEEN NEW AND EXISTING SYSTEMS.
  • 26.