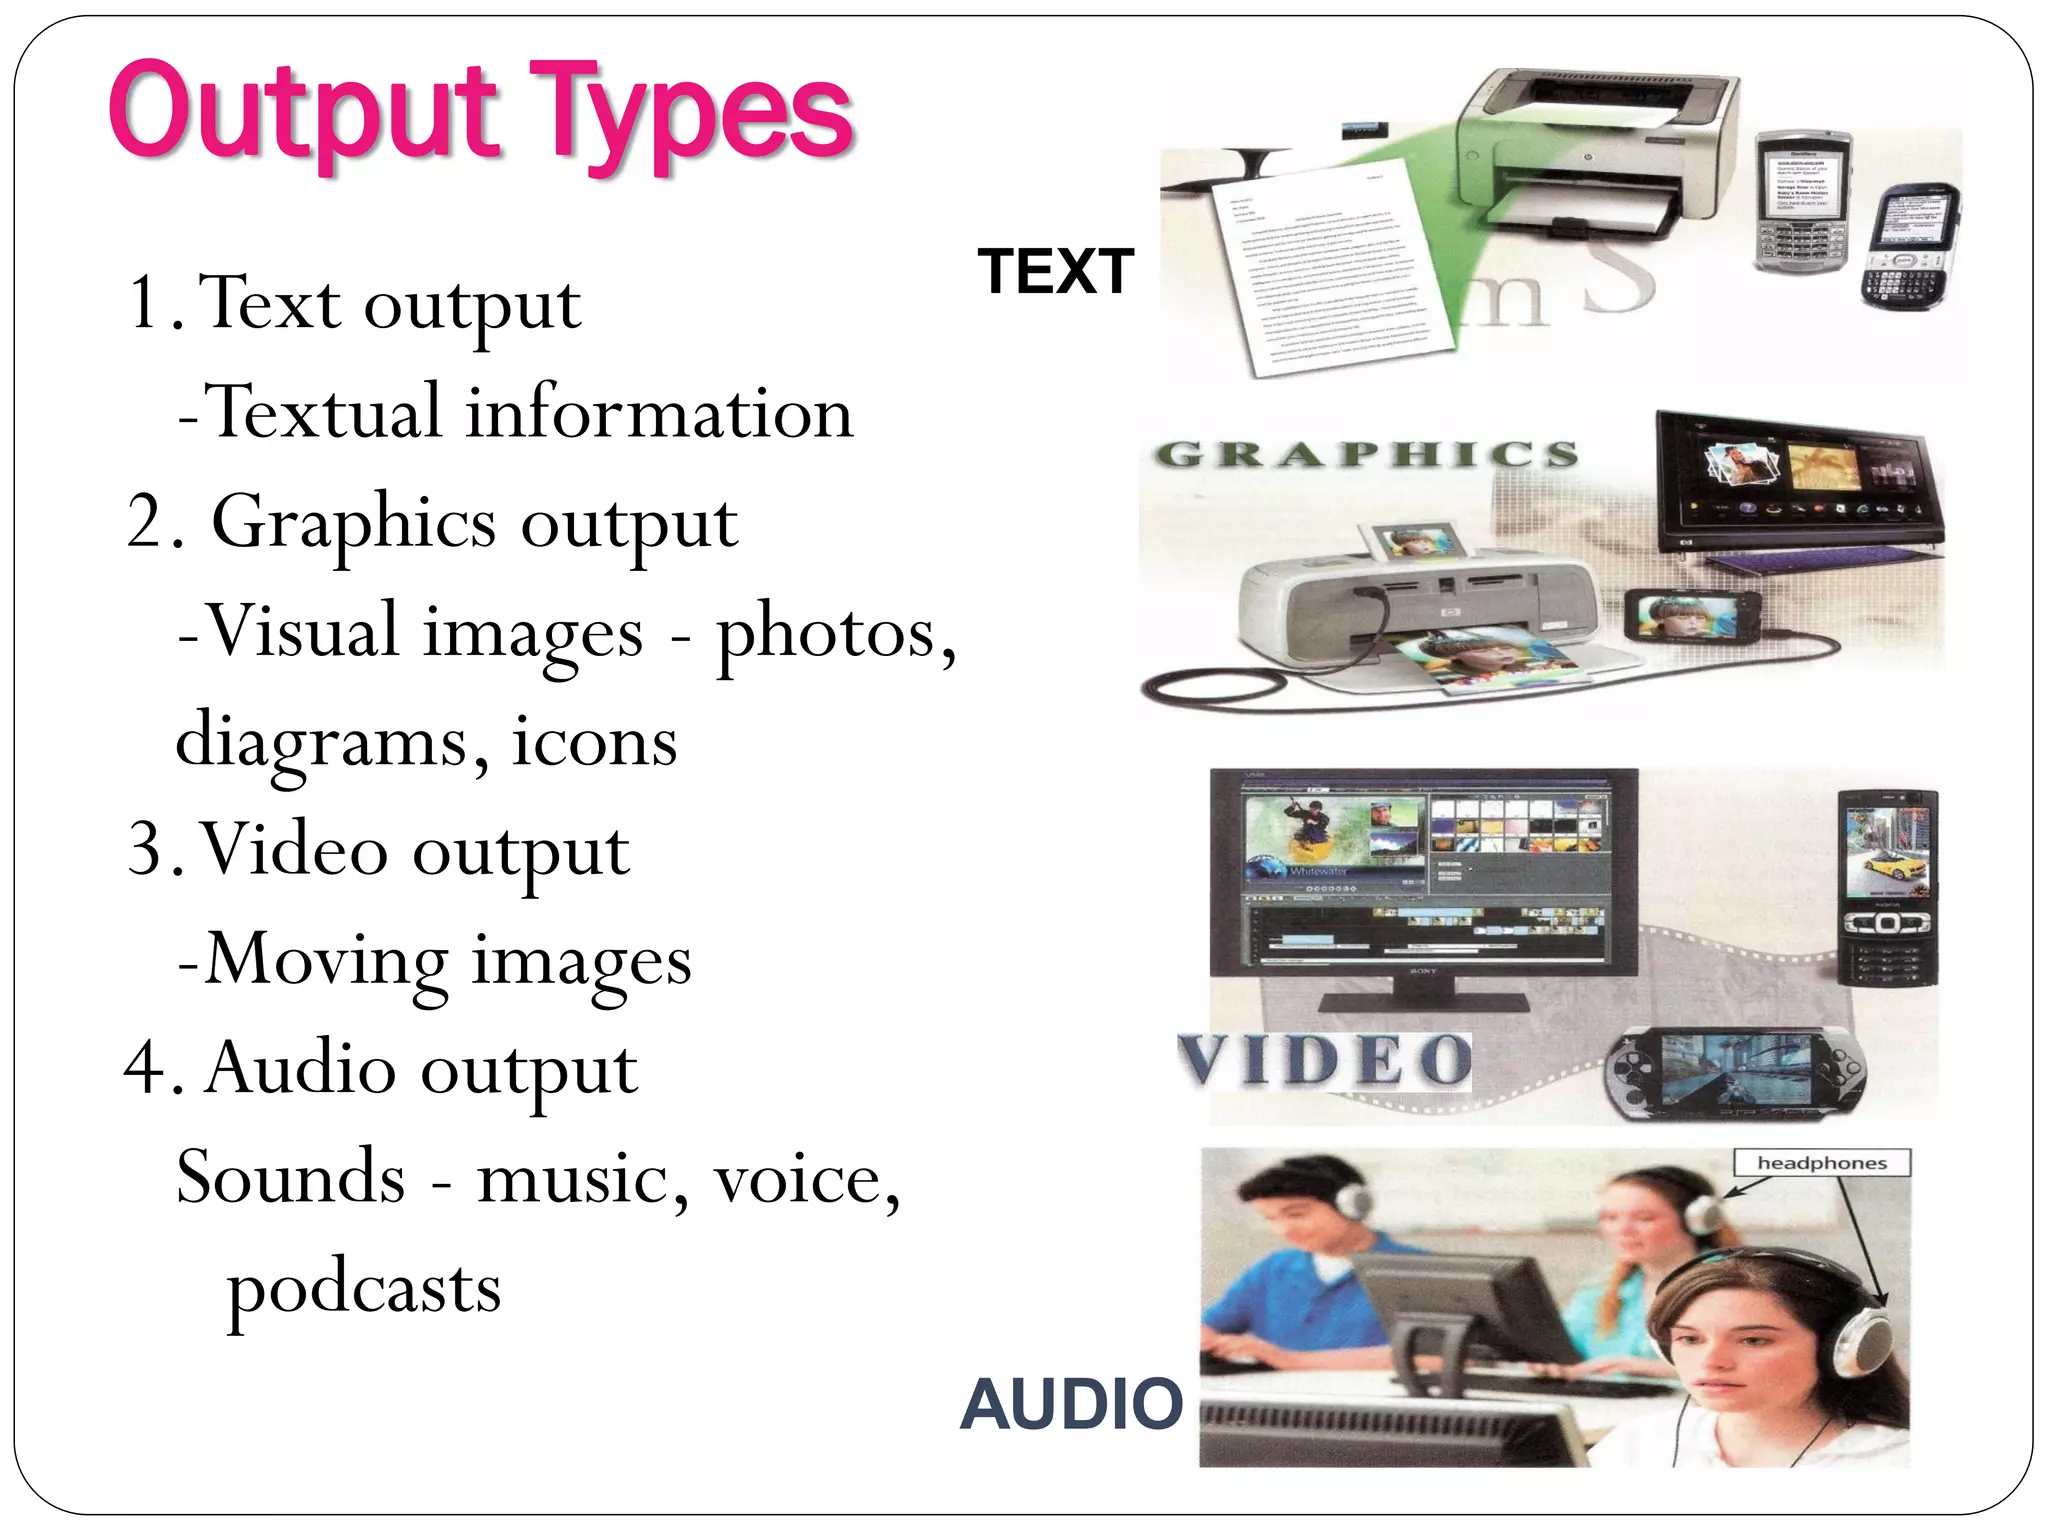
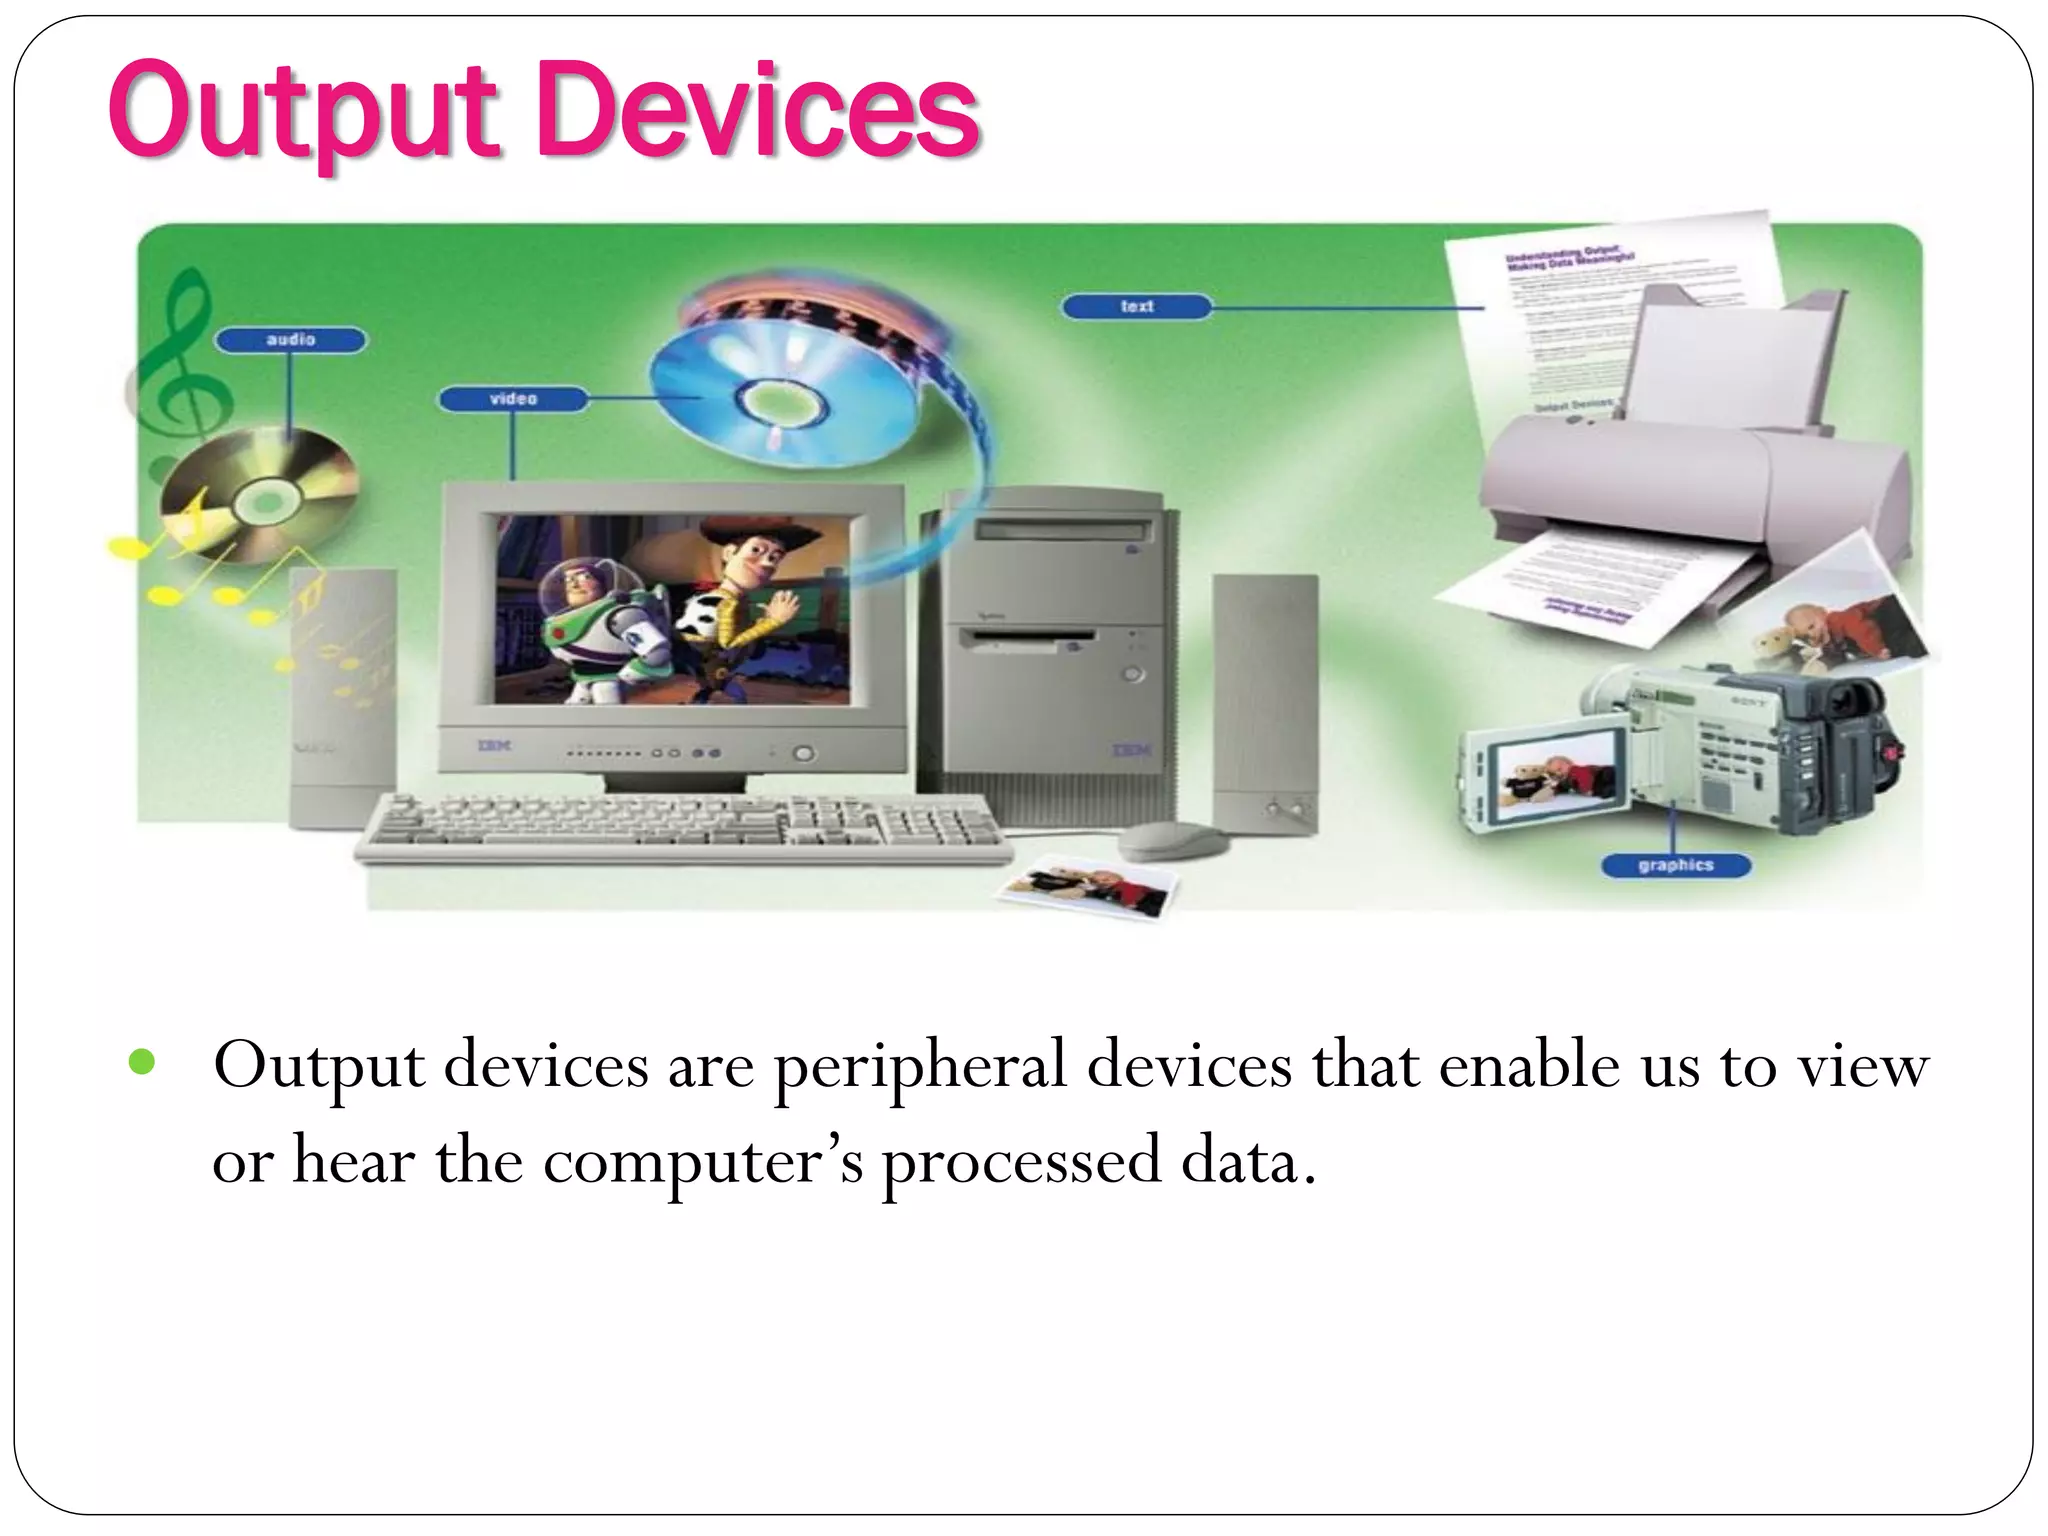
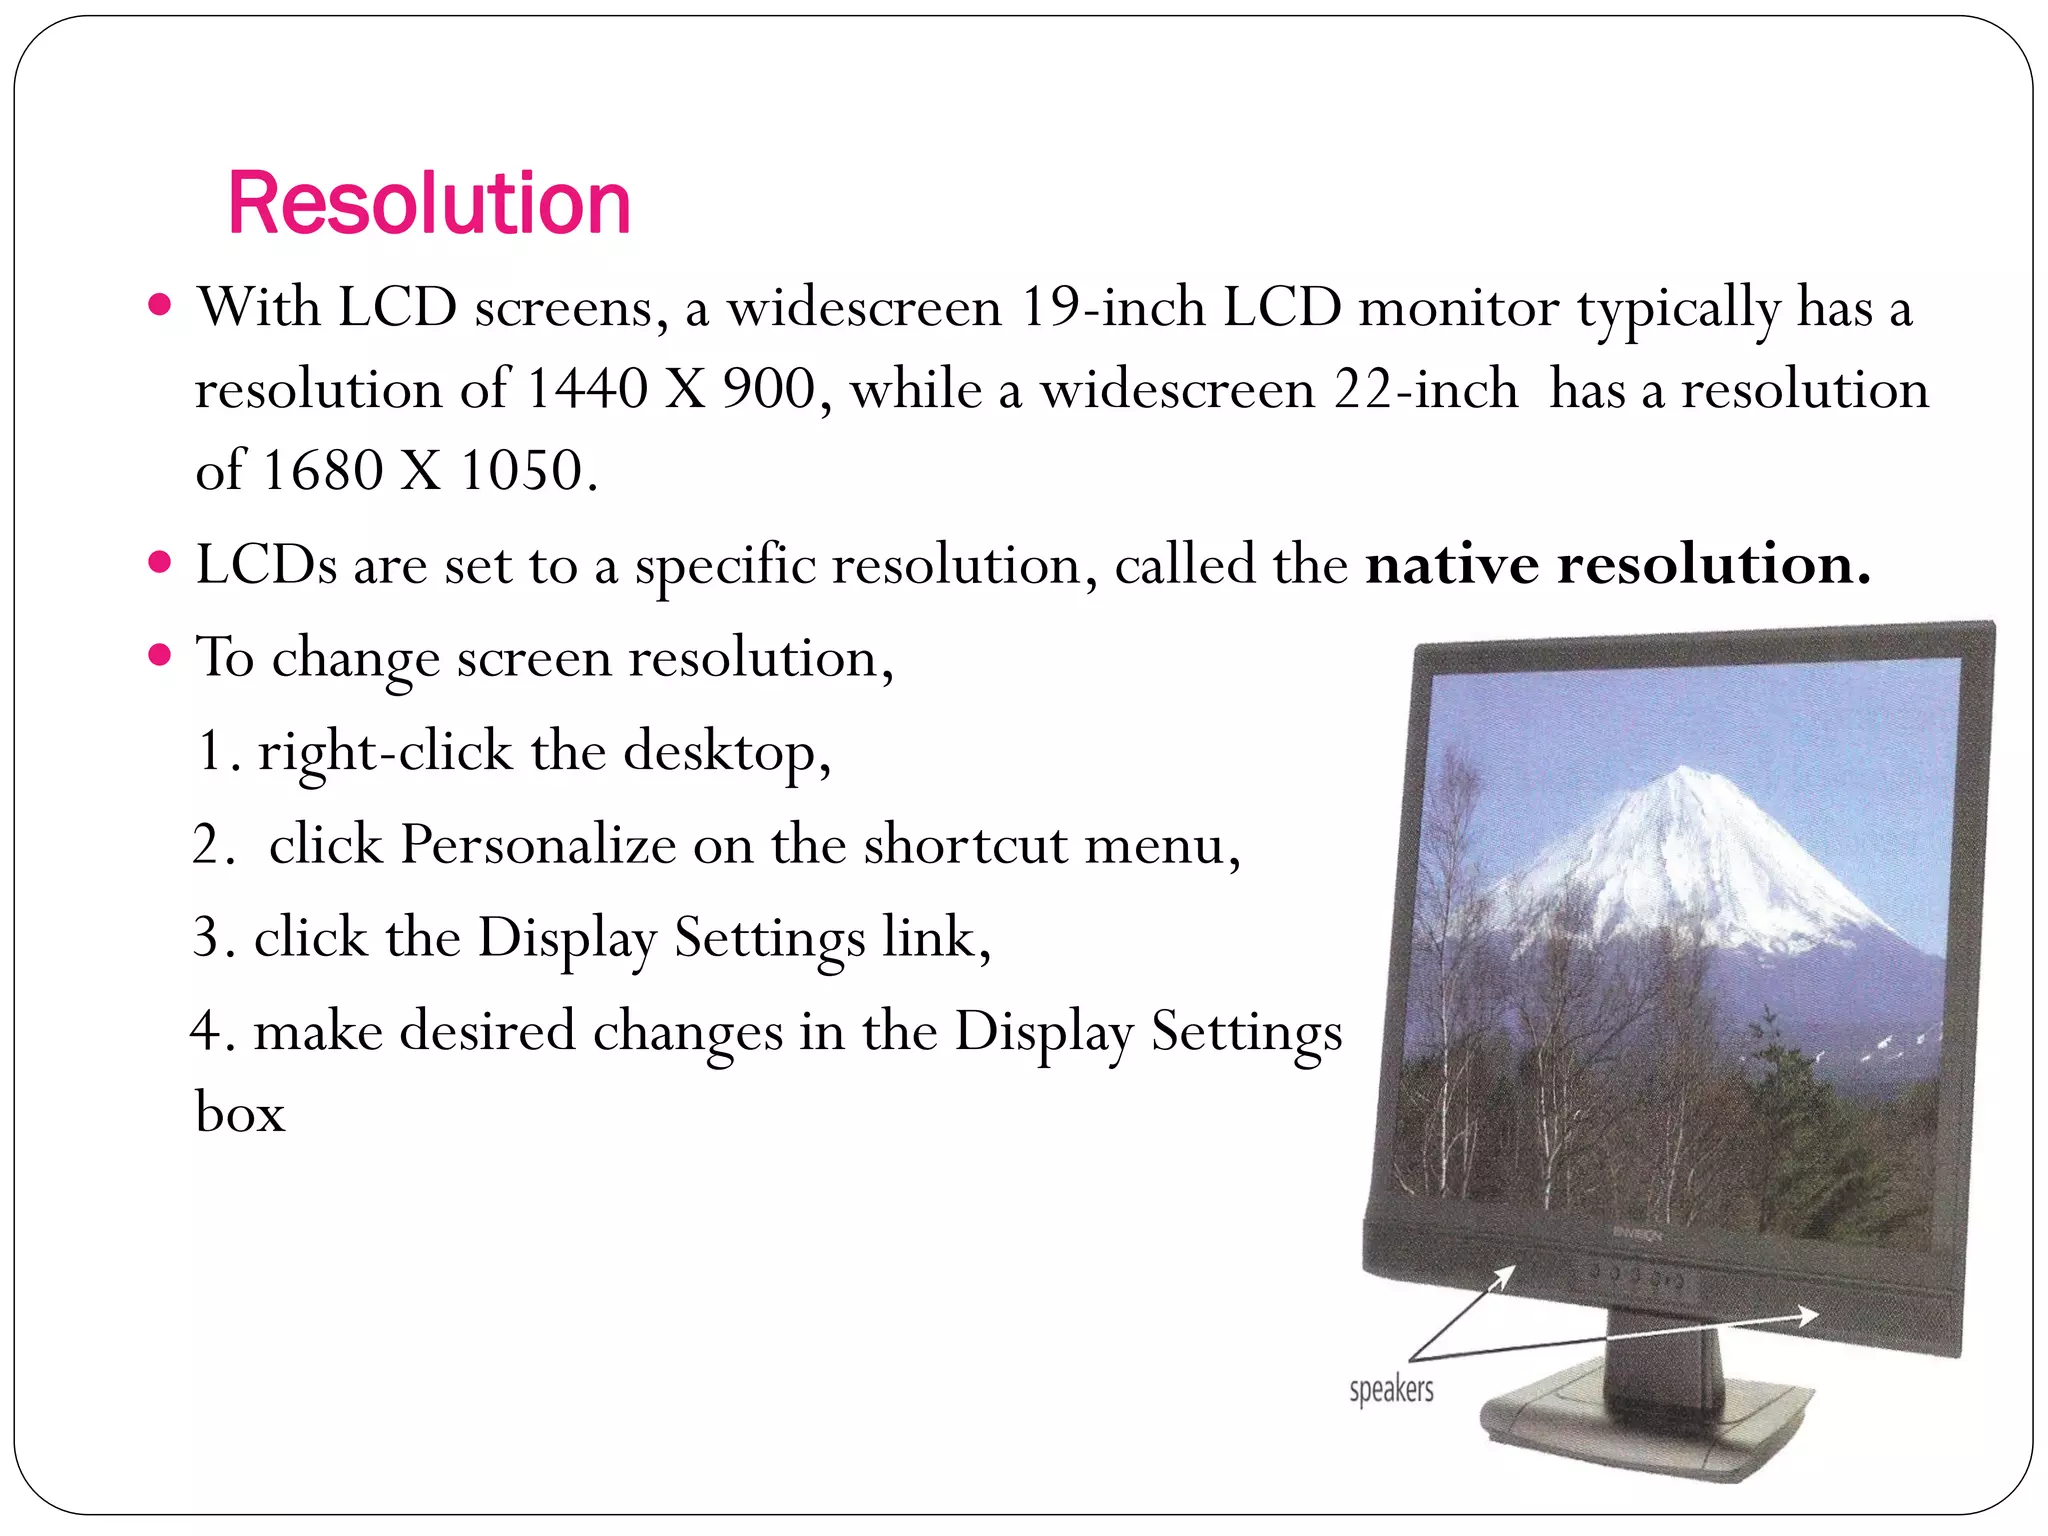
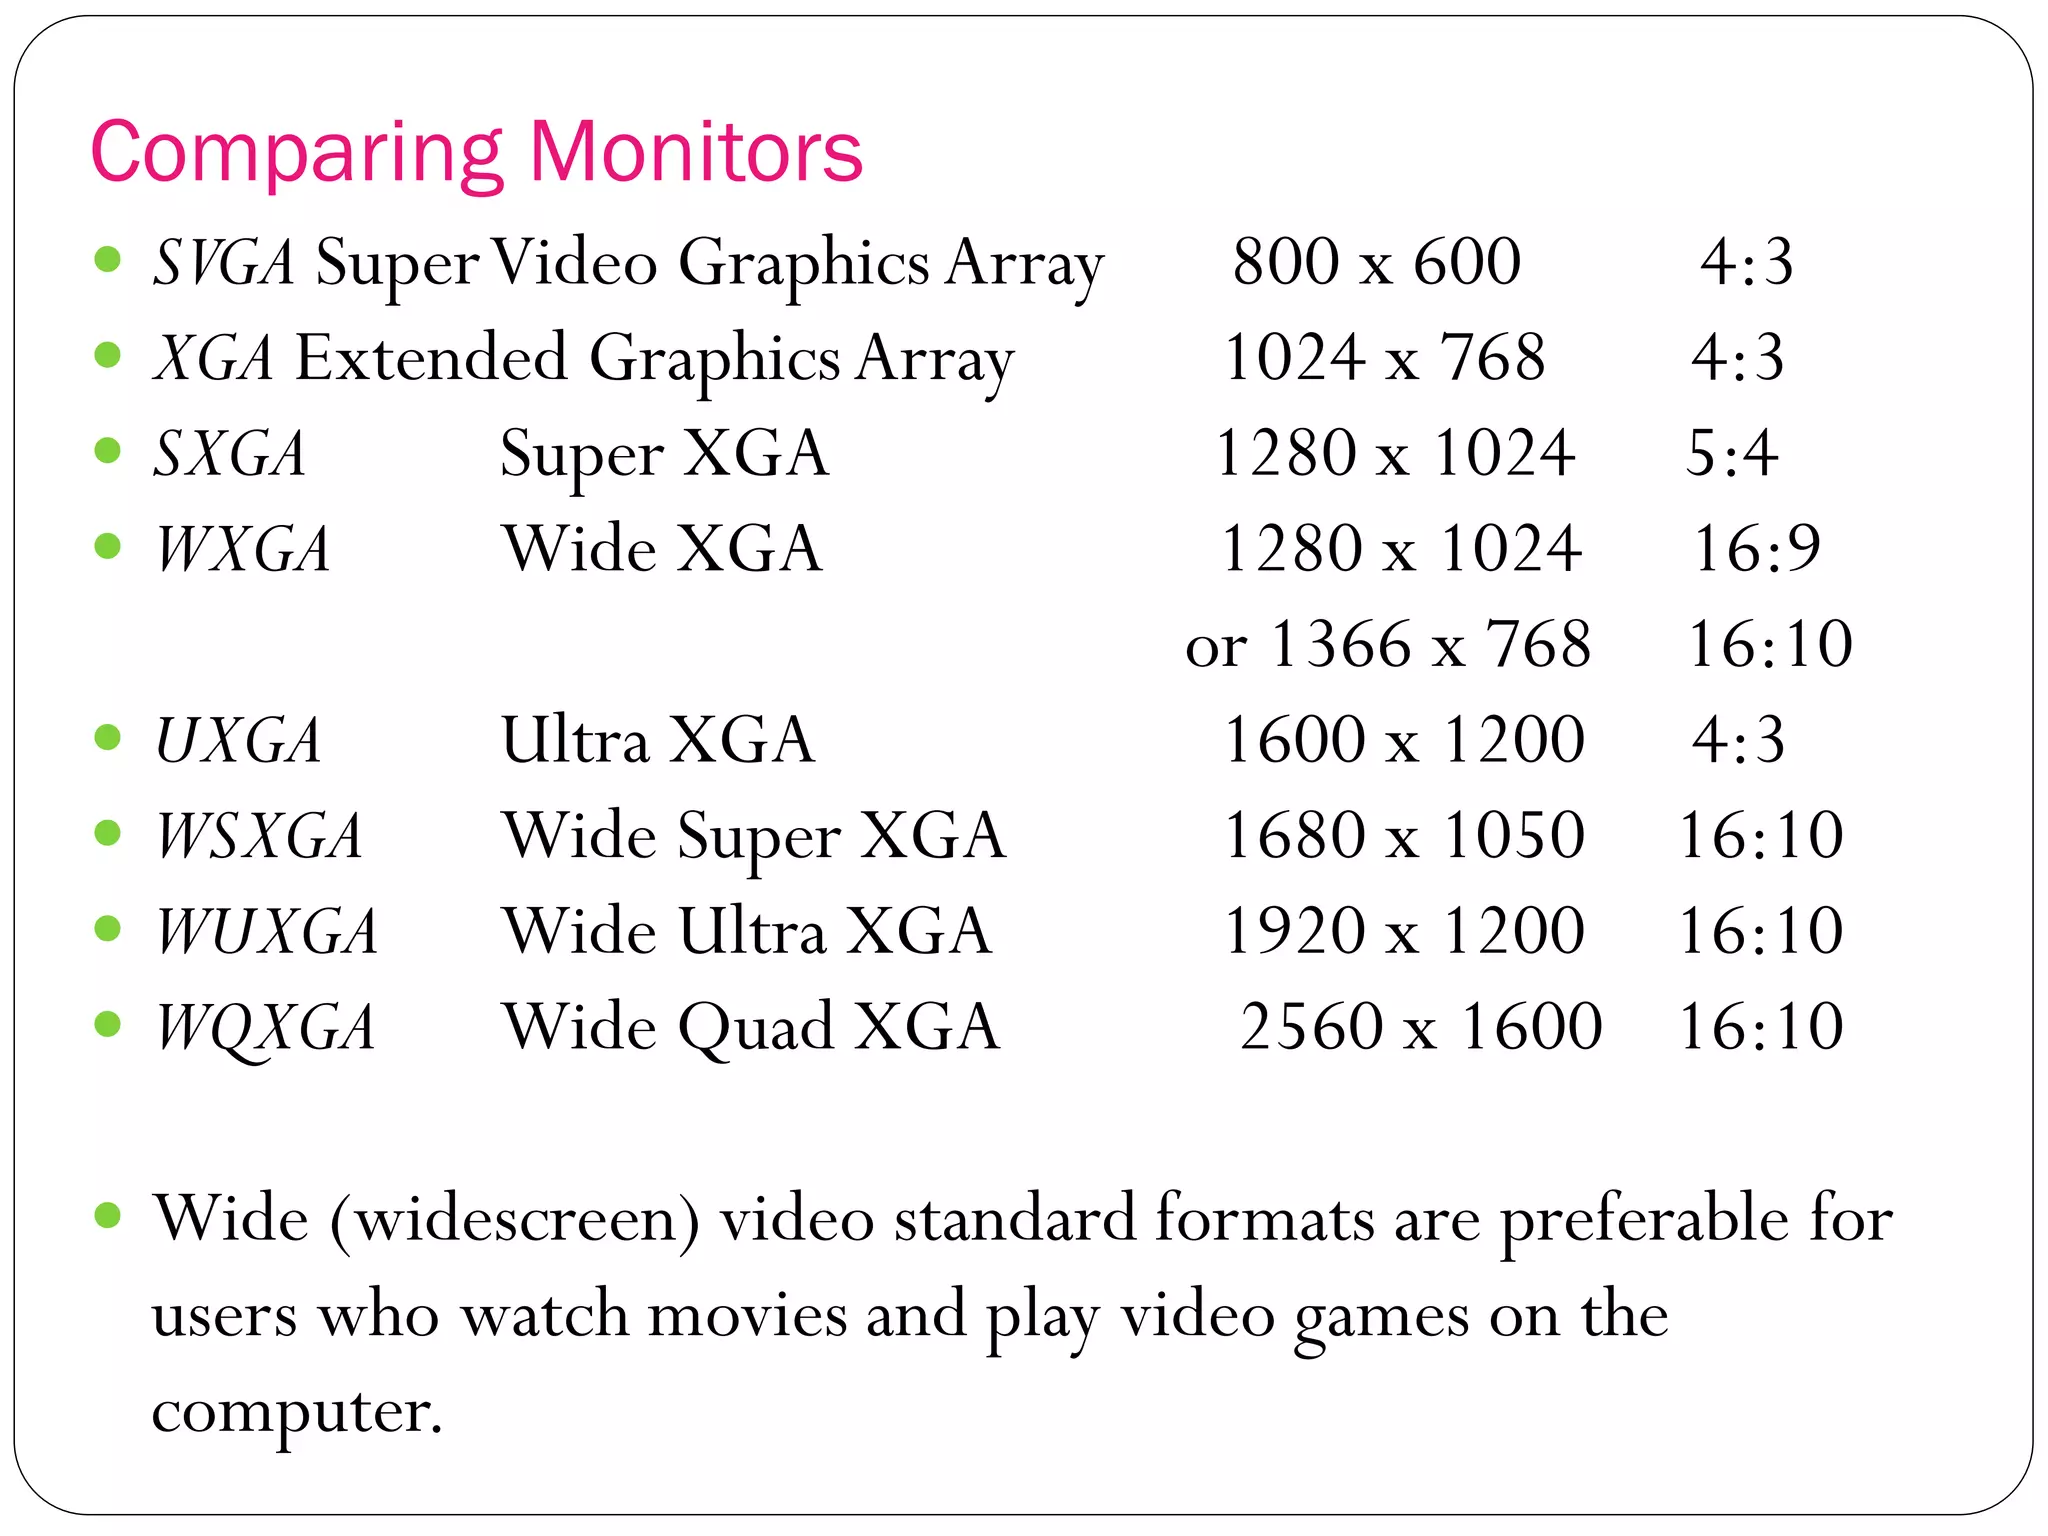
This document provides an overview of computer output and output devices. It discusses the different types of output including text, graphics, video, and audio. Common output devices are then described, including monitors, printers, speakers, and others. The document focuses on monitors, explaining the differences between CRT and LCD monitors. It covers LCD monitor types, resolution, refresh rates, and other specifications for comparing monitors.
Presentation describing how full immersion is achieved by simultaneously focusing on the broader dimensions of visual quality, sound quality, and intuitive interactions. The optimal way to enhance these broader dimensions requires an end-to-end approach, heterogeneous computing, and utilizing cognitive technologies.
Check out the immersive experiences website for the latest information: https://www.qualcomm.com/invention/cognitive-technologies/immersive-experiences
Download the presentation at: https://www.qualcomm.com/documents/immersive-experiences-presentation
Digital Light Processing and it's Future applicationsPramitha Preman
This ppt describes briefly about DLP, its evolution and working. It also includes the Pros & Cons of this technology.
You can also find an youtube video regarding the working of digital light processing.
link: https://www.youtube.com/watch?v=9nb8mM3uEIc
Monitors and sound systems
Devices that convert machine language into human understandable form.
Output can be in display form, on paper or sound on speakers.
Monitor
Sound System
Printer
Monitors are the most commonly used output devices.
A peripheral device with a screen for the visual display of information.
Neuro-symbolic is not enough, we need neuro-*semantic*Frank van Harmelen
Neuro-symbolic (NeSy) AI is on the rise. However, simply machine learning on just any symbolic structure is not sufficient to really harvest the gains of NeSy. These will only be gained when the symbolic structures have an actual semantics. I give an operational definition of semantics as “predictable inference”.
All of this illustrated with link prediction over knowledge graphs, but the argument is general.
Encryption in Microsoft 365 - ExpertsLive Netherlands 2024Albert Hoitingh
In this session I delve into the encryption technology used in Microsoft 365 and Microsoft Purview. Including the concepts of Customer Key and Double Key Encryption.
JMeter webinar - integration with InfluxDB and GrafanaRTTS
Watch this recorded webinar about real-time monitoring of application performance. See how to integrate Apache JMeter, the open-source leader in performance testing, with InfluxDB, the open-source time-series database, and Grafana, the open-source analytics and visualization application.
In this webinar, we will review the benefits of leveraging InfluxDB and Grafana when executing load tests and demonstrate how these tools are used to visualize performance metrics.
Length: 30 minutes
Session Overview
-------------------------------------------
During this webinar, we will cover the following topics while demonstrating the integrations of JMeter, InfluxDB and Grafana:
- What out-of-the-box solutions are available for real-time monitoring JMeter tests?
- What are the benefits of integrating InfluxDB and Grafana into the load testing stack?
- Which features are provided by Grafana?
- Demonstration of InfluxDB and Grafana using a practice web application
To view the webinar recording, go to:
https://www.rttsweb.com/jmeter-integration-webinar
Securing your Kubernetes cluster_ a step-by-step guide to success !KatiaHIMEUR1
Today, after several years of existence, an extremely active community and an ultra-dynamic ecosystem, Kubernetes has established itself as the de facto standard in container orchestration. Thanks to a wide range of managed services, it has never been so easy to set up a ready-to-use Kubernetes cluster.
However, this ease of use means that the subject of security in Kubernetes is often left for later, or even neglected. This exposes companies to significant risks.
In this talk, I'll show you step-by-step how to secure your Kubernetes cluster for greater peace of mind and reliability.
The Art of the Pitch: WordPress Relationships and SalesLaura Byrne
Clients don’t know what they don’t know. What web solutions are right for them? How does WordPress come into the picture? How do you make sure you understand scope and timeline? What do you do if sometime changes?
All these questions and more will be explored as we talk about matching clients’ needs with what your agency offers without pulling teeth or pulling your hair out. Practical tips, and strategies for successful relationship building that leads to closing the deal.
Accelerate your Kubernetes clusters with Varnish CachingThijs Feryn
A presentation about the usage and availability of Varnish on Kubernetes. This talk explores the capabilities of Varnish caching and shows how to use the Varnish Helm chart to deploy it to Kubernetes.
This presentation was delivered at K8SUG Singapore. See https://feryn.eu/presentations/accelerate-your-kubernetes-clusters-with-varnish-caching-k8sug-singapore-28-2024 for more details.
Essentials of Automations: Optimizing FME Workflows with ParametersSafe Software
Are you looking to streamline your workflows and boost your projects’ efficiency? Do you find yourself searching for ways to add flexibility and control over your FME workflows? If so, you’re in the right place.
Join us for an insightful dive into the world of FME parameters, a critical element in optimizing workflow efficiency. This webinar marks the beginning of our three-part “Essentials of Automation” series. This first webinar is designed to equip you with the knowledge and skills to utilize parameters effectively: enhancing the flexibility, maintainability, and user control of your FME projects.
Here’s what you’ll gain:
- Essentials of FME Parameters: Understand the pivotal role of parameters, including Reader/Writer, Transformer, User, and FME Flow categories. Discover how they are the key to unlocking automation and optimization within your workflows.
- Practical Applications in FME Form: Delve into key user parameter types including choice, connections, and file URLs. Allow users to control how a workflow runs, making your workflows more reusable. Learn to import values and deliver the best user experience for your workflows while enhancing accuracy.
- Optimization Strategies in FME Flow: Explore the creation and strategic deployment of parameters in FME Flow, including the use of deployment and geometry parameters, to maximize workflow efficiency.
- Pro Tips for Success: Gain insights on parameterizing connections and leveraging new features like Conditional Visibility for clarity and simplicity.
We’ll wrap up with a glimpse into future webinars, followed by a Q&A session to address your specific questions surrounding this topic.
Don’t miss this opportunity to elevate your FME expertise and drive your projects to new heights of efficiency.
DevOps and Testing slides at DASA ConnectKari Kakkonen
My and Rik Marselis slides at 30.5.2024 DASA Connect conference. We discuss about what is testing, then what is agile testing and finally what is Testing in DevOps. Finally we had lovely workshop with the participants trying to find out different ways to think about quality and testing in different parts of the DevOps infinity loop.
GraphRAG is All You need? LLM & Knowledge GraphGuy Korland
Guy Korland, CEO and Co-founder of FalkorDB, will review two articles on the integration of language models with knowledge graphs.
1. Unifying Large Language Models and Knowledge Graphs: A Roadmap.
https://arxiv.org/abs/2306.08302
2. Microsoft Research's GraphRAG paper and a review paper on various uses of knowledge graphs:
https://www.microsoft.com/en-us/research/blog/graphrag-unlocking-llm-discovery-on-narrative-private-data/
Elevating Tactical DDD Patterns Through Object CalisthenicsDorra BARTAGUIZ
After immersing yourself in the blue book and its red counterpart, attending DDD-focused conferences, and applying tactical patterns, you're left with a crucial question: How do I ensure my design is effective? Tactical patterns within Domain-Driven Design (DDD) serve as guiding principles for creating clear and manageable domain models. However, achieving success with these patterns requires additional guidance. Interestingly, we've observed that a set of constraints initially designed for training purposes remarkably aligns with effective pattern implementation, offering a more ‘mechanical’ approach. Let's explore together how Object Calisthenics can elevate the design of your tactical DDD patterns, offering concrete help for those venturing into DDD for the first time!
Dev Dives: Train smarter, not harder – active learning and UiPath LLMs for do...UiPathCommunity
💥 Speed, accuracy, and scaling – discover the superpowers of GenAI in action with UiPath Document Understanding and Communications Mining™:
See how to accelerate model training and optimize model performance with active learning
Learn about the latest enhancements to out-of-the-box document processing – with little to no training required
Get an exclusive demo of the new family of UiPath LLMs – GenAI models specialized for processing different types of documents and messages
This is a hands-on session specifically designed for automation developers and AI enthusiasts seeking to enhance their knowledge in leveraging the latest intelligent document processing capabilities offered by UiPath.
Speakers:
👨🏫 Andras Palfi, Senior Product Manager, UiPath
👩🏫 Lenka Dulovicova, Product Program Manager, UiPath
Connector Corner: Automate dynamic content and events by pushing a buttonDianaGray10
Here is something new! In our next Connector Corner webinar, we will demonstrate how you can use a single workflow to:
Create a campaign using Mailchimp with merge tags/fields
Send an interactive Slack channel message (using buttons)
Have the message received by managers and peers along with a test email for review
But there’s more:
In a second workflow supporting the same use case, you’ll see:
Your campaign sent to target colleagues for approval
If the “Approve” button is clicked, a Jira/Zendesk ticket is created for the marketing design team
But—if the “Reject” button is pushed, colleagues will be alerted via Slack message
Join us to learn more about this new, human-in-the-loop capability, brought to you by Integration Service connectors.
And...
Speakers:
Akshay Agnihotri, Product Manager
Charlie Greenberg, Host
Software Delivery At the Speed of AI: Inflectra Invests In AI-Powered QualityInflectra
In this insightful webinar, Inflectra explores how artificial intelligence (AI) is transforming software development and testing. Discover how AI-powered tools are revolutionizing every stage of the software development lifecycle (SDLC), from design and prototyping to testing, deployment, and monitoring.
Learn about:
• The Future of Testing: How AI is shifting testing towards verification, analysis, and higher-level skills, while reducing repetitive tasks.
• Test Automation: How AI-powered test case generation, optimization, and self-healing tests are making testing more efficient and effective.
• Visual Testing: Explore the emerging capabilities of AI in visual testing and how it's set to revolutionize UI verification.
• Inflectra's AI Solutions: See demonstrations of Inflectra's cutting-edge AI tools like the ChatGPT plugin and Azure Open AI platform, designed to streamline your testing process.
Whether you're a developer, tester, or QA professional, this webinar will give you valuable insights into how AI is shaping the future of software delivery.
Generating a custom Ruby SDK for your web service or Rails API using Smithyg2nightmarescribd
Have you ever wanted a Ruby client API to communicate with your web service? Smithy is a protocol-agnostic language for defining services and SDKs. Smithy Ruby is an implementation of Smithy that generates a Ruby SDK using a Smithy model. In this talk, we will explore Smithy and Smithy Ruby to learn how to generate custom feature-rich SDKs that can communicate with any web service, such as a Rails JSON API.
3. Introduction
3
Output is data that has been processed into a useful
form.
Output is an optional step in the information
processing cycle but may be ordered by the user or
program.
The computer may be required to display the results
of its processing.
The results may appear as text, numbers, or a graphic
on the computer’s screen or as sounds from its
speaker.
The computer also can send output to a printer or
transfer the output to another computer through a
network or the internet.
5. Output Devices
5
Output devices are peripheral devices that enable us to view
or hear the computer’s processed data.
6. Commonly used Output Devices
6
1. Monitors/Display devices
2. Printers
3. Speakers
4. Headphones and earbuds
5. Data Projectors
6. Interactive whiteboards
7. Force-feedback game controllers
8.Tactile output
7. 1. Monitors
7
A peripheral device which displays computer output on a
screen.
Screen output is referred to as soft copy.
It is the most commonly used output device on personal
computer systems
Two important hardware devices determine the quality of
the image you see on any monitor:
1. monitor itself
2. video controller
8. Types of monitors
8
Cathode-ray tube (CRT)
Liquid Crystal Display (LCD or flat-panel)
CRT LCD
9. Types of monitors
9
CRT- Cathode RayTube
Uses a large vacuum tube sealed glass tube.
electron gun shoots a stream of electrons at a
specially phosphor-coated screen
on impact, the phosphor flares up for a fraction of a
second
electron gun sweeps across the screen many times a
second(R to L thenTop to bottom then refreshes
screen in a diagonal manner)
Have been the standard for use with desktop computers
because they provide a bright, clear picture at a
relatively low cost.
Disadvantages of CRT monitors
They take up desktop space and can be difficult to move.
Requires a lot of power to run
The CRT electron gun
“shoots” 3 electrons at
the screen representing
the amount of red,
green and blue for the
pixel
10. CRT- Cathode Ray Tube
10
Common screen sizes are 15, 17,
19,21, and 22 inches.
A CRT monitor's viewable size is the
diagonal measurement of the actual
viewing area.
A 21-inch monitor have a viewable
size of 20 inches.
The popularity of CRT monitors
is declining
11. Types of monitors
11
LCD -Liquid Crystal Display
one of several types of “flat-panel” displays
contain fluorescent tubes that emit light waves to
liquid-crystal cells, sandwiched between two
sheets of material
When an electrical charge passes through the
cells, the cells twist, causing some light waves to
be blocked and allows others to pass through,
creating images on the display
forms output by solidifying liquid crystals
and “backlighting” the image with a light source
Disadvantages
Images can be difficult to see in bright light
Limited viewing angle
12. Main categories of LCD
12
Passive matrix LCD
relies on transistors to form a grid that define location of each
pixel
the color displayed by a pixel is determined by electricity at the
end of the row and at the top of the column
DISADVANTAGE – refresh rate is slow; limited viewing angle
proof is when you move the pointer too quickly, it
disappears(effect known as submarining); animated graphics is
blurry on this type
Active matrix LCD
assigns a transistors to each pixel
each pixel is turned on and off individually allowing rapid refresh
rate
Wider viewing angle throughTFT(Thin Film Transistor)
technology which employs four transistors per pixel
anotherTFTcalled organic LED (OLED), uses organic molecules
that produce an even brighter, easier-to-read display
13. Other Types of Monitors
13
1. Paper-white displays
Sometimes used by document designers such as desktop publishing
specialists, newspaper or magazine compositors, and other persons
who create high quality printed documents.
Produces a very high contrast between the monitor’s white
background and displayed text or graphics, which usually appear in
black.
2. Electroluminescent displays (ELDs)
Similar to LCD monitors but use a phosphorescent film held
between two sheets of glass.
A grid of wires sends current through the film to create an image
3. Plasma displays
Are created by sandwiching a special gas (such as neon or xenon)
between two sheets of glass.When gas is electrified, it glows
projecting the image.
Screen sizes up to 150 inches wide, richer colors, more expensive,
hang directly on a wall.
15. Categories of monitor by the way they display colors
15
1. Monochrome
Display only one color (such as green, amber, or white)
against a contrasting background, which is usually black.
Used for text-only displays where the user does not need to
see color graphics
2. Grayscale
Display varying intensities of gray (from a very light gray to black)
against a white or off-white background
Used in low-end portable systems , especially handheld computers
to keep costs down
3. Color
Can display between 16 colors and 16 million colors.
Most new monitors display in color. Many color monitors can be set to
work in monochrome or grayscale mode.
16. Comparing Monitors
16
1. Size
Affects how well you can see images.
Are measured diagonally, in inches, across the front of the
screen.
As a rule of thumb, buy the largest monitor you can afford.
Typical Display Sizes
sizes of LCD monitors are, 17,19,20,22,24,26,27inches;
some are 45 or 65 inches; most are widescreen,
Notebooks’ typical sizes of 14.1, 15.4, 17, and 20.1 inches.
Tablet PC screens range from 8.4 inches to 14.1 inches.
Ultra-Mobile PCs are 5 inches to 7 inches.
Portable media players from 1.5 inches to 3.5 inches.
Smartphones from 2.5 inches to 4.1 inches.
Digital camera range from 2.5 inches to 4 inches.
17. 17
2. Resolution
Determined by the number of pixels on the screen, a matrix.
The more pixels a monitor can display, the higher its resolution
and the clearer and sharper its images appear
As the resolution increases, the image on the screen gets smaller.
Higher settings are not always better, they can cause objects on
the screen to appear too small, resulting in eyestrain and
squinting.
For example, a monitor that has a 1440 X 900 resolution
displays up to 1440 pixels per row and 900 pixels per column,
for a total of 1,296,000 pixels to create a screen image.
Resulting to better sharpness or clarity of an image.
A recent study has shown that out of 6 million users surveyed,
nearly one-half use a 1024 X 768 screen resolution.
Comparing Monitors
18. Resolution
18
With LCD screens, a widescreen 19-inch LCD monitor typically has a
resolution of 1440 X 900, while a widescreen 22-inch has a resolution
of 1680 X 1050.
LCDs are set to a specific resolution, called the native resolution.
To change screen resolution,
1. right-click the desktop,
2. click Personalize on the shortcut menu,
3. click the Display Settings link,
4. make desired changes in the Display Settings dialog
box
19. 19
3. Refresh rate
Number of times per second that the electron guns scan every
pixel on the screen.
If the screen is not refreshed often enough, it appears to
flicker, and flicker is one of the main causes of eyestrain.
Refresh rate is measured in Hertz (Hz), or in cycles per second
If a monitor’s refresh rate is 100 Hz, it refreshes its pixels 100
times every second.
Sometimes referred to as Response time
Comparing Monitors
20. 20
4. Dot pitch
sometimes called pixel pitch
The distance between the like-colored phosphor dots of
adjacent pixels.
Is measured as a fraction of a millimeter (mm), and dot pitches
can range from .15 mm (very fine) to .40 mm or higher.
Average dot pitch on LCD monitors and screens should be .30
mm or lower.
The smaller the dot pitch, the finer and more detailed images
will appear on the monitor.
Text created with a smaller dot pitch is easier to read.
Advertisements normally specify a monitor's dot pitch or pixel
pitch.
Comparing Monitors
21. 21
5. Brightness
measured in nits.
a nit is a unit of visible light intensity equal to one candela
(formerly called candlepower) per square meter.
the candela is the standard unit of luminous intensity.
LCD monitors and screens today range from 250 to 550 nits.
the higher the nits, the brighter the images.
6. Contrast ratio
describes the difference in light intensity between the brightest
white and darkest black that can be displayed.
Contrast ratios today range from 500:1 to 2000:1.
Higher contrast ratios represent colors better.
Comparing Monitors
22. Standards
22
The aspect ratio defines a display's width relative to its
height.
A 2:1 aspect ratio, for example, means the display is
twice as wide as it is tall.
The aspect ratio for widescreen monitors is 16:lO.
Some display devices support multiple video standards.
23. Comparing Monitors
23
SVGA SuperVideo GraphicsArray 800 x 600 4:3
XGA Extended GraphicsArray 1024 x 768 4:3
SXGA Super XGA 1280 x 1024 5:4
WXGA Wide XGA 1280 x 1024 16:9
or 1366 x 768 16:10
UXGA Ultra XGA 1600 x 1200 4:3
WSXGA Wide Super XGA 1680 x 1050 16:10
WUXGA Wide Ultra XGA 1920 x 1200 16:10
WQXGA Wide Quad XGA 2560 x 1600 16:10
Wide (widescreen) video standard formats are preferable for
users who watch movies and play video games on the
computer.
24. Video cards
24
Also called the video controller
or the video adapter
Is an intermediary device between the CPU
and the monitor.
It contains the video-dedicated memory
and other circuitry necessary to send information to the monitor
for display on the screen.
To display the highest quality images, an LCD monitor should plug in
a DVI port, an HDMI port, or a DisplayPort.
A DVI (DigitalVideo Interface) port enables digital signals to
transmit directly to the LCD monitor.
An HDMI (High-Definition Media Interface) port combines
DVI with high-definition(HD) television and video.
The DisplayPort is an alternative to DVI that also supports HDMI.
standard monitor port
25. Video Display Terminology
25
Pixel
picture element (smallest unit of an image, basically a
single dot on the screen)
Resolution
number of pixels in the image
Common resolution size is 1024x768
Refresh rate
how often a CRT’s electron gun rescans
LCD displays do not use an electron gun, so do not
perform refreshing
26. 2. Printers
26
A printer is a peripheral
device that produces a
physical copy or hard copy
of the computer’s output.
27. Non-Impact Printers
27
A nonimpact printer forms characters and
graphics on a piece of paper without actually
striking the paper.
Some spray ink, while others use heat or pressure to create
images.
Commonly used nonimpact printers are:
ink-jet printers, photo printers, laser printers,
thermal printers, mobile printers, label and
postage printers, plotters, and large-format
printers.
28. Types of Non-Impact Printers
28
Inkjet printer, also called a
bubble-jet, makes characters
by inserting dots of ink onto
paper
Letter-quality printouts
Cost of printer is inexpensive
but ink is costly
Laser printer works like a
copier
Quality determined by dots
per inch (dpi) produced
Color printers available
Expensive initial costs but
cheaper to operate per page
Inkjet
Laser
29. Ink Jet Printer
29
Create an image directly on the paper
by spraying ink through tiny nozzles.
The only part that needs routine replacement is the ink cartridge.
The print head mechanism in an ink-jet printer contains ink-filled
cartridges. Each cartridge has fifty to several hundred small ink
holes or nozzles.
uses two or more ink cartridges: one containing black ink and the
other(s) containing colors.
Cartridges with black ink cost $15 to $30 each.
Color ink cartridge prices range from $20 to $35 each.
black ink cartridges typically print from 200 to 800 pages, and
color ink cartridges from 125 to 450 pages.
30. Ink Jet Printer
30
-pages per minute (ppm) it can print is from 12 to
36 ppm
Most ink-jet printers can print from 1200 to 4800 dpi.
the higher the dpi, the better the print quality.The
difference in quality becomes noticeable when the size
of the printed image increases.
31. Ink Jet Printer
31
Ink-jet printers also print on other materials such as envelopes,
labels, index cards, greeting card paper (card stock),
transparencies, and iron-onT-shirt transfers.
Many ink-jet printers include software for creating greeting
cards, banners, business cards, and letterhead.
Most ink-jet printers can print from 1200 to 4800 dpi.
Ink-jet printers are a popular type of color printer used in the
home.
32. Laser Printer
32
More expensive, faster, lower cost per page
Uses technology similar to that in photocopiers.
Toner – composed of tiny particles of ink, sticks to the drum
in the places the laser has charged.
Toner cartridge prices range from $50 to $170 for about
5,000 printed pages.
print in usually 1200 dpi for black-and-white printers and up
to 2400 dpi for color printers.
a laser printer for the small business user can have up to 768
MB of memory and a 40 GB hard disk.
- To print a full-page 1200-dpi photo, you need 64 MB of
memory in the printer.
33. Laser Printer
33
a laser printer for the small business user can have up to 768 MB of
memory and a 40 GB hard disk.
use software to interpret a page description language (PDL)
tells the printer how to arrange the contents of a printed page.
two common page description languages: PCL or PostScript.
Developed by HP, a leading printer manufacturer
PCL (Printer Control-Language) is a standard
printer language that supports the fonts and layout used in standard office
documents.
Professionals in the desktop publishing and graphic art fields commonly use
PostScript because it is designed for complex documents with intense graphics
and colors.
34. How a Black-and-White Laser Printer Works
34
/
Step 1
After the user sends an
instruction to print a
document, the drum rotates
as gears and rollers feed a
sheet of paper into the printer.
Step 3
The laser beam creates a
charge that causes toner to
stick to the drum.
Step 5
As the drum continues to
rotate and press against
the paper, the toner transfers
from the drum to the paper.
Step 2
A rotating mirror deflects a low-
powered
laser beam across the surface of a
drum.
Step 4
A set of rollers uses
heat and pressure to
fuse the toner
permanently to the paper.
35. Impact Printers
35
An impact printer forms characters and graphics on paper by striking a
mechanism against an inked ribbon that physically contacts the paper.
noisy because of this striking activity.
produce near letter quality (NLQ) output, a print quality less acceptable for
business letters.
Companies use them for routine jobs like printing labels, multipart forms
because they easily print through layers of paper.
Factories, warehouses, and retail counters use them because these printers
withstand dusty environments, vibrations, and extreme temperatures.
Two commonly used types of impact printers are dot-matrix printers and
line printers.
36. Dot Matrix Printers
36
Commonly used in workplaces
where physical impact with the
paper is important, such as when the
user is printing to carbon copy or
pressure sensitive forms.
Can produce sheets of plain text
very quickly.
Speed is measured in characters per
second (cps).
A dot-matrix printer produces
printed images when tiny pins
strike an inked
ribbon.
37. Line & Band Printers
37
Line Printer
Works like a dot matrix printer but uses a special wide print head that can
print an entire line of text at one time.
Do not offer high resolution but are incredibly fast.
Band Printers
Feature a rotating band embossed with alphanumeric characters.
To print a character, the machine rotates the band to the desired character,
then a small hammer taps the band pressing the character against a ribbon.
Very fast and very robust
38. Comparing Printers
38
1. Image Quality
Also known as print resolution
Usually measured in dots per inch (dpi)
The more dots per inch a printer can produce, the higher its image quality.
2. Speed
Measured in the number of pages per minute (ppm) the device can print
Most printers have different ppm ratings for text and graphics because
graphics generally take longer to print.
3. Initial Cost
The cost of new printers has fallen dramatically in recent years, while their
capabilities and speed have improved just as dramatically.
4. Cost of Operation
The cost of ink or toner and maintenance varies with the type of printer.
Many different types of printer paper are available too and the choice can
affect the cost of operation.
39. High-Quality Printers
39
1. Photo Printers
Work slowly; some can take two or four
minutes to create a printout.
Advantage: PictBridge enabled--can
print photos without a computer.
PictBridge - a standard technology that
allows you to print photos directly from
a digital camera by connecting a cable
from the digital camera to a USB port
on the printer or by an infrared
connection.
Many photo printers use ink-jet
technology. Printer prints photos in camera
when camera sits in docking
station.
40. High-Quality Printers
40
2.Thermal-Wax Printers
Used primary for presentation graphics and
handouts.
Create bold colors and have a low per-page
cost for printouts with heavy color
requirements, such as posters or book
covers
Operate with a ribbon coated with panels
of colored wax that melts and adheres to
plain paper as colored dots when passed
over a focused heat source.
Printing plastic labels for chemical
containers (because the cheaper types of
plastic would melt in a laser printer)
41. High-Quality Printers
41
3. Dye-Sublimation Printers
sometimes called a digital photo printer,uses heat to transfer
colored dye to specially coated paper.
create images that are of photographic quality
Used in Professional applications requiring high image
quality, such as photography studios, medical labs, and
security identification systems
These high-end
printers cost thousands
of dollars and print
images in a wide range
of sizes.
42. High-Quality Printers
42
4. Plotters
A plotter is a printer that uses a pen that moves over a large
revolving sheet of paper.
It is used in engineering, drafting, map making, and
seismology.
44. All-in-One Printers
44
Combine printing capabilities with scanning, photocopying, and
faxing capabilities.
Small, lightweight, and easy to use.
45. Audio Output: Sound Cards and
Speakers
45
Audio output is the ability of the computer to output sound.
Two components are needed:
Sound card – Plays contents of digitized
recordings
Speakers –Attach to sound card
46. Data Projectors
46
Data Projectors
Also called digital light projectors and video projectors
1. LCD Projectors - Liquid Crystal Display
– require the room to be darkened.They display blurry images in less-
than-optimal lighting conditions.
2. DLP Projectors - Digital Light Processing
– project brighter, crisper images. Can display clear images in normal
lighting conditions.