
Recommended
Recommended
More Related Content
Similar to 2Jubail University CollegeDepartment of Business Adm.docx
Similar to 2Jubail University CollegeDepartment of Business Adm.docx (12)
More from lorainedeserre
More from lorainedeserre (20)
Recently uploaded
Recently uploaded (20)
2Jubail University CollegeDepartment of Business Adm.docx
- 1. 2 Jubail University College Department of Business Administration Semester 392 Assignment No.: 2 Section No.: 201 Course Code: MIS 305 Course Name: Intelligent Support Systems in Business Student Name Student ID 1. Nejood Alshehri 36120067 2. Ghaida Alasman 36120311 3. Dhai Alotaibi 36120355 4. Fetoon Alhulais 36120019 Project Based Assignment
- 2. The Assignment Objective: This is a project-based assignment divided into two deliverables: theoretical and practical part. Each with 10% of your final grade. It aims to familiarize and expose students to the business intelligence tools and the four phases of the decision making process as well as improving students’ effective communication and team working skills. In addition, it helps expose students to tools and techniques that aid them in practically developing a DSS to solve a problem or take advantage of an opportunity based on the four phases of decision making process. Topic- A Business Case: Each group should identify particular opportunity or problem to be solved by any managerial level in Business. You need to follow the 4 phases of decision making process. Use any tool in M.S. Excel to help automate this decision. Your DSS should provide a correct answer to be given to managers or staff. Examples that could help you: · DSS to help HR answer Employees questions. · DSS to help Marketing and development department to increase customer satisfaction. Each group (of 3-4 members) create their own scenarios in relevance to their business case. Note that you need to consider the various users and existing operations as well as any new operations and functions for proper utilization of data and accurate decision making process. Practical Part (Submission on week 13):(10 %) This part focuses on the implementation phase of your DSS for the problem (opportunity) that you have identified in assignment 1. DSS Criteria: · You should use analytical tool and functions. · The design and format should be attractive yet clear. · Use visualization to easily analyze the results. · Develop two dashboards. Please ensure that you adhere to the dashboard design principles and guidelines.
- 3. · Keep intended users of your DSS in mind and ensure that you consider all the possible factors. · Identify the routine business functions and the management activities supported by your DSS. · Assume the business rules for the DSS users to follow and make sure to incorporate them. The required materials: (100 marks = 10%) A) CD containing the following: (60 marks) 1- Documentation: a. Assignment cover page and Tables of content b. Introduction: Brief introduction about the decision you will assist in. (2 mark) c. Content · This part shoud Breifly and consizly address all the work that you have done and assubsions you followed in preparing your DSS Implementation phase such as: · How the solution is implemented.(10 mark) · Explain the tools that you developed (10 mark) · The functions you used with a brief explanation of it (10 mark) · The dashboards. (20 mark) d. Conclusion · The results and benefits of using the BI system on the problem (opportunity) after the implementation? (2 mark) · Visualization to analyze the results. ( 3 mark ) · Future recommendation, if applicable. e. References and Resources (3 mark) 2- Appendixes · All the soft files of the database and BI software. · The presentation materials. B) The presentation of actual tool developed, in accord with the documentation. · This part is to be presented and explained “using examples” to the Instructor by the group members. Ensure that you are presenting a STORY( 30 marks)
- 4. Criteria Individual Knowledge Communication Skills Peer Evaluation Total Maximum Mark 10 10 10 30 C) Following guidelines (10 marks) Notes · Besides the presentation, you will be engaged in small group discussion about your assignment and work. Students will reflect on their work and their learning process throughout the project duration, what are the challenges and lesson learned. · Students who do not follow the dress code will not be allowed to present · Please note that each requirement carries marks, don’t neglect any point in the assignment. · Please do not overwrite; a proper concise explanation is enough. · Pay attention to the following format guidelines: · The project report (documentation) should address all the requirements concisely. · Using MSW 12 point Time New Romans font, MSW 14 points for heading. · Double spaced Line spacing for each paragraph. Standard format: 1" each margin End of Deliverable 2
- 5. Table of Content 1) Introduction 6 2) Content 7 3) Dashboards 9 3.1) Business Performance Dashboard 9 Employee turnover per country/city 10 The employee turnover by department by branch 11 The reasons for leaving 11 Absence Rate 11 3.2) Recognition Dashboard 12 The profit by project 13 Cost-Revenue ratio by project 13 Member evaluation by projects 14 Employees Evaluation 14 Self-Development Programs and the number of employees 15 3) Conclusion 15 4) References and Resources 16 5) Appendixes 17 1) Introduction Google is an American worldwide Internet and software organization. It is specialized in online searches, cloud computing, and promoting advertisement. Also, it has many employees. Google has extremely unique method for recruiting. It chooses their worker based on some special process for recruiting. Also, it spends more money on training their employee and focused on employing the most qualified individuals. Although, Google spends a lot of cash on recruiting
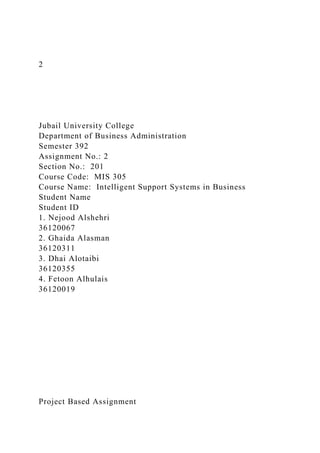
- 6. and training their worker, the rate of employee turnover has been strongly increased in recent years. Therefore, based on survey that was conducted in the previous proposal “Assignment one “help them discover the factors of the turnover and find ways and solutions to reduce them. In addition, through the model that shows the results of this survey, it turns out that boredom is the most significant factor leading to the turnover. Through these results some alternatives have been developed to reduce the employee turnover rate. 2) Content The problem of employee turnover in Google company was due to some factors as a result of a survey we have distributed to the workers in the company. The following figure shows the percentage of each factor (boredom at work, stress at work, lack of recognition, poor relationship with management and conflict) that lead the employees to leave the company. In our proposal we have discussed the possible alternatives that we could use to resolve the problem of employee turnover. In the decision phase we have concluded that the best possible solution alternative is implementing a program to schedule new activities such as workshops and job rotation and developing recognition system for the employees in Google company. This solution will solve the most significant factor which is the boredom at work as well as the other factor of lack of recognition. The implementation of the solution started with developing the needed database containing the important tables in Microsoft Excel that will be used in designing the dashboards. First table is Employee table that contains employees’ information such as employee ID, name, date of birth, position, gender, yeas of experience, salary and three kinds of evaluation (supervisor evaluation, peer evaluation and self-evaluation). Some functions have been used in this table. TODAY() function used to
- 7. calculate the age of each employee. AVERAGE() function has been used to calculate the average of the three types of evaluation. Also we used IF() function to specify which self- development program is deserved by which employee under some defined criteria. Second table is Branch table which include information such as branch ID, branch name, branch country and branch city. Also, there is a Department table with department ID and department name. An association table has been created between Branch table and Department table that contains different information for each department in each branch such as the chairperson and the turnover rates. Another table used is the Project table that contains each project information such as cost and profit. Team_Member table created to contain the information of all the members in all the projects assigned by Google company. After having our database completed, we used Tableau software program to link all these tables in order to create two dashboards. One of them concerned with employee job performance after implementing the solution and the other one will be used by the HR manager for the recognition system that is part of the proposed solution. 3) Dashboards 3.1) Business Performance Dashboard This dashboard will allow the HR manager to know the current status and percentages of employee turnover across different countries and cities. Also, it allows the manager to monitor the result of the efforts to reduce the turnover, so he/she can check if the solution is really working or not. Also, it provides the managers with detailed information about employee turnover by giving them precise percentages in each branch and department. Also, it provides other related information such as absence rate and the reasons for leaving the company. · Employee turnover per country/city This graph will provide the HR manager with a full picture of
- 8. all turnover rates per branches in different countries. The first layer shows the average employee turnover rate for each country. The second layer contains the turnover rate for each branch in every country. Assume that the manager wants to know in which the branch the average employee turnover rate is high and in which country? So, the geographic map will help the manager to figure out the in which country and in which specific branch. Therefore, heshe will be able to find out the reasons behind this increasing in turnover rate and the possible ways to reduce the employee turnover rate and increase the chance of employee staying in the company. · The employee turnover by department by branch This chart will show the pattern of the employee turnover rate by each department for main branches in different countries. Using this chart, the HR manager will be able to figure out the highest turnover rate by department by branch and find out the solutions to be reduced. Assume that the manager wants to see which department in Chicago country has the highest turnover rate? Bar chart will help, since it can be divided into colored segments with the departments placed in bottom. · The reasons for leaving This graph will provide the manager with accurate insight
- 9. about the percentage of reasons for leaving after we have implement the solutions. Then, the HR manager can compare the percentage of pie chart to the model of reasons we have developed in the proposal before implementing the solutions. So, the manager can realize that the percentage of boredom and lack of recognition becomes less, and the solution was effective, so the manager can work more to improve the solution to reduce turnover. Also, the chart can help the manager to know percentage of reasons for leaving for specific branch. So, we find the pie chartwill more suitable to present the relative proportion of reasons for leaving. · Absence Rate This chart will give the manager a complete picture of the absence rate of each department at one branch. The feature of this graph is linked to the " Employee Turnover by Department by Branch" that means by selecting any branch or department in " Employee Turnover by Department by Branch" will show the rate of absenteeism individually for the selected branch or department. So, this chart will help manager to discover which branch and which department have more absence rate to quickly solve that problem.3.2) Recognition Dashboard The recognition dashboard is our solution to the problem that help the HR manager to recognize the hard work of the employees. Google company has projects and those working in the project need to be recognized either by the profit, cost- revenue ratio or their evaluation within the team. Also, the employees with the highest average evaluation will be recognized for their efforts in the company. Also, the employees will be given self-development programs based on specified criteria and this will allow the employees to continue learning and acquiring new skills and by that they will be more satisfied.
- 10. · The profit by project In this graph, we used the packed bubble chart to represent the profit of each project. This chart allows the manager to reward the team of the most profitable project. The recognition by the project will encourage the team members to keep on the good work and will encourage the others whose project failed to work harder in the future. By this way, the employees will feel more valued and satisfied and the employee turnover rate will drop. · Cost-Revenue ratio by project To represent this, we used bar chart to allow the HR manager to compare the project more easily. This chart allows the manager to compare the projects that has different cost(capital) by using the cost-revenue ratio (sometimes it is called vertical analysis technique). So, the manager can reward the team of the most efficient project. Also, since the lower percentage means that the project is more efficient, we order the chart in ascending order. This type of recognition will increase the employee satisfaction and will give them a sense of growth. Also, it will encourage the good work in the future. · Member evaluation by projects To represent the idea, we used side-by-side bars to highlight the leader evaluation for each member in each project. This chart will help the HR manager when he rewards the team members, so he can will reward them according to their evaluation, the one with highest get the highest reward. Also, this chart helps the manager to spot those who exert minimum effort (social loafing). In this way, the members (especially the hard-workers) will feel satisfied because they will be treated according to their efforts and will make them feel valued and worthy. · Employees Evaluation This graph it will show the top five employees Based on three category of evaluation which are self-evaluation, peer- evaluation, supervisor-evaluation. The average of these three
- 11. categories will indicate which employee is from top five. So, that it will help manager to know which employees are active and then give them rewards and bounces. By that, those hard working employees will recognized and mores satisfied, so the chance of losing them will reduce. Also, this may motivate the employees to work harder in the future in order to be recognized and rewarded. · Self-Development Programs and the number of employees This graph will show four type of self-development programs and how many employees will receive self-Development programs. The process of selecting employees will be based on some standard. The first standard is when the employee's status is active, the rate of absence is below 3%, the average evaluation equal or above 4, and the years of experience are above 15 years, he/she will be rewarded by a one-year course of executive training in UK. Therefore, based on first standard the employee will get internal workshops. The other kinds of programs also have their own standard. The idea of this graph is to help the HR manager to manage the resources based on the number of employee and make employee feel of growth. Also, this chart will help the HR manager to encourage the others to get self-development programs. 3) Conclusion BI system is important because it help will managers to predict the result of a business action in future. Also, it is simpler to persuade business partners of progress. These two dashboards are advantageous for HR managers. They will help them to reduce turnover rate and will keep the most valued employees. Also, that will lead to increase employees’ satisfaction and improve their moral at workplace by providing them with different activities and workshops. In addition, it will help managers to make better decisions and manage HR resources in a best way. At the end , there is a future recommendation for the second dashboard for the graph" Self-
- 12. Development Programs and the number of employees" that is to add the name or the ID for each employee that will take self- development programs so that will help manager to know who will get self-development program and which type of this programs. 4) References and Resources · Microsoft Excel. · Tableau Software. Professional Edition, 2019.1.2. · Tableau Training & Tutorials. (n.d.). Retrieved from https://www.tableau.com/learn/training · Step by Step resource guide to learn Tableau. (n.d.). Retrieved from https://www.analyticsvidhya.com/learning-paths-data- science-business-analytics-business-intelligence-big- data/tableau-learning-path/ · Create A Map with Multiple Layers in Tableau. (2017, July 03). Retrieved from https://youtu.be/bwUj2NZHTC4 · Tableau - Bar Chart & Stacked Chart. (2018, January 23). Retrieved from https://youtu.be/gUSevSBvLwU · Tableau - Pie Chart. (2018, January 23). Retrieved from https://youtu.be/VwTKlCXy4RE · Tableau - Tree Maps. (2018, January 23). Retrieved from https://youtu.be/4Sx3VQg7LgI 5) Appendixes
- 13. Employee Turnover Boredom at work Stress at work Lack of recognition Poor relationships with management Conflicts 49% 17% 15% 11% 8% 2 Jubail University College Department of Business Administration Semester 392 Assignment No.: 2 Section No.: 201 Course Code: MIS 305 Course Name: Intelligent Support Systems in Business Student Name Student ID 1. Nejood Alshehri 36120067 2. Ghaida Alasman 36120311
- 14. 3. Dhai Alotaibi 36120355 4. Fetoon Alhulais 36120019 Project Based Assignment The Assignment Objective: This is a project-based assignment divided into two deliverables: theoretical and practical part. Each with 10% of your final grade. It aims to familiarize and expose students to the business intelligence tools and the four phases of the decision making process as well as improving students’ effective communication and team working skills. In addition, it helps expose students to tools and techniques that aid them in practically developing a DSS to solve a problem or take advantage of an opportunity based on the four phases of decision making process. Topic- A Business Case: Each group should identify particular opportunity or problem to be solved by any managerial level in Business. You need to follow the 4 phases of decision making process. Use any tool in M.S. Excel to help automate this decision. Your DSS should provide a correct answer to be given to managers or staff. Examples that could help you: · DSS to help HR answer Employees questions. · DSS to help Marketing and development department to increase customer satisfaction.
- 15. Each group (of 3-4 members) create their own scenarios in relevance to their business case. Note that you need to consider the various users and existing operations as well as any new operations and functions for proper utilization of data and accurate decision making process. Practical Part (Submission on week 13):(10 %) This part focuses on the implementation phase of your DSS for the problem (opportunity) that you have identified in assignment 1. DSS Criteria: · You should use analytical tool and functions. · The design and format should be attractive yet clear. · Use visualization to easily analyze the results. · Develop two dashboards. Please ensure that you adhere to the dashboard design principles and guidelines. · Keep intended users of your DSS in mind and ensure that you consider all the possible factors. · Identify the routine business functions and the management activities supported by your DSS. · Assume the business rules for the DSS users to follow and make sure to incorporate them. The required materials: (100 marks = 10%) A) CD containing the following: (60 marks) 1- Documentation: a. Assignment cover page and Tables of content b. Introduction: Brief introduction about the decision you will assist in. (2 mark) c. Content · This part shoud Breifly and consizly address all the work that you have done and assubsions you followed in preparing your DSS Implementation phase such as: · How the solution is implemented.(10 mark) · Explain the tools that you developed (10 mark) · The functions you used with a brief explanation of it (10 mark) · The dashboards. (20 mark)
- 16. d. Conclusion · The results and benefits of using the BI system on the problem (opportunity) after the implementation? (2 mark) · Visualization to analyze the results. ( 3 mark ) · Future recommendation, if applicable. e. References and Resources (3 mark) 2- Appendixes · All the soft files of the database and BI software. · The presentation materials. B) The presentation of actual tool developed, in accord with the documentation. · This part is to be presented and explained “using examples” to the Instructor by the group members. Ensure that you are presenting a STORY( 30 marks) Criteria Individual Knowledge Communication Skills Peer Evaluation Total Maximum Mark 10 10 10 30 C) Following guidelines (10 marks) Notes · Besides the presentation, you will be engaged in small group discussion about your assignment and work. Students will reflect on their work and their learning process throughout the project duration, what are the challenges and lesson learned. · Students who do not follow the dress code will not be allowed
- 17. to present · Please note that each requirement carries marks, don’t neglect any point in the assignment. · Please do not overwrite; a proper concise explanation is enough. · Pay attention to the following format guidelines: · The project report (documentation) should address all the requirements concisely. · Using MSW 12 point Time New Romans font, MSW 14 points for heading. · Double spaced Line spacing for each paragraph. Standard format: 1" each margin End of Deliverable 2 Table of Content 1) Introduction 6 2) Content 7 3) Dashboards 9 3.1) Business Performance Dashboard 9 Employee turnover per country/city 10 The employee turnover by department by branch 11 The reasons for leaving 11 Absence Rate 11 3.2) Recognition Dashboard 12 The profit by project 13 Cost-Revenue ratio by project 13 Member evaluation by projects 14 Employees Evaluation 14 Self-Development Programs and the number of employees 15
- 18. 3) Conclusion 15 4) References and Resources 16 5) Appendixes 17 1) Introduction Google is an American worldwide Internet and software organization. It is specialized in online searches, cloud computing, and promoting advertisement. Also, it has many employees. Google has extremely unique method for recruiting. It chooses their worker based on some special process for recruiting. Also, it spends more money on training their employee and focused on employing the most qualified individuals. Although, Google spends a lot of cash on recruiting and training their worker, the rate of employee turnover has been strongly increased in recent years. Therefore, based on survey that was conducted in the previous proposal “Assignment one “help them discover the factors of the turnover and find ways and solutions to reduce them. In addition, through the model that shows the results of this survey, it turns out that boredom is the most significant factor leading to the turnover. Through these results some alternatives have been developed to reduce the employee turnover rate. 2) Content The problem of employee turnover in Google company was due to some factors as a result of a survey we have distributed to the workers in the company. The following figure shows the percentage of each factor (boredom at work, stress at work, lack of recognition, poor relationship with management and conflict) that lead the employees to leave the company. In our proposal we have discussed the possible alternatives that we could use to resolve the problem of employee turnover. In
- 19. the decision phase we have concluded that the best possible solution alternative is implementing a program to schedule new activities such as workshops and job rotation and developing recognition system for the employees in Google company. This solution will solve the most significant factor which is the boredom at work as well as the other factor of lack of recognition. The implementation of the solution started with developing the needed database containing the important tables in Microsoft Excel that will be used in designing the dashboards. First table is Employee table that contains employees’ information such as employee ID, name, date of birth, position, gender, yeas of experience, salary and three kinds of evaluation (supervisor evaluation, peer evaluation and self-evaluation). Some functions have been used in this table. TODAY() function used to calculate the age of each employee. AVERAGE() function has been used to calculate the average of the three types of evaluation. Also we used IF() function to specify which self- development program is deserved by which employee under some defined criteria. Second table is Branch table which include information such as branch ID, branch name, branch country and branch city. Also, there is a Department table with department ID and department name. An association table has been created between Branch table and Department table that contains different information for each department in each branch such as the chairperson and the turnover rates. Another table used is the Project table that contains each project information such as cost and profit. Team_Member table created to contain the information of all the members in all the projects assigned by Google company. After having our database completed, we used Tableau software program to link all these tables in order to create two dashboards. One of them concerned with employee job performance after implementing the solution and the other one will be used by the HR manager for the recognition system that is part of the proposed solution.
- 20. 3) Dashboards 3.1) Business Performance Dashboard This dashboard will allow the HR manager to know the current status and percentages of employee turnover across different countries and cities. Also, it allows the manager to monitor the result of the efforts to reduce the turnover, so he/she can check if the solution is really working or not. Also, it provides the managers with detailed information about employee turnover by giving them precise percentages in each branch and department. Also, it provides other related information such as absence rate and the reasons for leaving the company. · Employee turnover per country/city This graph will provide the HR manager with a full picture of all turnover rates per branches in different countries. The first layer shows the average employee turnover rate for each country. The second layer contains the turnover rate for each branch in every country. Assume that the manager wants to know in which the branch the average employee turnover rate is high and in which country? So, the geographic map will help the manager to figure out the in which country and in which specific branch. Therefore, heshe will be able to find out the reasons behind this increasing in turnover rate and the possible ways to reduce the employee turnover rate and increase the chance of employee staying in the company.
- 21. · The employee turnover by department by branch This chart will show the pattern of the employee turnover rate by each department for main branches in different countries. Using this chart, the HR manager will be able to figure out the highest turnover rate by department by branch and find out the solutions to be reduced. Assume that the manager wants to see which department in Chicago country has the highest turnover rate? Bar chart will help, since it can be divided into colored segments with the departments placed in bottom. · The reasons for leaving This graph will provide the manager with accurate insight about the percentage of reasons for leaving after we have implement the solutions. Then, the HR manager can compare the percentage of pie chart to the model of reasons we have developed in the proposal before implementing the solutions. So, the manager can realize that the percentage of boredom and lack of recognition becomes less, and the solution was effective, so the manager can work more to improve the solution to reduce turnover. Also, the chart can help the manager to know percentage of reasons for leaving for specific branch. So, we find the pie chartwill more suitable to present the relative proportion of reasons for leaving. · Absence Rate This chart will give the manager a complete picture of the absence rate of each department at one branch. The feature of this graph is linked to the " Employee Turnover by Department by Branch" that means by selecting any branch or department in " Employee Turnover by Department by Branch" will show the rate of absenteeism individually for the selected branch or department. So, this chart will help manager to discover which branch and which department have more absence rate to quickly
- 22. solve that problem.3.2) Recognition Dashboard The recognition dashboard is our solution to the problem that help the HR manager to recognize the hard work of the employees. Google company has projects and those working in the project need to be recognized either by the profit, cost- revenue ratio or their evaluation within the team. Also, the employees with the highest average evaluation will be recognized for their efforts in the company. Also, the employees will be given self-development programs based on specified criteria and this will allow the employees to continue learning and acquiring new skills and by that they will be more satisfied. · The profit by project In this graph, we used the packed bubble chart to represent the profit of each project. This chart allows the manager to reward the team of the most profitable project. The recognition by the project will encourage the team members to keep on the good work and will encourage the others whose project failed to work harder in the future. By this way, the employees will feel more valued and satisfied and the employee turnover rate will drop. · Cost-Revenue ratio by project To represent this, we used bar chart to allow the HR manager to compare the project more easily. This chart allows the manager to compare the projects that has different cost(capital) by using the cost-revenue ratio (sometimes it is called vertical analysis technique). So, the manager can reward the team of the most efficient project. Also, since the lower percentage means that the project is more efficient, we order the chart in ascending order. This type of recognition will increase the employee satisfaction and will give them a sense of growth. Also, it will encourage the good work in the future.
- 23. · Member evaluation by projects To represent the idea, we used side-by-side bars to highlight the leader evaluation for each member in each project. This chart will help the HR manager when he rewards the team members, so he can will reward them according to their evaluation, the one with highest get the highest reward. Also, this chart helps the manager to spot those who exert minimum effort (social loafing). In this way, the members (especially the hard-workers) will feel satisfied because they will be treated according to their efforts and will make them feel valued and worthy. · Employees Evaluation This graph it will show the top five employees Based on three category of evaluation which are self-evaluation, peer- evaluation, supervisor-evaluation. The average of these three categories will indicate which employee is from top five. So, that it will help manager to know which employees are active and then give them rewards and bounces. By that, those hard working employees will recognized and mores satisfied, so the chance of losing them will reduce. Also, this may motivate the employees to work harder in the future in order to be recognized and rewarded. · Self-Development Programs and the number of employees This graph will show four type of self-development programs and how many employees will receive self-Development programs. The process of selecting employees will be based on some standard. The first standard is when the employee's status is active, the rate of absence is below 3%, the average evaluation equal or above 4, and the years of experience are above 15 years, he/she will be rewarded by a one-year course of executive training in UK. Therefore, based on first standard the employee will get internal workshops. The other kinds of programs also have their own standard. The idea of this graph is
- 24. to help the HR manager to manage the resources based on the number of employee and make employee feel of growth. Also, this chart will help the HR manager to encourage the others to get self-development programs. 3) Conclusion BI system is important because it help will managers to predict the result of a business action in future. Also, it is simpler to persuade business partners of progress. These two dashboards are advantageous for HR managers. They will help them to reduce turnover rate and will keep the most valued employees. Also, that will lead to increase employees’ satisfaction and improve their moral at workplace by providing them with different activities and workshops. In addition, it will help managers to make better decisions and manage HR resources in a best way. At the end , there is a future recommendation for the second dashboard for the graph" Self- Development Programs and the number of employees" that is to add the name or the ID for each employee that will take self- development programs so that will help manager to know who will get self-development program and which type of this programs. 4) References and Resources · Microsoft Excel. · Tableau Software. Professional Edition, 2019.1.2. · Tableau Training & Tutorials. (n.d.). Retrieved from https://www.tableau.com/learn/training · Step by Step resource guide to learn Tableau. (n.d.). Retrieved from https://www.analyticsvidhya.com/learning-paths-data- science-business-analytics-business-intelligence-big- data/tableau-learning-path/ · Create A Map with Multiple Layers in Tableau. (2017, July 03). Retrieved from https://youtu.be/bwUj2NZHTC4 · Tableau - Bar Chart & Stacked Chart. (2018, January 23). Retrieved from https://youtu.be/gUSevSBvLwU · Tableau - Pie Chart. (2018, January 23). Retrieved from https://youtu.be/VwTKlCXy4RE · Tableau - Tree Maps. (2018, January 23). Retrieved from
- 25. https://youtu.be/4Sx3VQg7LgI 5) Appendixes Employee Turnover Boredom at work Stress at work Lack of recognition Poor relationships with management Conflicts 49% 17% 15% 11% 8%
- 26. Jubail University College Department of Business Administration Semester 401 Assignment No.: 1 Section No.: 201 Course Code: MIS 305 Course Name: Intelligent Support Systems in Business Student Name Student ID 1. Batoul alshugaih 36120341 2. Afnan alshaheen 36120354 3.Manal alshaheen 36120050 Table of Content 1. Introduction 3 2. Background 3 3. Intelligence Phase 4 4. Design Phase 7 5. Choice Phase 8 6. Work Breakdown Structure 12 7. Conclusion 13 8. References 15 Improving LG’s Low Smartphone Market Share1. Introduction Life’s Good (LG) Company was established in a chemical manufacturer in South Korea in 1947. The organization has grown to become a multinational conglomerate that deals in four electronic,nine chemicals, and nine communication
- 27. services subsidiaries (So, 2019). The company is family-run and currently stands as the fourth-richest corporate institution "chaebol" in South Korea after Samsung, Hyundai, and SK (So, 2019). The corporation's vision is "to become the market- leading company with broad market recognition” (lg.com, n.d.). LG is an innovator and a manufacturer in technology and has more than 100 locations globally. The company made sales worth $54.4 billion in the fiscal year 2018. LG is a world- leading producer of TVs, refrigerators, air conditioners, washing machines, and mobile devices (lg.com, n.d.). Our objective is to design a decision support system (DSS) that makes LG Corporation increase its smartphone market share to match market leaders like Samsung and Apple. 2. Background LG is lagging in smartphone market share as compared to other multinational corporations. In 2018, a report on the global market share of smartphones indicated that there were a total of 3.6 billion mobile devices in use (Mourdoukoutas, 2018). Samsung held the highest market share of devices at 27%, that represented 893 million copies. Apple held a 24% share, and Oppo, Xiaomi, Huawei, and Vivo were in the third, fourth, fifth, and sixth positions (Mourdoukoutas, 2018). These companies represent Chinese manufacturing firms and hold a third of the world’s total smartphones market share (Mourdoukoutas, 2018). LG’s global smartphone market share falls below 3% in the category of “others” and continues to face stiff competition from market leaders like Samsung. The DSS platforms will help the company to establish new markets in emerging markets to increase its global share of the smartphone devices. DSS will help LG Corporation to make the best recommendations for reducing the market gap that exists between the company and other competitors like Samsung and Apple. DSS will create solutions on how the corporation can increase its global sales.3. Intelligence Phase After investing heavily in research and development of the company's smartphone devices, LG realized that the global impacts of its competitors shadowed its efforts. The company
- 28. did not achieve an increase in the global share of smartphone sales even though it has different agencies in more than 100 locations worldwide. Given that customers are not giving preferences to the offers provided by LG, the company realized that the problem might originate from the marketing strategies applied in the respective regions as well as the research and development strategies that are reflected in the final products. The increasing decrease in the total market share of smartphones suggests that LG Corporation is not meeting the needs and preferences of many customers around the world. Also, there is an indication that competitors are meeting the changing trends and demands of the modern marketplace, hence the need to alter the company’s customer perceptions for its products. LG Corporation needs to find solutions to the problems facing the smartphone products category. The issues will be broken down into smaller details for more straightforward selection and execution of strategies. The company needs to evaluate answers and implications of the following research questions: · What are the significant concerns raised by customers around the world about LG smartphones? · Why do products offered by competitors stand out better than LG’s offerings? · Is the company investing enough in the promotion of its smartphone product segment? · Does the research and development department consider the changing needs and preferences of customers in designing new smartphones? The marketing department of the company is responsible for ensuring that the sales of the organization are increasing and new strategies of market penetration are developed. Surveys conducted worldwide show loopholes in the marketing techniques applied by LG, and the company should coordinate with the relevant professionals to develop solutions. The suggestions on improvement may be submitted to the head of marketing who compiles a report to the board of directors for
- 29. approval. The senior management team may approve the recommendations or offer better insights on streamlining the performance of the marketing department of the corporation. The decision-making process in the project will utilize a semi- structured approach. The decisions made by the company to solve the issue of low market share may result in additional risks and losses. However, the recommendations are vital to revamping sales for smartphones. The company must act swiftly to attract the attention of customers through new product promotion techniques. Also, the R&D department may include new properties that make the company's devices to gain massive preferences from the buyers. The surveys may help determine the pertinent issues that limit the sales and the potential opportunities for product development. LG may consider using the DSS software in decision-making processes to bolster the sales output and customers’ satisfaction. Given the complexity of highlighting the problems and developing sound solutions, the company needs an alternative that limits levels of risk as high as possible and saves the time required to respond to the situation. The software incorporates efficiency in decision-making and bolsters the cognitive potential of managers (Guo & Diaz Lopez, 2013). The amount of data collected from customers in different countries is large and cannot be processed and analyzed manually. DSS offers a tool for analyzing extensive data collected from customers to make sound decisions that reflect the concerns of the buyers in different markets. DSS improves communication between employees, managers, and senior management. As explained by Alshibly (2015), DSS improves communication in organizations and enhances satisfaction in the decisions made. The issue of low market share for LG smartphones calls for immediate action from the marketing managers and the board of directors. The incorporation of technology in decision-making reduces the time taken to make recommendations. Thus, DSS is time
- 30. conscious and allows for the analysis of different marketing scenarios in a limited duration (Alshibly, 2015). DSS allows for real-time sharing of data between different departments. For instance, regional marketing managers can share data on monthly customers' responses to a specific device model with the R&D manager. The information allows for immediate recall in case there is a problem with some smartphone models. Secondly, the data mining feature of the DSS provides data on customer responses on new products in the market or the impact of a marketing campaign for a product (Alshibly, 2015). DSS directly captures customers’ data on response to an ad and the feedback provided in surveys on how to improve the performance of the brand (Chan et al., 2016). Feedback from customers is vital to understanding the differences between the product features provided by Samsung and Apple as compared to LG’s offers. From the DSS data reports, managers will determine the rate at which customer loyalty is declining in the markets formerly held by LG. Thus, DSS helps managers and LG’s top management to respond to low market share by devising appropriate plans (Chan et al., 2016). DSS will help LG in collecting vital data on products’ performance in markets dominated by industry leaders like Samsung and Apple. The data collected may include the price preferences per item categories, design, feature considerations, and after-sales services. The information defines the strategies employed in increasing the smartphone market share held by LG Corporation worldwide. 4. Design Phase Several alternatives can be applied to develop a strategy for improving the smartphone market share for LG. The suggested solutions have positive impacts on reducing the low market share of smartphones. Firstly, LG Corporation should offer customers the liberty of choice by providing different products with prices reflecting the purchasing powers of all the customers in the respective markets. Manufacturing smartphones that consider the needs of
- 31. all the potential buyers help in creating brand awareness and loyalty. Customers need variety from companies that allows them to get specific devices depending on their abilities to spend money. Secondly, LG should increase its number of distributors worldwide as well its online presence about the offers on smartphones. Increasing the number of stores and distribution centers throughout the world increases sales potential. Many consumers prefer checking products online before visiting the vendors' stores. Thus, LG Corporations should consider the approach. Thirdly, LG should consider investing more capital toward product promotion and marketing. Spending on brand awareness increases customer awareness and the possibility of consumers giving preference to the products the company offers. Features, advantages, and benefits of the smartphones determine the response of the potential buyers. Fourthly, the R&D department of the company should emulate the designs and features that modern customers prefer in smartphones. The section should reflect on what market leaders like Samsung, Huawei, and Apple offer that LG fails to provide to the buyers. The strategy may require additional capital investment and an overhaul of the current production techniques. The strategies chosen by the company would depend on whether the location is a new market or an existing market for the company. For instance, a product in a current market may be sold at a 20% discount while the same item may be sold at 100% selling price as buyers are trying the brand for the first time. Existing markets call for product modifications for consumers to change preferences about a brand. However, in the emerging or new markets, LG may sell its old smartphone models or conduct product diversification to gain the loyalty of customers.5. Choice Phase LG Corporation faces a low market share of smartphones globally. The company needs to improve its product offerings to
- 32. attract more customers. The current need at the organization concerns the desire to gain increased sales for its smartphones to match the numbers posted by market leaders like Samsung and Apple. Increasing the market share of the products would present specific benefits to different stakeholders at the company. Benefits The use of the DSS software is deemed as a potential key to unlock numerous challenges faced by LG Corporation. The software will bolster customer relationship management at the organization. Customers value firms that grant them opportunities to provide their views on how they perceive products. LG will benefit by improving the bond with its customers. Customers will be provided with regular feedback and opportunities to take part in surveys for the long-term improvement of the offers they get from the company. Buyers will get opportunities to be part of the corporation's loyal team and get discounts on membership. LG's improvement in the products may lead to an increase in the number of loyal customers. Increased referrals from this group of stakeholders will ultimately increase the company's sales. Thus, the company will benefit from increased sales and customers from need satisfaction. Beneficiaries LG Corporation and its customers will benefit from the DSS software implementation project. The tool will help the organization’s managers and top management in making sound decisions concerning the low market share of smartphones. Given that customer satisfaction and increased market share are interrelated, the fulfillment of the company's need to reduce the market share gap will generate customer satisfaction. The success of LG in meeting its sales objective relies on how well the company utilizes the DSS software to understand the preferences and changing demands of customers in the modern marketplace. Customer satisfaction remains the primary goal of many
- 33. start-ups and established multinational corporations. Thus, the long-term success of a firm relies on meeting the needs of customers throughout its operations. The profit-making motive of a company may conflict with its intention to make its buyers happy. However, for LG to increase the market share margin, it needs to prioritize meeting its customer preferences on smartphones. After we analyzed the sets of alternatives that LG may use to solve the problem, we decided that the first and fourth options are the most ideal. Providing diversity and affordability is highly valued by customers. Also, improving the products through R&D ensures that the quality matches the ones provided by the competition. A descriptive model will be applied in evaluating the validity of the decisions made. The "what-if" analysis function will be used to determine the effect of discounts on customers in the existing markets. The strategy will be used to assess how customers respond to the new smartphones developed through R&D. The "what-if" function will also determine the impact of newly manufactured handsets in emerging markets on emerging markets. Reducing the prices of LG smartphones and providing variety in LG's current 100 locations may increase the market share. Similarly, the company may decide to sell newly designed smartphones in new markets and compared the performance of the different products in the respective markets. Positive returns in new markets would suggest that customers need up-to-date modern designs of the handsets the beat to conform to the offers received from rival firms. The assessment of the alternatives suggests that option one and four are the best alternatives for LG Corporation. The first option indicates that the company should develop different products at different prices. Creating offers that accommodate the needs of many buyers in a specific market suggests that a company is conscious of the demands of the marketplace. Brand awareness would increase since many people would be able to afford the smartphones offered by LG. The company may not
- 34. gain the intended profit margin in the short-run. However, the number of loyal customers would increase in the long-run. The fourth alternative suggests that the R&D department at LG should design new smartphone models that reflect the preferences of buyers as practiced by the competitors. The majority of consumers like uniqueness, and many buyers today are techno-savvy. Providing these components in the market may change the reputation of the company's products. DSS software offers survey data to developers that may prove to change the way customers perceive the brand in the marketplace. The second and third alternatives advocated for aggressive marketing techniques and increased the production of the products. These options would have a minimal impact on changing the way consumers perceive the corporation's products. Where products have been considered to have low quality in the past, increasing the production would only lead to additional losses. Similarly, increased advertising may only have a limited impact on buyers. Given discounts for the same products may not generate the desired profit to keep the product line effectively running for the company. Implementing the first and the fourth solutions change the negative publicity, rebrand the products, and lures buyers into trying the new offers in the market. Several business intelligence tools are applicable in the case of LG. The following tools are appropriate: · Microsoft Excel: The component is useful in recording, analyzing, evaluation, and visualization of data. Excel has formulas and functions that are critical in making sound calculations and decisions. · Clear Analytics: The tool allows the performance of analysis on an Excel-based platform. It will enable the publication of data in cloud-based systems, online, and on mobile gadgets. · Tableau Software: This business intelligence tool permits data visualization and comprehension. The software has a drag-and- drop function, easy to navigate, and allows data analysis.
- 35. · Micro Strategy: The tool provides a dashboard function and high-spend data displays. It is critical in the assessment of market opportunities and trends. It also allows for the evaluation of a firm's productivity. According to our evaluation, Tableau is the best business intelligence tool. The software permits data sharing across PCs and mobile devices without the need for programming or format conversion. The item allows users to connect to a database as well as dashboard creation easily. It guarantees security at different levels, interactivity, and constant updates. 6. Work Breakdown Structure Tasks Responsible member Time needed to complete the task Introduction Manal 1 Day Background Manal 1 Day Intelligence phase · Providing a General description of the decision situation Batool 1 Day · What type of decision and why? Batool 1 Day · Why there is a need for a DSS instead of some other systems? Batool 1 Day Design phase · Identifying possible alternatives Afnan 2 Day Choice phase
- 36. · Clarifying the business needs and the expected benefits and Beneficiaries Afnan 1 Day · Choosing the best solution to be implemented Afnan 2 Days · The model(s) which will be used along with any functions All group member 2 Day · Choosing the BI tool with a justification All group member 2 Day Conclusion Manal 1 Day Formatting the report 1 Day7. Conclusion LG Corporation can use the DSS software to collect data on the problem of low smartphone market share it faces. The project determined that the company should reduce its selling price on its smartphones and offer variety as a way of revamping its market share in more than 100 locations worldwide. Secondly, the R&D department of the company should use the survey collected through the DSS system to develop new designs of smartphones that reflect customer preferences. LG can use product diversification strategy, and variety in price offers to win customer loyalty and increase its sales. The implementation of the solutions will lead to customer satisfaction and the development of new perceptions of LG smartphones. In the long-run, the gap that exists between the market leader- Samsung and LG will significantly narrow. LG needs to remain relevant in its production techniques by considering customer views are vital components of change and adaptation in the marketplace.
- 37. 8. References · Alshibly, H.H., 2015. Investigating the decision support system (DSS) success: A partial least squares structural equation modeling approach. Journal of Business Studies Quarterly, 6(4), p.56. · Chan, S.H., Song, Q., Sarker, S., and Plumlee, R.D., 2017. Decision support system (DSS) use and decision performance: DSS motivation and its antecedents. Information & Management, 54(7), pp.934-947. · Guo, X. and Díaz López, A., 2013. Mobile decision support system usage in organizations. · Life’s Good, n.d. Company information [Online]. Retrieved November 7, 2018, from https://www.lg.com/global/investor-relations/company-info · Mourdoukoutas, M., September 13, 2018. Samsung beats Apple in the global smartphone market as Chinese brands close in [Online]. Retrieved November 7, 2018 from https://www.forbes.com/sites/panosmourdoukoutas/2018/09/13/s amsung-beats-apple-in-the-global-smartphone-market-as- chinese-brands-close-in/#3f72309a697d · So, W., September 2019. South Korea’s LG Group – Statistics
- 38. and facts [Online]. Retrieved November 7, 2018, from https://www.statista.com/topics/4818/lg-corporation-of-south- korea/ Page 1 of 15 Jubail University College Department of Business Administration Semester 401 Assignment No.: 1 & 2 Section No.: Course Code: MIS 305 Course Name: Intelligent Support Systems in Business Student Name Student ID 1. 2. 3. 4. 5.
- 39. Project Based Assignment The Assignment Objective: This is a project-based assignment divided into two deliverables: theoretical and practical part. Each with 10% of your final grade. It aims to familiarize and expose students to the business intelligence tools and the four phases of the decision making process as well as improving students’ effective communication and team working skills. In addition, it helps expose students to tools and techniques that aid them in practically developing a DSS to solve a problem or take advantage of an opportunity based on the four phases of decision making process. Topic- A Business Case: Each group should identify particular opportunity or problem to be solved by any managerial level in Business. You need to follow the 4 phases of decision making process. Use any tool in M.S. Excel to help automate this decision. Your DSS should provide a correct answer to be given to managers or staff. Examples that could help you: · DSS to help HR answer Employees questions. · DSS to help Marketing and development department to increase customer satisfaction. Each group (of 3-4 members) create their own scenarios in relevance to their business case. Note that you need to consider the various users and existing operations as well as any new operations and functions for proper utilization of data and
- 40. accurate decision making process. Theoretical Part – Project Proposal (Submission on week 6): (10 %) 1) Deliverables and marks allocation: (100 marks = 10%) · a Written Report due in Week 6 and should include: ( 100 marks ) a. Profasional Assignment Cover page b. Tables of content. ( 5 marks ) c. Proposed Project Title d. Introduction: covering their aim at the end of the assignment ( 5 mark) e. Report’s body should include the following : i. A general background for your DSS project ii. In the Intelligence phase ensure: (20 mark) · Providing a General description of the decision situation, i.e., what is the decision circumstances in which the decision is made? · What type of decision and why? Why there is a need for a DSS instead of some other systems? · Hint: “The final result should properly identified the right factors” iii. Design phase: ( 15 mark ) · Identify all the possible alternatives which will affect your decision. iv. Choice phase: ( 15 mark) · Provide a clear articulation of the business need.The expected benefits and beneficiaries · The model(s) which will be used along with any functions · What are the different BI (tools) solutions that could be implemented to solve the problem (opportunity)? Which one will you use? The reasons behind selecting specific BI solution f. Work breakdown structure(WBS) identifying the tasks that need to be completed to develop the DSS along with the task allocation for each team member along with the project leader. (20 mark) g. Conclusions.( 5 mark )
- 41. h. Write your list of References at least 3 refernces using Harvard style . ( 5 mark) 2) Deadline: · A soft of the report submitted on week 7 Sunday 1. The softcopy to be submitted via blackboard based on the deadline. Notes: 1- It is a group assignment, 3-4 students in each group. 2- Ensure originality of the idea and uniqueness. 3- Each student must work to progress both, the team and individual aspects of the assignment tasks. 4- Pay attention to the following format guidelines (10 marks) a. The report should include 5 to 10 pages (around 2000 -2500 words). b. Using MSW 12 point Time New Romans font, MSW 14 points for heading. c. Double spaced Line spacing for each paragraph. Standard format: 1" each margin 5- Attaching the original copies of references. 6- Submit a softcopy of the report. 7- Ensure originality! Plagiarism is not allowed. Assignment will be rejected for each Plagiarized paragraph. End of Deliverable 1 Practical Part (Submission on week 13):(10 %) This part focuses on the implementation phase of your DSS for the problem (opportunity) that you have identified in assignment 1. DSS Criteria: · You should use analytical tool and functions. · The design and format should be attractive yet clear. · Use visualization to easily analyze the results. · Develop two dashboards. Please ensure that you adhere to the dashboard design principles and guidelines. · Keep intended users of your DSS in mind and ensure that you consider all the possible factors.
- 42. · Identify the routine business functions and the management activities supported by your DSS. · Assume the business rules for the DSS users to follow and make sure to incorporate them. The required materials: (100 marks = 10%) A) Report contains the following: (60 marks) 1- Documentation: a. Assignment cover page and Tables of content b. Introduction: Brief introduction about the decision you will assist in. (2 mark) c. Content · This part shoud Breifly and consizly address all the work that you have done and assubsions you followed in preparing your DSS Implementation phase such as: · How the solution is implemented.(10 mark) · Explain the tools that you developed (10 mark) · The functions you used with a brief explanation of it (10 mark) · The dashboards. (20 mark) d. Conclusion · The results and benefits of using the BI system on the problem (opportunity) after the implementation? (2 mark) · Visualization to analyze the results. ( 3 mark ) · Future recommendation, if applicable. e. References (3 mark) 2- Appendixes · All the soft files of the database and BI software. · The presentation materials. B) The presentation of actual tool developed, in accord with the documentation. · This part is to be presented and explained “using examples” to the Instructor by the group members. Ensure that you are presenting a STORY( 40 marks) Criteria Individual
- 43. Knowledge Communication Skills Peer Evaluation Total Maximum Mark 20 10 10 40 C) Following guidelines (10 marks) Notes · Besides the presentation, you will be engaged in small group discussion about your assignment and work. Students will reflect on their work and their learning process throughout the project duration, what are the challenges and lesson learned. · Students who do not follow the dress code will not be allowed to present · Please note that each requirement carries marks, don’t neglect any point in the assignment. · Please do not overwrite; a proper concise explanation is enough. · Pay attention to the following format guidelines: · The project report (documentation) should address all the requirements concisely. · Using MSW 12 point Time New Romans font, MSW 14 points for heading. · Double spaced Line spacing for each paragraph. Standard format: 1" each margin End of Deliverable 2 Page 5 of 6
- 44. Jubail University College Department of Business Administration Semester 401 Assignment No.: 1 Section No.: 201 Course Code: MIS 305 Course Name: Intelligent Support Systems in Business Student Name Student ID 1. Batoul alshugaih 36120341 2. Afnan alshaheen 36120354 3.Manal alshaheen 36120050 Table of Content 1. Introduction 3 2. Background 3 3. Intelligence Phase 4 4. Design Phase 7 5. Choice Phase 8 6. Work Breakdown Structure 12 7. Conclusion 13 8. References 15 Improving LG’s Low Smartphone Market Share1. Introduction Life’s Good (LG) Company was established in a chemical
- 45. manufacturer in South Korea in 1947. The organization has grown to become a multinational conglomerate that deals in four electronic,nine chemicals, and nine communication services subsidiaries (So, 2019). The company is family-run and currently stands as the fourth-richest corporate institution "chaebol" in South Korea after Samsung, Hyundai, and SK (So, 2019). The corporation's vision is "to become the market- leading company with broad market recognition” (lg.com, n.d.). LG is an innovator and a manufacturer in technology and has more than 100 locations globally. The company made sales worth $54.4 billion in the fiscal year 2018. LG is a world- leading producer of TVs, refrigerators, air conditioners, washing machines, and mobile devices (lg.com, n.d.). Our objective is to design a decision support system (DSS) that makes LG Corporation increase its smartphone market share to match market leaders like Samsung and Apple. 2. Background LG is lagging in smartphone market share as compared to other multinational corporations. In 2018, a report on the global market share of smartphones indicated that there were a total of 3.6 billion mobile devices in use (Mourdoukoutas, 2018). Samsung held the highest market share of devices at 27%, that represented 893 million copies. Apple held a 24% share, and Oppo, Xiaomi, Huawei, and Vivo were in the third, fourth, fifth, and sixth positions (Mourdoukoutas, 2018). These companies represent Chinese manufacturing firms and hold a third of the world’s total smartphones market share (Mourdoukoutas, 2018). LG’s global smartphone market share falls below 3% in the category of “others” and continues to face stiff competition from market leaders like Samsung. The DSS platforms will help the company to establish new markets in emerging markets to increase its global share of the smartphone devices. DSS will help LG Corporation to make the best recommendations for reducing the market gap that exists between the company and other competitors like Samsung and Apple. DSS will create solutions on how the corporation can increase its global sales.3. Intelligence Phase
- 46. After investing heavily in research and development of the company's smartphone devices, LG realized that the global impacts of its competitors shadowed its efforts. The company did not achieve an increase in the global share of smartphone sales even though it has different agencies in more than 100 locations worldwide. Given that customers are not giving preferences to the offers provided by LG, the company realized that the problem might originate from the marketing strategies applied in the respective regions as well as the research and development strategies that are reflected in the final products. The increasing decrease in the total market share of smartphones suggests that LG Corporation is not meeting the needs and preferences of many customers around the world. Also, there is an indication that competitors are meeting the changing trends and demands of the modern marketplace, hence the need to alter the company’s customer perceptions for its products. LG Corporation needs to find solutions to the problems facing the smartphone products category. The issues will be broken down into smaller details for more straightforward selection and execution of strategies. The company needs to evaluate answers and implications of the following research questions: · What are the significant concerns raised by customers around the world about LG smartphones? · Why do products offered by competitors stand out better than LG’s offerings? · Is the company investing enough in the promotion of its smartphone product segment? · Does the research and development department consider the changing needs and preferences of customers in designing new smartphones? The marketing department of the company is responsible for ensuring that the sales of the organization are increasing and new strategies of market penetration are developed. Surveys conducted worldwide show loopholes in the marketing techniques applied by LG, and the company should coordinate
- 47. with the relevant professionals to develop solutions. The suggestions on improvement may be submitted to the head of marketing who compiles a report to the board of directors for approval. The senior management team may approve the recommendations or offer better insights on streamlining the performance of the marketing department of the corporation. The decision-making process in the project will utilize a semi- structured approach. The decisions made by the company to solve the issue of low market share may result in additional risks and losses. However, the recommendations are vital to revamping sales for smartphones. The company must act swiftly to attract the attention of customers through new product promotion techniques. Also, the R&D department may include new properties that make the company's devices to gain massive preferences from the buyers. The surveys may help determine the pertinent issues that limit the sales and the potential opportunities for product development. LG may consider using the DSS software in decision-making processes to bolster the sales output and customers’ satisfaction. Given the complexity of highlighting the problems and developing sound solutions, the company needs an alternative that limits levels of risk as high as possible and saves the time required to respond to the situation. The software incorporates efficiency in decision-making and bolsters the cognitive potential of managers (Guo & Diaz Lopez, 2013). The amount of data collected from customers in different countries is large and cannot be processed and analyzed manually. DSS offers a tool for analyzing extensive data collected from customers to make sound decisions that reflect the concerns of the buyers in different markets. DSS improves communication between employees, managers, and senior management. As explained by Alshibly (2015), DSS improves communication in organizations and enhances satisfaction in the decisions made. The issue of low market share for LG smartphones calls for immediate action from the
- 48. marketing managers and the board of directors. The incorporation of technology in decision-making reduces the time taken to make recommendations. Thus, DSS is time conscious and allows for the analysis of different marketing scenarios in a limited duration (Alshibly, 2015). DSS allows for real-time sharing of data between different departments. For instance, regional marketing managers can share data on monthly customers' responses to a specific device model with the R&D manager. The information allows for immediate recall in case there is a problem with some smartphone models. Secondly, the data mining feature of the DSS provides data on customer responses on new products in the market or the impact of a marketing campaign for a product (Alshibly, 2015). DSS directly captures customers’ data on response to an ad and the feedback provided in surveys on how to improve the performance of the brand (Chan et al., 2016). Feedback from customers is vital to understanding the differences between the product features provided by Samsung and Apple as compared to LG’s offers. From the DSS data reports, managers will determine the rate at which customer loyalty is declining in the markets formerly held by LG. Thus, DSS helps managers and LG’s top management to respond to low market share by devising appropriate plans (Chan et al., 2016). DSS will help LG in collecting vital data on products’ performance in markets dominated by industry leaders like Samsung and Apple. The data collected may include the price preferences per item categories, design, feature considerations, and after-sales services. The information defines the strategies employed in increasing the smartphone market share held by LG Corporation worldwide. 4. Design Phase Several alternatives can be applied to develop a strategy for improving the smartphone market share for LG. The suggested solutions have positive impacts on reducing the low market share of smartphones. Firstly, LG Corporation should offer customers the liberty of
- 49. choice by providing different products with prices reflecting the purchasing powers of all the customers in the respective markets. Manufacturing smartphones that consider the needs of all the potential buyers help in creating brand awareness and loyalty. Customers need variety from companies that allows them to get specific devices depending on their abilities to spend money. Secondly, LG should increase its number of distributors worldwide as well its online presence about the offers on smartphones. Increasing the number of stores and distribution centers throughout the world increases sales potential. Many consumers prefer checking products online before visiting the vendors' stores. Thus, LG Corporations should consider the approach. Thirdly, LG should consider investing more capital toward product promotion and marketing. Spending on brand awareness increases customer awareness and the possibility of consumers giving preference to the products the company offers. Features, advantages, and benefits of the smartphones determine the response of the potential buyers. Fourthly, the R&D department of the company should emulate the designs and features that modern customers prefer in smartphones. The section should reflect on what market leaders like Samsung, Huawei, and Apple offer that LG fails to provide to the buyers. The strategy may require additional capital investment and an overhaul of the current production techniques. The strategies chosen by the company would depend on whether the location is a new market or an existing market for the company. For instance, a product in a current market may be sold at a 20% discount while the same item may be sold at 100% selling price as buyers are trying the brand for the first time. Existing markets call for product modifications for consumers to change preferences about a brand. However, in the emerging or new markets, LG may sell its old smartphone models or conduct product diversification to gain the loyalty of
- 50. customers.5. Choice Phase LG Corporation faces a low market share of smartphones globally. The company needs to improve its product offerings to attract more customers. The current need at the organization concerns the desire to gain increased sales for its smartphones to match the numbers posted by market leaders like Samsung and Apple. Increasing the market share of the products would present specific benefits to different stakeholders at the company. Benefits The use of the DSS software is deemed as a potential key to unlock numerous challenges faced by LG Corporation. The software will bolster customer relationship management at the organization. Customers value firms that grant them opportunities to provide their views on how they perceive products. LG will benefit by improving the bond with its customers. Customers will be provided with regular feedback and opportunities to take part in surveys for the long-term improvement of the offers they get from the company. Buyers will get opportunities to be part of the corporation's loyal team and get discounts on membership. LG's improvement in the products may lead to an increase in the number of loyal customers. Increased referrals from this group of stakeholders will ultimately increase the company's sales. Thus, the company will benefit from increased sales and customers from need satisfaction. Beneficiaries LG Corporation and its customers will benefit from the DSS software implementation project. The tool will help the organization’s managers and top management in making sound decisions concerning the low market share of smartphones. Given that customer satisfaction and increased market share are interrelated, the fulfillment of the company's need to reduce the market share gap will generate customer satisfaction. The success of LG in meeting its sales objective relies on how well the company utilizes the DSS software to understand the
- 51. preferences and changing demands of customers in the modern marketplace. Customer satisfaction remains the primary goal of many start-ups and established multinational corporations. Thus, the long-term success of a firm relies on meeting the needs of customers throughout its operations. The profit-making motive of a company may conflict with its intention to make its buyers happy. However, for LG to increase the market share margin, it needs to prioritize meeting its customer preferences on smartphones. After we analyzed the sets of alternatives that LG may use to solve the problem, we decided that the first and fourth options are the most ideal. Providing diversity and affordability is highly valued by customers. Also, improving the products through R&D ensures that the quality matches the ones provided by the competition. A descriptive model will be applied in evaluating the validity of the decisions made. The "what-if" analysis function will be used to determine the effect of discounts on customers in the existing markets. The strategy will be used to assess how customers respond to the new smartphones developed through R&D. The "what-if" function will also determine the impact of newly manufactured handsets in emerging markets on emerging markets. Reducing the prices of LG smartphones and providing variety in LG's current 100 locations may increase the market share. Similarly, the company may decide to sell newly designed smartphones in new markets and compared the performance of the different products in the respective markets. Positive returns in new markets would suggest that customers need up-to-date modern designs of the handsets the beat to conform to the offers received from rival firms. The assessment of the alternatives suggests that option one and four are the best alternatives for LG Corporation. The first option indicates that the company should develop different products at different prices. Creating offers that accommodate the needs of many buyers in a specific market suggests that a
- 52. company is conscious of the demands of the marketplace. Brand awareness would increase since many people would be able to afford the smartphones offered by LG. The company may not gain the intended profit margin in the short-run. However, the number of loyal customers would increase in the long-run. The fourth alternative suggests that the R&D department at LG should design new smartphone models that reflect the preferences of buyers as practiced by the competitors. The majority of consumers like uniqueness, and many buyers today are techno-savvy. Providing these components in the market may change the reputation of the company's products. DSS software offers survey data to developers that may prove to change the way customers perceive the brand in the marketplace. The second and third alternatives advocated for aggressive marketing techniques and increased the production of the products. These options would have a minimal impact on changing the way consumers perceive the corporation's products. Where products have been considered to have low quality in the past, increasing the production would only lead to additional losses. Similarly, increased advertising may only have a limited impact on buyers. Given discounts for the same products may not generate the desired profit to keep the product line effectively running for the company. Implementing the first and the fourth solutions change the negative publicity, rebrand the products, and lures buyers into trying the new offers in the market. Several business intelligence tools are applicable in the case of LG. The following tools are appropriate: · Microsoft Excel: The component is useful in recording, analyzing, evaluation, and visualization of data. Excel has formulas and functions that are critical in making sound calculations and decisions. · Clear Analytics: The tool allows the performance of analysis on an Excel-based platform. It will enable the publication of data in cloud-based systems, online, and on mobile gadgets.
- 53. · Tableau Software: This business intelligence tool permits data visualization and comprehension. The software has a drag-and- drop function, easy to navigate, and allows data analysis. · Micro Strategy: The tool provides a dashboard function and high-spend data displays. It is critical in the assessment of market opportunities and trends. It also allows for the evaluation of a firm's productivity. According to our evaluation, Tableau is the best business intelligence tool. The software permits data sharing across PCs and mobile devices without the need for programming or format conversion. The item allows users to connect to a database as well as dashboard creation easily. It guarantees security at different levels, interactivity, and constant updates. 6. Work Breakdown Structure Tasks Responsible member Time needed to complete the task Introduction Manal 1 Day Background Manal 1 Day Intelligence phase · Providing a General description of the decision situation Batool 1 Day · What type of decision and why? Batool 1 Day · Why there is a need for a DSS instead of some other systems? Batool 1 Day Design phase · Identifying possible alternatives
- 54. Afnan 2 Day Choice phase · Clarifying the business needs and the expected benefits and Beneficiaries Afnan 1 Day · Choosing the best solution to be implemented Afnan 2 Days · The model(s) which will be used along with any functions All group member 2 Day · Choosing the BI tool with a justification All group member 2 Day Conclusion Manal 1 Day Formatting the report 1 Day7. Conclusion LG Corporation can use the DSS software to collect data on the problem of low smartphone market share it faces. The project determined that the company should reduce its selling price on its smartphones and offer variety as a way of revamping its market share in more than 100 locations worldwide. Secondly, the R&D department of the company should use the survey collected through the DSS system to develop new designs of smartphones that reflect customer preferences. LG can use product diversification strategy, and variety in price offers to win customer loyalty and increase its sales. The implementation of the solutions will lead to customer satisfaction and the development of new perceptions of LG smartphones. In the long-run, the gap that exists between the market leader- Samsung and LG will significantly narrow. LG needs to remain
- 55. relevant in its production techniques by considering customer views are vital components of change and adaptation in the marketplace. 8. References · Alshibly, H.H., 2015. Investigating the decision support system (DSS) success: A partial least squares structural equation modeling approach. Journal of Business Studies Quarterly, 6(4), p.56. · Chan, S.H., Song, Q., Sarker, S., and Plumlee, R.D., 2017. Decision support system (DSS) use and decision performance: DSS motivation and its antecedents. Information & Management, 54(7), pp.934-947. · Guo, X. and Díaz López, A., 2013. Mobile decision support system usage in organizations. · Life’s Good, n.d. Company information [Online]. Retrieved November 7, 2018, from https://www.lg.com/global/investor-relations/company-info · Mourdoukoutas, M., September 13, 2018. Samsung beats Apple in the global smartphone market as Chinese brands close in [Online]. Retrieved November 7, 2018 from https://www.forbes.com/sites/panosmourdoukoutas/2018/09/13/s
- 56. amsung-beats-apple-in-the-global-smartphone-market-as- chinese-brands-close-in/#3f72309a697d · So, W., September 2019. South Korea’s LG Group – Statistics and facts [Online]. Retrieved November 7, 2018, from https://www.statista.com/topics/4818/lg-corporation-of-south- korea/ Page 1 of 15 Jubail University College Department of Business Administration Semester 401 Assignment No.: 1 & 2 Section No.: Course Code: MIS 305 Course Name: Intelligent Support Systems in Business Student Name Student ID 1. 2. 3. 4. 5.
- 57. Project Based Assignment The Assignment Objective: This is a project-based assignment divided into two deliverables: theoretical and practical part. Each with 10% of your final grade. It aims to familiarize and expose students to the business intelligence tools and the four phases of the decision making process as well as improving students’ effective communication and team working skills. In addition, it helps expose students to tools and techniques that aid them in practically developing a DSS to solve a problem or take advantage of an opportunity based on the four phases of decision making process. Topic- A Business Case: Each group should identify particular opportunity or problem to be solved by any managerial level in Business. You need to follow the 4 phases of decision making process. Use any tool in M.S. Excel to help automate this decision. Your DSS should provide a correct answer to be given to managers or staff. Examples that could help you: · DSS to help HR answer Employees questions. · DSS to help Marketing and development department to increase customer satisfaction. Each group (of 3-4 members) create their own scenarios in
- 58. relevance to their business case. Note that you need to consider the various users and existing operations as well as any new operations and functions for proper utilization of data and accurate decision making process. Theoretical Part – Project Proposal (Submission on week 6): (10 %) 1) Deliverables and marks allocation: (100 marks = 10%) · a Written Report due in Week 6 and should include: ( 100 marks ) a. Profasional Assignment Cover page b. Tables of content. ( 5 marks ) c. Proposed Project Title d. Introduction: covering their aim at the end of the assignment ( 5 mark) e. Report’s body should include the following : i. A general background for your DSS project ii. In the Intelligence phase ensure: (20 mark) · Providing a General description of the decision situation, i.e., what is the decision circumstances in which the decision is made? · What type of decision and why? Why there is a need for a DSS instead of some other systems? · Hint: “The final result should properly identified the right factors” iii. Design phase: ( 15 mark ) · Identify all the possible alternatives which will affect your decision. iv. Choice phase: ( 15 mark) · Provide a clear articulation of the business need.The expected benefits and beneficiaries · The model(s) which will be used along with any functions · What are the different BI (tools) solutions that could be implemented to solve the problem (opportunity)? Which one will you use? The reasons behind selecting specific BI solution f. Work breakdown structure(WBS) identifying the tasks that need to be completed to develop the DSS along with the task
- 59. allocation for each team member along with the project leader. (20 mark) g. Conclusions.( 5 mark ) h. Write your list of References at least 3 refernces using Harvard style . ( 5 mark) 2) Deadline: · A soft of the report submitted on week 7 Sunday 1. The softcopy to be submitted via blackboard based on the deadline. Notes: 1- It is a group assignment, 3-4 students in each group. 2- Ensure originality of the idea and uniqueness. 3- Each student must work to progress both, the team and individual aspects of the assignment tasks. 4- Pay attention to the following format guidelines (10 marks) a. The report should include 5 to 10 pages (around 2000 -2500 words). b. Using MSW 12 point Time New Romans font, MSW 14 points for heading. c. Double spaced Line spacing for each paragraph. Standard format: 1" each margin 5- Attaching the original copies of references. 6- Submit a softcopy of the report. 7- Ensure originality! Plagiarism is not allowed. Assignment will be rejected for each Plagiarized paragraph. End of Deliverable 1 Practical Part (Submission on week 13):(10 %) This part focuses on the implementation phase of your DSS for the problem (opportunity) that you have identified in assignment 1. DSS Criteria: · You should use analytical tool and functions. · The design and format should be attractive yet clear. · Use visualization to easily analyze the results. · Develop two dashboards. Please ensure that you adhere to the
- 60. dashboard design principles and guidelines. · Keep intended users of your DSS in mind and ensure that you consider all the possible factors. · Identify the routine business functions and the management activities supported by your DSS. · Assume the business rules for the DSS users to follow and make sure to incorporate them. The required materials: (100 marks = 10%) A) Report contains the following: (60 marks) 1- Documentation: a. Assignment cover page and Tables of content b. Introduction: Brief introduction about the decision you will assist in. (2 mark) c. Content · This part shoud Breifly and consizly address all the work that you have done and assubsions you followed in preparing your DSS Implementation phase such as: · How the solution is implemented.(10 mark) · Explain the tools that you developed (10 mark) · The functions you used with a brief explanation of it (10 mark) · The dashboards. (20 mark) d. Conclusion · The results and benefits of using the BI system on the problem (opportunity) after the implementation? (2 mark) · Visualization to analyze the results. ( 3 mark ) · Future recommendation, if applicable. e. References (3 mark) 2- Appendixes · All the soft files of the database and BI software. · The presentation materials. B) The presentation of actual tool developed, in accord with the documentation. · This part is to be presented and explained “using examples” to the Instructor by the group members. Ensure that you are presenting a STORY( 40 marks)
- 61. Criteria Individual Knowledge Communication Skills Peer Evaluation Total Maximum Mark 20 10 10 40 C) Following guidelines (10 marks) Notes · Besides the presentation, you will be engaged in small group discussion about your assignment and work. Students will reflect on their work and their learning process throughout the project duration, what are the challenges and lesson learned. · Students who do not follow the dress code will not be allowed to present · Please note that each requirement carries marks, don’t neglect any point in the assignment. · Please do not overwrite; a proper concise explanation is enough. · Pay attention to the following format guidelines: · The project report (documentation) should address all the requirements concisely. · Using MSW 12 point Time New Romans font, MSW 14 points for heading. · Double spaced Line spacing for each paragraph. Standard format: 1" each margin End of Deliverable 2 Page 5 of 6