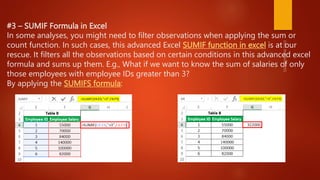
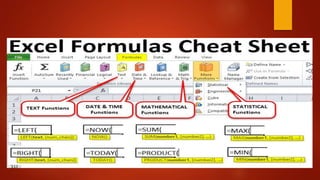
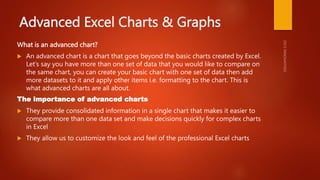
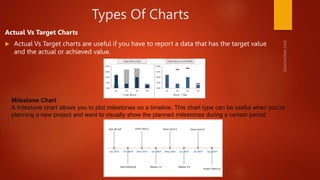
ADVANCED EXCEL
INSTITUTE IN
LAXMI NAGAR C-3/207, 1st Floor Guru Nanak Pura,
Radhu Place Road, near V3S Mall,
Mahraja Banquet,
Laxmi Nagar, New Delhi, Delhi
110092
Call Us: +91-9899172757
info@dicslaxminagar.com
WHAT IS ADVANCED EXCEL?
 Excel is a powerful spreadsheet program that can be used to perform a wide range of tasks, from simple
calculations and data entry to complex data analysis and modeling. Here are some advanced Excel
techniques that can help you get the most out of the program:
 Pivot tables: Pivot tables are a powerful tool for summarizing and analyzing large amounts of data. They
allow you to quickly group, filter, and sort data to create summary tables and charts.
 Macros: Macros are scripts that automate repetitive tasks in Excel. They can be used to automate data
entry, formatting, and analysis tasks.
 Conditional formatting: Conditional formatting allows you to apply formatting rules to cells based on their
contents. This can be used to highlight important data, create heat maps, and visually identify trends in
your data.
 Advanced formulas: Excel has a wide range of built-in functions and formulas that can be used to perform
complex calculations and analysis. Some of the most useful functions include VLOOKUP, INDEX/MATCH,
and IF statements.
 Data validation: Data validation is a tool that allows you to control the types of data that can be entered
into a cell or range of cells. This can help to ensure data accuracy and consistency.
List of Top 3 Advanced Excel Formulas
& Functions
#1 – MATCH Formula in Excel
This Excel advanced formula returns the row or column number when a specific string or number is in
the given range
. In the below example, we are trying to find “Rajesh Ved” in the “Employee Name” column.
The formula would be as given below:
#2 – IF AND Formula in Excel
There are many instances when one needs to create flags based on some constraints. We all are
familiar with the basic syntax of IF. We use this advanced excel IF function to create a new field
based on some existing field constraints. But what if we need to consider multiple columns while
creating a flag? E.g., in the below case, we want to flag all the employees whose salary is greater than
50,000. But “Employee ID” is greater than 3.
#3 – SUMIF Formula in Excel
In some analyses, you might need to filter observations when applying the sum or
count function. In such cases, this advanced Excel SUMIF function in excel is at our
rescue. It filters all the observations based on certain conditions in this advanced excel
formula and sums up them. E.g., What if we want to know the sum of salaries of only
those employees with employee IDs greater than 3?
By applying the SUMIFS formula:
Advanced Excel Charts & Graphs
What is an advanced chart?
 An advanced chart is a chart that goes beyond the basic charts created by Excel.
Let’s say you have more than one set of data that you would like to compare on
the same chart, you can create your basic chart with one set of data then add
more datasets to it and apply other items i.e. formatting to the chart. This is
what advanced charts are all about.
The importance of advanced charts
 They provide consolidated information in a single chart that makes it easier to
compare more than one data set and make decisions quickly for complex charts
in Excel
 They allow us to customize the look and feel of the professional Excel charts
Types Of Charts
Actual Vs Target Charts
 Actual Vs Target charts are useful if you have to report a data that has the target value
and the actual or achieved value.
Milestone Chart
A milestone chart allows you to plot milestones on a timeline. This chart type can be useful when you’re
planning a new project and want to visually show the planned milestones during a certain period
Bell Curve
A bell curve (also known as normal distribution curve) is a way to plot and analyze data that looks
like a bell curve.
Sales Funnel Chart
In any sales process, there are stages. A typical sales stage could look something as
shown below:
Opportunity Identified –> Validated –> Qualified –> Proposal –> Win
Pareto Chart
Pareto Chart is based on the Pareto principle (also known as the
80/20 rule), which is a well-known concept in project management.
Bullet Chart
Bullet chart is well suited for dashboards as it can punch a
lot of information and takes very little space.
Microsoft Excel Features
#1 – You Can Insert a New Worksheets at Will.
#2 – Time Saving Shortcut Keys.
#3 – Get Quick Sum of Numbers.
#4 – Filtering Data.
#5 – Paste Special Feature.
#6 – Insert Random Numbers.
#7 – Insert Random Fraction Numbers.
#8 – Goal Seek Analysis Tool.
Carrer options in advanced excel
 An advanced Excel course can provide you with several options for your future. Here are
a few potential career paths you can consider:
 Financial Analyst: With advanced Excel skills, you can analyze financial data, create
financial models, and develop reports for management. This makes you an excellent
candidate for financial analyst positions.
 Data Analyst: Companies are increasingly relying on data to drive their decision-making
processes. With an advanced Excel course, you can learn how to clean and manipulate
data, build PivotTables, and use Excel's data analysis tools. These skills are in high
demand in the data analyst job market.
 Business Intelligence Analyst: Business intelligence analysts use data to identify business
trends and opportunities. Advanced Excel skills are essential for creating dashboards and
reports that effectively communicate data insights.
 Project Manager: Project managers use Excel to track project schedules, budgets, and
resources. With an advanced Excel course, you can learn how to create Gantt charts, use
Excel's built-in project management templates, and create custom project management
tools.
THANK YOU

ADVANCED EXCEL COURSE IN LAXMI NAGAR

  • 1.
    ADVANCED EXCEL INSTITUTE IN LAXMINAGAR C-3/207, 1st Floor Guru Nanak Pura, Radhu Place Road, near V3S Mall, Mahraja Banquet, Laxmi Nagar, New Delhi, Delhi 110092 Call Us: +91-9899172757 info@dicslaxminagar.com
  • 2.
    WHAT IS ADVANCEDEXCEL?  Excel is a powerful spreadsheet program that can be used to perform a wide range of tasks, from simple calculations and data entry to complex data analysis and modeling. Here are some advanced Excel techniques that can help you get the most out of the program:  Pivot tables: Pivot tables are a powerful tool for summarizing and analyzing large amounts of data. They allow you to quickly group, filter, and sort data to create summary tables and charts.  Macros: Macros are scripts that automate repetitive tasks in Excel. They can be used to automate data entry, formatting, and analysis tasks.  Conditional formatting: Conditional formatting allows you to apply formatting rules to cells based on their contents. This can be used to highlight important data, create heat maps, and visually identify trends in your data.  Advanced formulas: Excel has a wide range of built-in functions and formulas that can be used to perform complex calculations and analysis. Some of the most useful functions include VLOOKUP, INDEX/MATCH, and IF statements.  Data validation: Data validation is a tool that allows you to control the types of data that can be entered into a cell or range of cells. This can help to ensure data accuracy and consistency.
  • 3.
    List of Top3 Advanced Excel Formulas & Functions #1 – MATCH Formula in Excel This Excel advanced formula returns the row or column number when a specific string or number is in the given range . In the below example, we are trying to find “Rajesh Ved” in the “Employee Name” column. The formula would be as given below:
  • 4.
    #2 – IFAND Formula in Excel There are many instances when one needs to create flags based on some constraints. We all are familiar with the basic syntax of IF. We use this advanced excel IF function to create a new field based on some existing field constraints. But what if we need to consider multiple columns while creating a flag? E.g., in the below case, we want to flag all the employees whose salary is greater than 50,000. But “Employee ID” is greater than 3.
  • 5.
    #3 – SUMIFFormula in Excel In some analyses, you might need to filter observations when applying the sum or count function. In such cases, this advanced Excel SUMIF function in excel is at our rescue. It filters all the observations based on certain conditions in this advanced excel formula and sums up them. E.g., What if we want to know the sum of salaries of only those employees with employee IDs greater than 3? By applying the SUMIFS formula:
  • 7.
    Advanced Excel Charts& Graphs What is an advanced chart?  An advanced chart is a chart that goes beyond the basic charts created by Excel. Let’s say you have more than one set of data that you would like to compare on the same chart, you can create your basic chart with one set of data then add more datasets to it and apply other items i.e. formatting to the chart. This is what advanced charts are all about. The importance of advanced charts  They provide consolidated information in a single chart that makes it easier to compare more than one data set and make decisions quickly for complex charts in Excel  They allow us to customize the look and feel of the professional Excel charts
  • 8.
    Types Of Charts ActualVs Target Charts  Actual Vs Target charts are useful if you have to report a data that has the target value and the actual or achieved value. Milestone Chart A milestone chart allows you to plot milestones on a timeline. This chart type can be useful when you’re planning a new project and want to visually show the planned milestones during a certain period
  • 9.
    Bell Curve A bellcurve (also known as normal distribution curve) is a way to plot and analyze data that looks like a bell curve. Sales Funnel Chart In any sales process, there are stages. A typical sales stage could look something as shown below: Opportunity Identified –> Validated –> Qualified –> Proposal –> Win
  • 10.
    Pareto Chart Pareto Chartis based on the Pareto principle (also known as the 80/20 rule), which is a well-known concept in project management. Bullet Chart Bullet chart is well suited for dashboards as it can punch a lot of information and takes very little space.
  • 12.
    Microsoft Excel Features #1– You Can Insert a New Worksheets at Will. #2 – Time Saving Shortcut Keys. #3 – Get Quick Sum of Numbers. #4 – Filtering Data. #5 – Paste Special Feature. #6 – Insert Random Numbers. #7 – Insert Random Fraction Numbers. #8 – Goal Seek Analysis Tool.
  • 13.
    Carrer options inadvanced excel  An advanced Excel course can provide you with several options for your future. Here are a few potential career paths you can consider:  Financial Analyst: With advanced Excel skills, you can analyze financial data, create financial models, and develop reports for management. This makes you an excellent candidate for financial analyst positions.  Data Analyst: Companies are increasingly relying on data to drive their decision-making processes. With an advanced Excel course, you can learn how to clean and manipulate data, build PivotTables, and use Excel's data analysis tools. These skills are in high demand in the data analyst job market.  Business Intelligence Analyst: Business intelligence analysts use data to identify business trends and opportunities. Advanced Excel skills are essential for creating dashboards and reports that effectively communicate data insights.  Project Manager: Project managers use Excel to track project schedules, budgets, and resources. With an advanced Excel course, you can learn how to create Gantt charts, use Excel's built-in project management templates, and create custom project management tools.
  • 15.