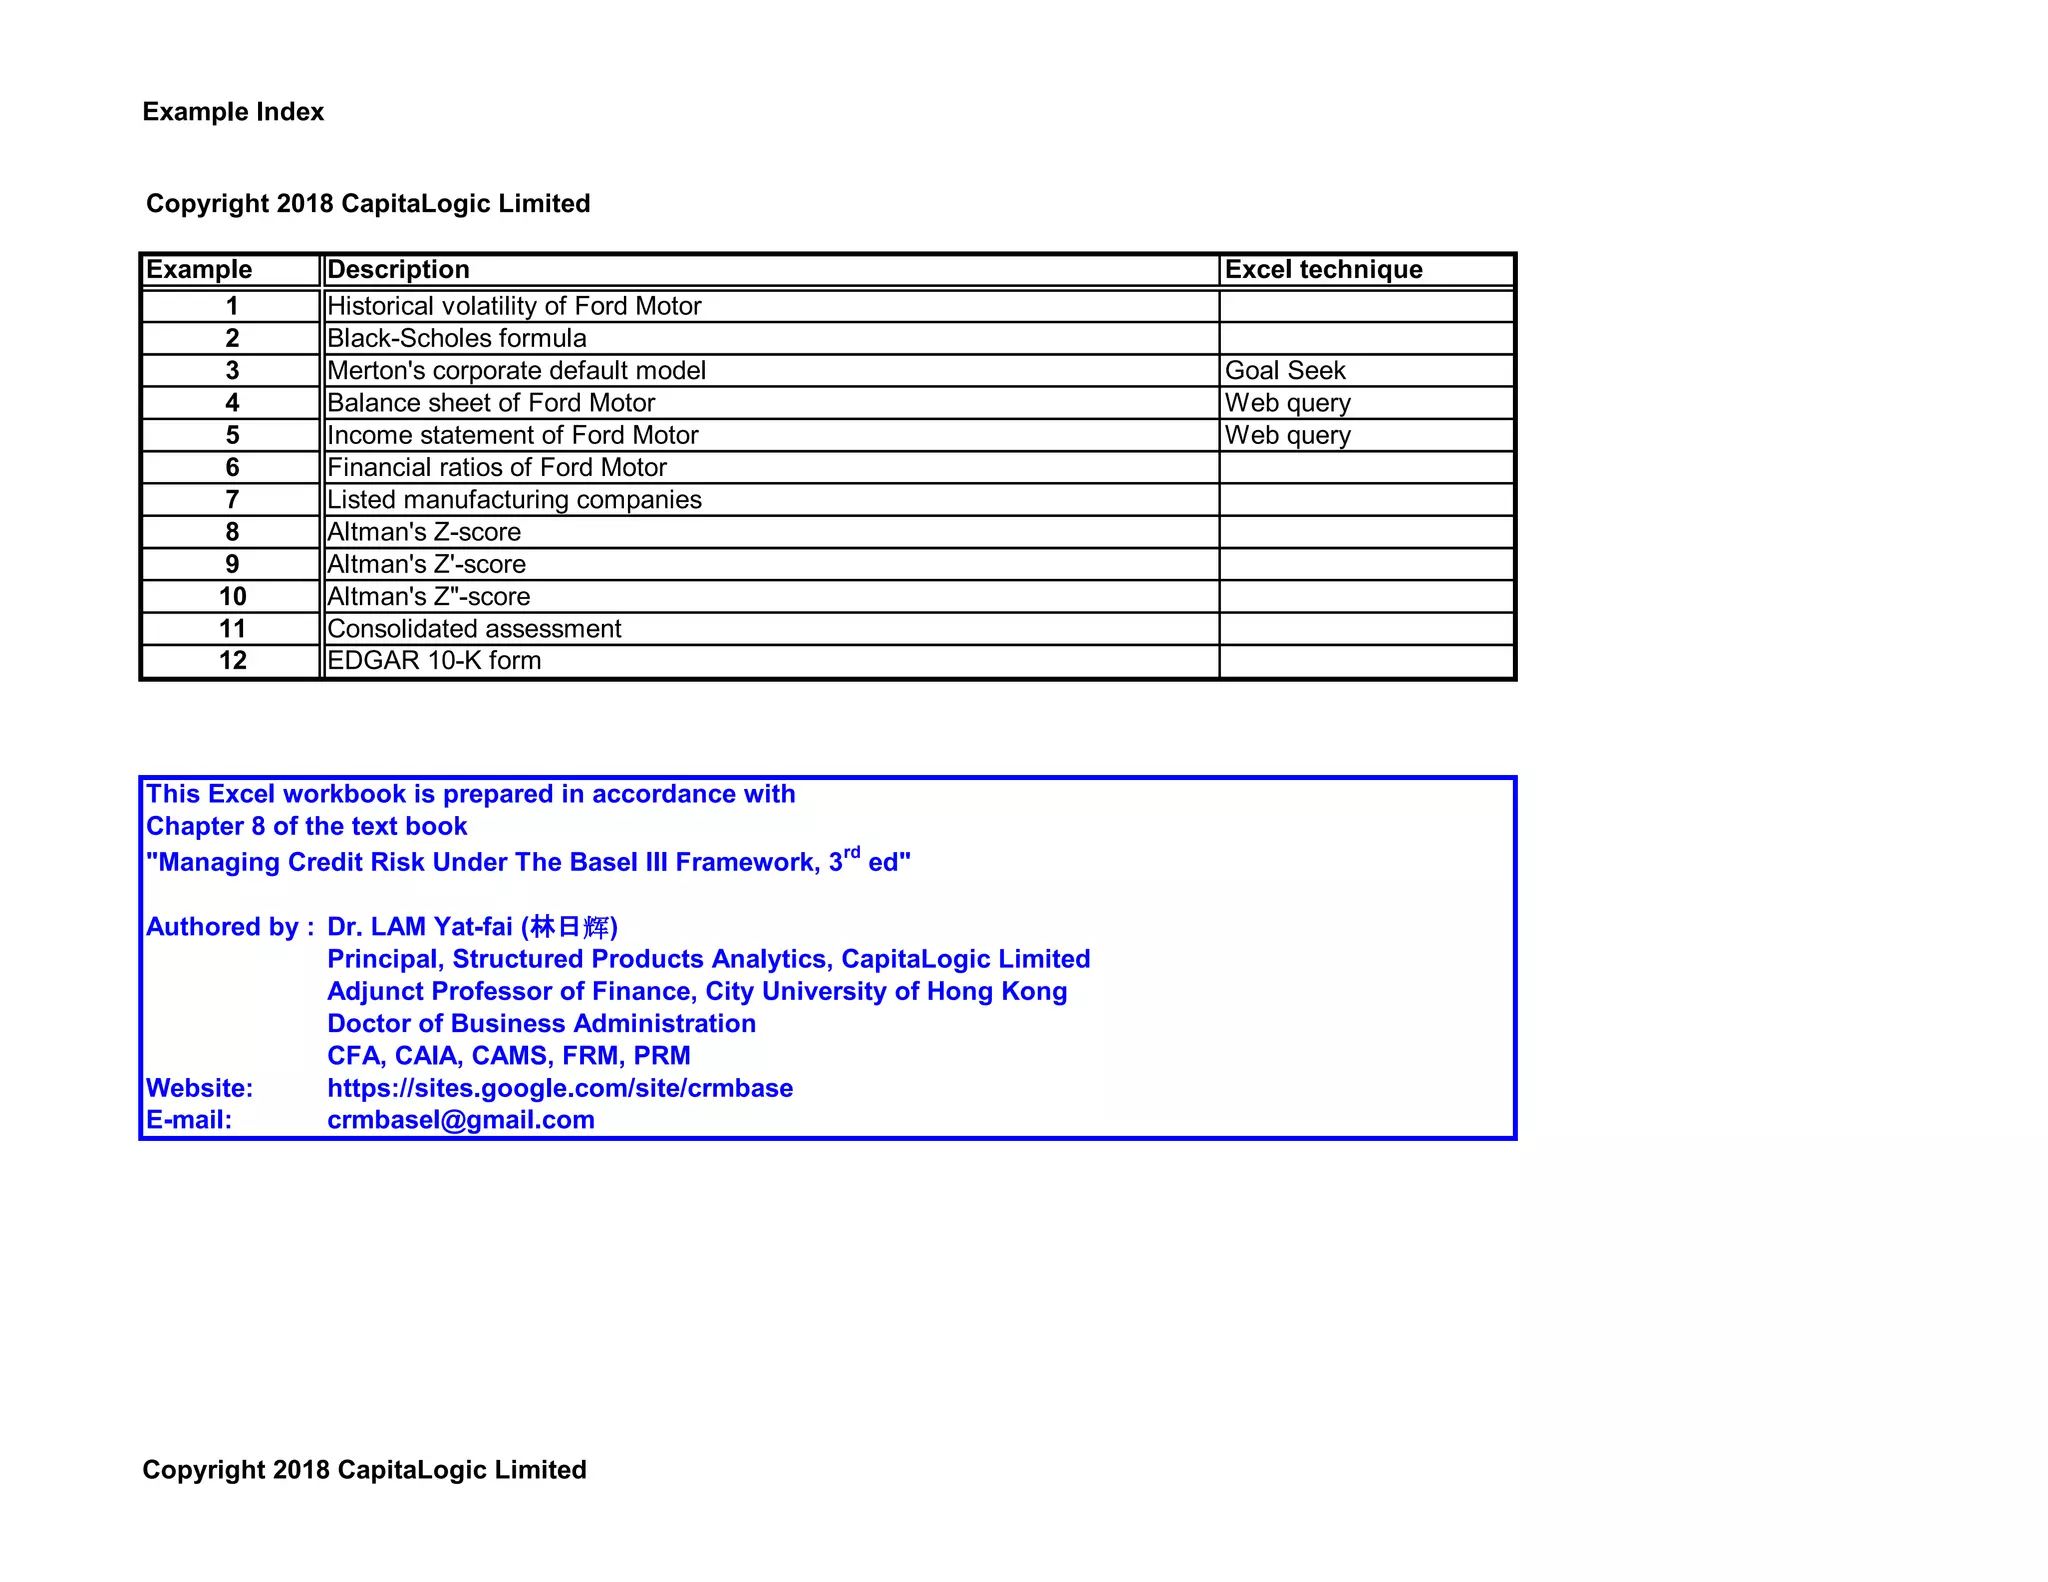
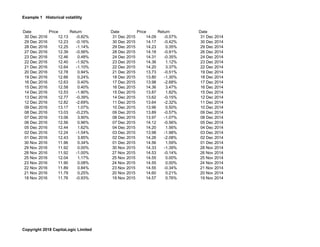
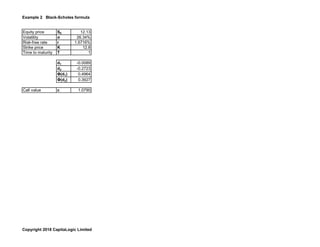
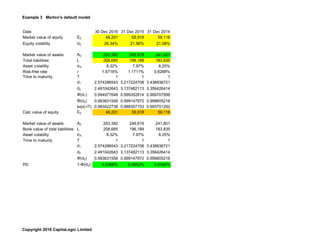
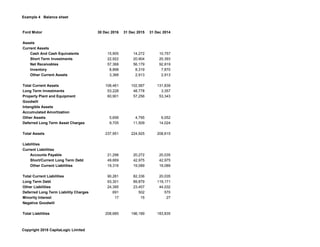
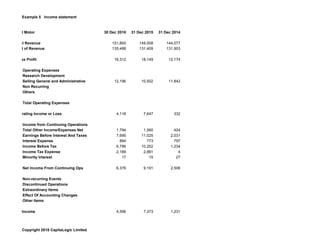
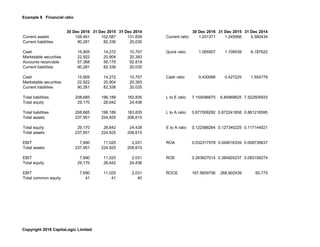
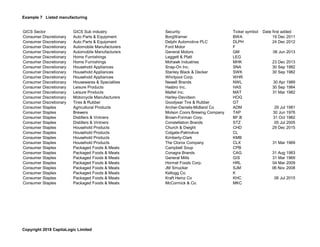
This Excel workbook contains 12 examples analyzing financial metrics and risk models for Ford Motor Company. The examples include: 1) historical stock price volatility, 2) the Black-Scholes options pricing model, 3) Merton's corporate default model, 4) Ford's balance sheet and income statement data, 5) financial ratios, 6) listed manufacturing companies, 7) Altman's Z-score and variants for Ford, and 8) notes indicating the workbook was prepared according to a risk management textbook.

![Example 12 EDGAR 10-K form
CONSOLIDATED BALANCE SHEET (Parenthetical) - USD ($) shares in Millions, $ in MillionsDec. 31, 2016 Dec. 31, 2015
ASSETS
Allowance for trade and other receivables 392 372
Common Stock [Member]
EQUITY
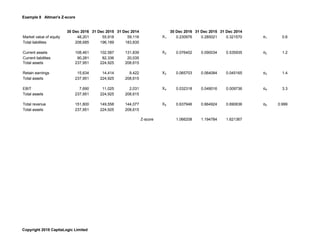
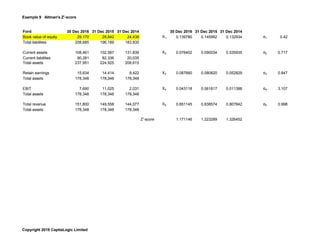
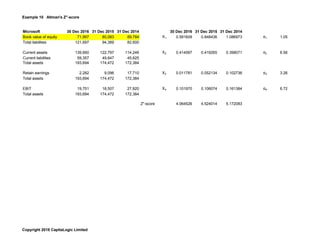
Common stock, par value (in dollars per share) 0.01
Common Stock, shares issued (in shares) 3976
Common Stock, Shares Authorized (in shares) 6000
Class B Stock [Member]
EQUITY
Common stock, par value (in dollars per share) 0.01
Common Stock, shares issued (in shares) 71
Common Stock, Shares Authorized (in shares) 530
Copyright 2018 CapitaLogic Limited](https://image.slidesharecdn.com/08-180825045523/85/08-3-corporate-credit-analysis-13-320.jpg)


