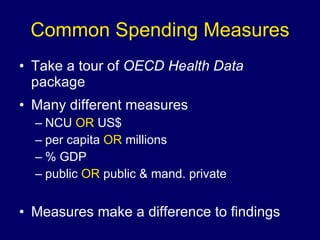
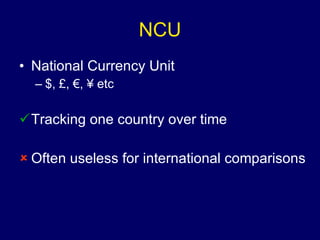
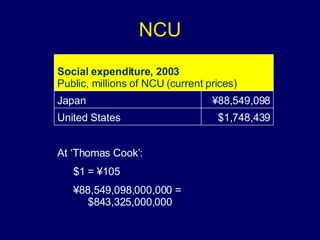
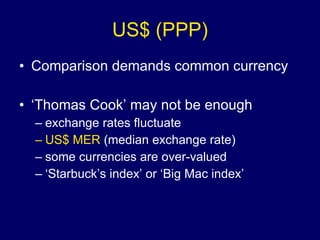
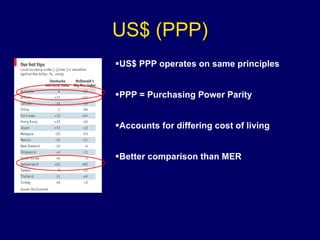
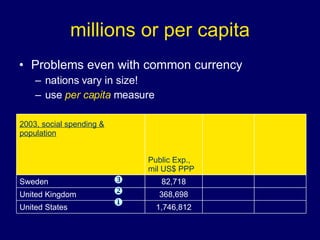
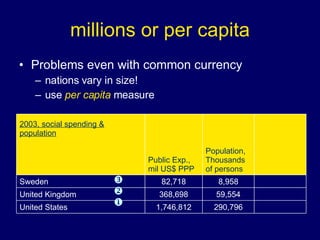
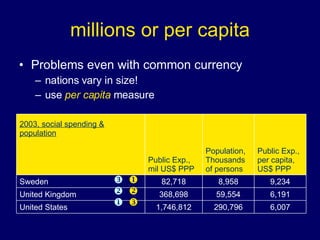
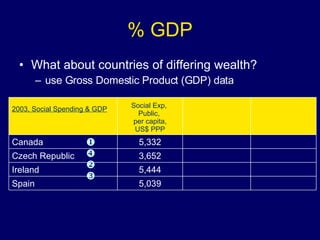
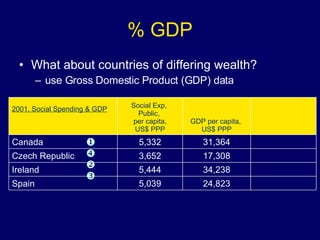
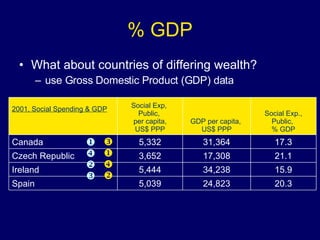
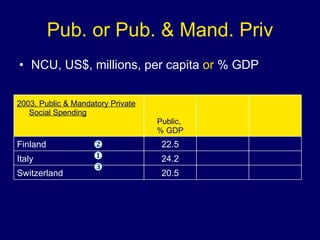
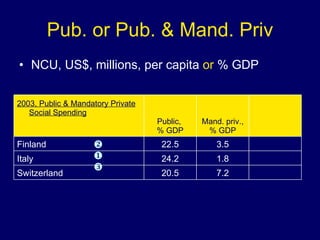
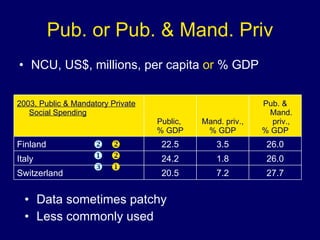
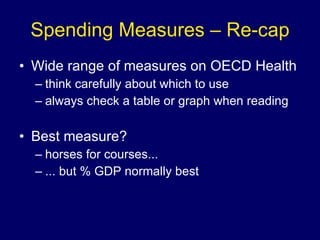
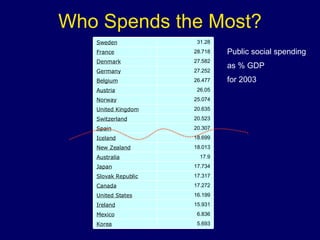
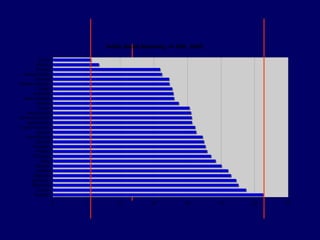
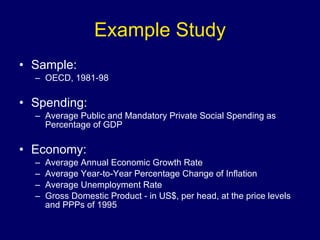
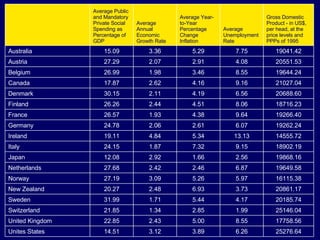
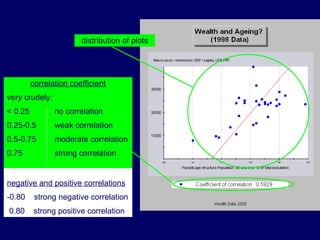
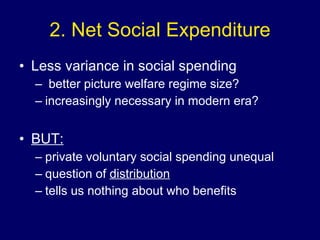
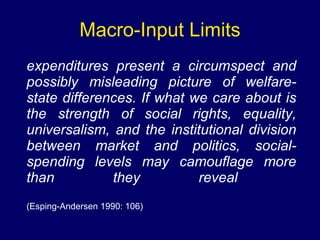
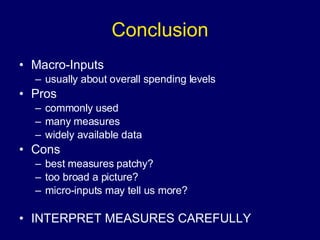
Comparative Social Structures and Welfare Week 7 Comparing Welfare Inputs - Spending
Re-Cap Why Compare? Key Methodological Problems Core Theories Key Data Sources
Session Objectives Begin analysis of empirical data Introduce some key welfare-input measures Explore a sample macro-input study
Macro-Level Welfare-Inputs Measures of ‘Welfare State Effort’ i.e. cash! Common Focus for Studies data widely available relatively simple measures clear link with political debates Q:  Who spends the most of welfare?
Common Spending Measures Take a tour of  OECD Health Data  package
 
Common Spending Measures Many different measures NCU  OR  US$ per capita  OR  millions % GDP public  OR  public & mand. private Measures make a difference to findings Take a tour of  OECD Health Data  package
NCU National Currency Unit $, £,  €,  ¥ etc Tracking one country over time Often useless for international comparisons
NCU At ‘Thomas Cook’: $1 =  ¥ 105 ¥ 88,549,098,000,000 =   $843,325,000,000 $1,748,439 United States ¥ 88,549,098 Japan Social expenditure, 2003 Public, millions of NCU (current prices)
US$ (PPP) Comparison demands common currency ‘Thomas Cook’ may not be enough exchange rates fluctuate US$ MER  (median exchange rate) some currencies are over-valued ‘Starbuck’s index’ or ‘Big Mac index’
US$ (PPP) US$ PPP operates on same principles PPP = Purchasing Power Parity Accounts for differing cost of living Better comparison than MER
millions or per capita Problems even with common currency nations vary in size! use  per capita  measure  1,746,812 United States 368,698 United Kingdom 82,718 Sweden Public Exp.,  mil US$ PPP 2003, social spending & population
millions or per capita Problems even with common currency nations vary in size! use  per capita  measure  290,796 1,746,812 United States 59,554 368,698 United Kingdom 8,958 82,718 Sweden Population, Thousands of persons Public Exp.,  mil US$ PPP 2003, social spending & population
millions or per capita Problems even with common currency nations vary in size! use  per capita  measure      6,007 290,796 1,746,812 United States 6,191 59,554 368,698 United Kingdom 9,234 8,958 82,718 Sweden Public Exp., per capita, US$ PPP Population, Thousands of persons Public Exp.,  mil US$ PPP 2003, social spending & population
% GDP What about countries of differing wealth? use Gross Domestic Product (GDP) data    5,039 Spain 5,444 Ireland 3,652 Czech Republic 5,332 Canada Social Exp,  Public,  per capita, US$ PPP 2003, Social Spending & GDP
% GDP What about countries of differing wealth? use Gross Domestic Product (GDP) data    24,823 5,039 Spain 34,238 5,444 Ireland 17,308 3,652 Czech Republic 31,364 5,332 Canada GDP per capita,  US$ PPP Social Exp,  Public,  per capita, US$ PPP 2001, Social Spending & GDP
% GDP What about countries of differing wealth? use Gross Domestic Product (GDP) data      20.3 24,823 5,039 Spain 15.9 34,238 5,444 Ireland 21.1 17,308 3,652 Czech Republic 17.3 31,364 5,332 Canada Social Exp., Public,  % GDP GDP per capita,  US$ PPP Social Exp,  Public,  per capita, US$ PPP 2001, Social Spending & GDP
Pub. or Pub. & Mand. Priv NCU, US$, millions, per capita  or  % GDP  20.5 Switzerland 24.2 Italy 22.5 Finland Public,  % GDP 2003, Public & Mandatory Private Social Spending
Pub. or Pub. & Mand. Priv NCU, US$, millions, per capita  or  % GDP  7.2 20.5 Switzerland 1.8 24.2 Italy 3.5 22.5 Finland Mand. priv., % GDP Public,  % GDP 2003, Public & Mandatory Private Social Spending
Pub. or Pub. & Mand. Priv NCU, US$, millions, per capita  or  % GDP Data sometimes patchy Less commonly used   27.7 7.2 20.5 Switzerland 26.0 1.8 24.2 Italy 26.0 3.5 22.5 Finland Pub. & Mand. priv., % GDP Mand. priv., % GDP Public,  % GDP 2003, Public & Mandatory Private Social Spending
Spending Measures – Re-cap Wide range of measures on OECD Health think carefully about which to use always check a table or graph when reading Best measure? horses for courses... ... but % GDP normally best
Who Spends the Most? Public social spending  as % GDP  for 2003 5.693 Korea 6.836 Mexico 15.931 Ireland 16.199 United States 17.272 Canada 17.317 Slovak Republic 17.734 Japan 17.9 Australia 18.013 New Zealand 18.699 Iceland 20.307 Spain 20.523 Switzerland 20.635 United Kingdom 25.074 Norway 26.05 Austria 26.477 Belgium 27.252 Germany 27.582 Denmark 28.718 France 31.28 Sweden
 
Example Study Q:  Does welfare spending hurt the economy? Often argued that this is so: New Right (Thatcher, Reagan) New Labour (limits to spending) Competition State Thesis
Example Study Sample: OECD, 1981-98 Spending: Average Public and Mandatory Private Social Spending as Percentage of GDP Economy: Average Annual Economic Growth Rate Average Year-to-Year Percentage Change of Inflation  Average Unemployment Rate Gross Domestic Product - in US$, per head, at the price levels and PPPs of 1995
25276.64 6.26 3.89 3.12 14.51 Unites States 17758.56 8.55 5.00 2.43 22.85 United Kingdom 25146.04 1.99 2.85 1.34 21.85 Switzerland 20185.74 4.17 5.44 1.71 31.99 Sweden 20861.17 3.73 6.93 2.48 20.27 New Zealand 16115.38 5.97 5.26 3.09 27.19 Norway 19649.58 6.87 2.46 2.42 27.68 Netherlands 19868.16 2.56 1.66 2.92 12.08 Japan 18902.19 9.15 7.32 1.87 24.15 Italy 14555.72 13.13 5.34 4.84 19.11 Ireland 19262.24 6.07 2.61 2.06 24.78 Germany 19266.40 9.64 4.38 1.93 26.57 France 18716.23 8.06 4.51 2.44 26.26 Finland 20688.60 6.56 4.19 2.11 30.15 Denmark 21027.04 9.16 4.16 2.62 17.87 Canada 19644.24 8.55 3.46 1.98 26.99 Belgium 20551.53 4.08 2.91 2.07 27.29 Austria 19041.42 7.75 5.29 3.36 15.09 Australia Gross Domestic Product - in US$, per head, at the price levels and PPPs of 1995 Average Unemployment Rate Average Year-to-Year Percentage Change Inflation Average Annual Economic Growth Rate Average Public and Mandatory Private Social Spending as Percentage of GDP
negative and positive correlations -0.80  strong negative correlation 0.80  strong positive correlation distribution of plots correlation coefficient very  crudely: < 0.25    no correlation 0.25-0.5   weak correlation 0.5-0.75   moderate correlation 0.75   strong correlation


Macro-Inputs & Economy No simple, clear link More complex factors to analyse different elements of spending other influences on economy some elements of welfare may boost economy Study could be flawed long time zone correct? right input measure?
1. Voluntary Private Social Spending NOT in OECD Health Data Is quite large in some countries Should this count as social spending?
1. Voluntary Private Social Spending
2. Net Social Expenditure Developed by Adema Accounts for: public social spending mandatory private social expenditure voluntary private social expenditure taxes on benefits tax expenditures Big impact on spending ‘league table’
USA:  9.9% GDP increase 10 place increase Finland:  2.2% GDP decrease 7 place drop
2. Net Social Expenditure Less variance in social spending better picture welfare regime size? increasingly necessary in modern era? BUT: private voluntary social spending unequal question of  distribution tells us nothing about who benefits
Macro-Input Limits expenditures present a circumspect and possibly misleading picture of welfare-state differences. If what we care about is the strength of social rights, equality, universalism, and the institutional division between market and politics, social-spending levels may camouflage more than they reveal   (Esping-Andersen 1990: 106)
Conclusion Macro-Inputs usually about overall spending levels Pros commonly used many measures widely available data Cons best measures patchy? too broad a picture? micro-inputs may tell us more? INTERPRET MEASURES CAREFULLY
Assessment Takes place Week 10 1.5 Hours Lectures & Seminars form basis Week 9: Revision seminar for each group Sample questions will be worked through then
Assessment Test with  five  sections Section A – Definitions  (10%) Section B – Methods (20%) Section C – Theory (20%) Section D – Interpreting Comparative Data (30%) Section E – Comprehension Exercises (20%) 35 MCQs and two short written tasks
Assessment Sections A-C: Standard MCQ 2 marks for correct answer Section D: MCQ with multiple-correct answers 2 marks for correct answer, -1 incorrect Section E: open ended data interpretation

08 Wk 7 Lecture

  • 1.
    Comparative Social Structuresand Welfare Week 7 Comparing Welfare Inputs - Spending
  • 2.
    Re-Cap Why Compare?Key Methodological Problems Core Theories Key Data Sources
  • 3.
    Session Objectives Beginanalysis of empirical data Introduce some key welfare-input measures Explore a sample macro-input study
  • 4.
    Macro-Level Welfare-Inputs Measuresof ‘Welfare State Effort’ i.e. cash! Common Focus for Studies data widely available relatively simple measures clear link with political debates Q: Who spends the most of welfare?
  • 5.
    Common Spending MeasuresTake a tour of OECD Health Data package
  • 6.
  • 7.
    Common Spending MeasuresMany different measures NCU OR US$ per capita OR millions % GDP public OR public & mand. private Measures make a difference to findings Take a tour of OECD Health Data package
  • 8.
    NCU National CurrencyUnit $, £, €, ¥ etc Tracking one country over time Often useless for international comparisons
  • 9.
    NCU At ‘ThomasCook’: $1 = ¥ 105 ¥ 88,549,098,000,000 = $843,325,000,000 $1,748,439 United States ¥ 88,549,098 Japan Social expenditure, 2003 Public, millions of NCU (current prices)
  • 10.
    US$ (PPP) Comparisondemands common currency ‘Thomas Cook’ may not be enough exchange rates fluctuate US$ MER (median exchange rate) some currencies are over-valued ‘Starbuck’s index’ or ‘Big Mac index’
  • 11.
    US$ (PPP) US$PPP operates on same principles PPP = Purchasing Power Parity Accounts for differing cost of living Better comparison than MER
  • 12.
    millions or percapita Problems even with common currency nations vary in size! use per capita measure  1,746,812 United States 368,698 United Kingdom 82,718 Sweden Public Exp., mil US$ PPP 2003, social spending & population
  • 13.
    millions or percapita Problems even with common currency nations vary in size! use per capita measure  290,796 1,746,812 United States 59,554 368,698 United Kingdom 8,958 82,718 Sweden Population, Thousands of persons Public Exp., mil US$ PPP 2003, social spending & population
  • 14.
    millions or percapita Problems even with common currency nations vary in size! use per capita measure     6,007 290,796 1,746,812 United States 6,191 59,554 368,698 United Kingdom 9,234 8,958 82,718 Sweden Public Exp., per capita, US$ PPP Population, Thousands of persons Public Exp., mil US$ PPP 2003, social spending & population
  • 15.
    % GDP Whatabout countries of differing wealth? use Gross Domestic Product (GDP) data    5,039 Spain 5,444 Ireland 3,652 Czech Republic 5,332 Canada Social Exp, Public, per capita, US$ PPP 2003, Social Spending & GDP
  • 16.
    % GDP Whatabout countries of differing wealth? use Gross Domestic Product (GDP) data    24,823 5,039 Spain 34,238 5,444 Ireland 17,308 3,652 Czech Republic 31,364 5,332 Canada GDP per capita, US$ PPP Social Exp, Public, per capita, US$ PPP 2001, Social Spending & GDP
  • 17.
    % GDP Whatabout countries of differing wealth? use Gross Domestic Product (GDP) data      20.3 24,823 5,039 Spain 15.9 34,238 5,444 Ireland 21.1 17,308 3,652 Czech Republic 17.3 31,364 5,332 Canada Social Exp., Public, % GDP GDP per capita, US$ PPP Social Exp, Public, per capita, US$ PPP 2001, Social Spending & GDP
  • 18.
    Pub. or Pub.& Mand. Priv NCU, US$, millions, per capita or % GDP  20.5 Switzerland 24.2 Italy 22.5 Finland Public, % GDP 2003, Public & Mandatory Private Social Spending
  • 19.
    Pub. or Pub.& Mand. Priv NCU, US$, millions, per capita or % GDP  7.2 20.5 Switzerland 1.8 24.2 Italy 3.5 22.5 Finland Mand. priv., % GDP Public, % GDP 2003, Public & Mandatory Private Social Spending
  • 20.
    Pub. or Pub.& Mand. Priv NCU, US$, millions, per capita or % GDP Data sometimes patchy Less commonly used   27.7 7.2 20.5 Switzerland 26.0 1.8 24.2 Italy 26.0 3.5 22.5 Finland Pub. & Mand. priv., % GDP Mand. priv., % GDP Public, % GDP 2003, Public & Mandatory Private Social Spending
  • 21.
    Spending Measures –Re-cap Wide range of measures on OECD Health think carefully about which to use always check a table or graph when reading Best measure? horses for courses... ... but % GDP normally best
  • 22.
    Who Spends theMost? Public social spending as % GDP for 2003 5.693 Korea 6.836 Mexico 15.931 Ireland 16.199 United States 17.272 Canada 17.317 Slovak Republic 17.734 Japan 17.9 Australia 18.013 New Zealand 18.699 Iceland 20.307 Spain 20.523 Switzerland 20.635 United Kingdom 25.074 Norway 26.05 Austria 26.477 Belgium 27.252 Germany 27.582 Denmark 28.718 France 31.28 Sweden
  • 23.
  • 24.
    Example Study Q: Does welfare spending hurt the economy? Often argued that this is so: New Right (Thatcher, Reagan) New Labour (limits to spending) Competition State Thesis
  • 25.
    Example Study Sample:OECD, 1981-98 Spending: Average Public and Mandatory Private Social Spending as Percentage of GDP Economy: Average Annual Economic Growth Rate Average Year-to-Year Percentage Change of Inflation Average Unemployment Rate Gross Domestic Product - in US$, per head, at the price levels and PPPs of 1995
  • 26.
    25276.64 6.26 3.893.12 14.51 Unites States 17758.56 8.55 5.00 2.43 22.85 United Kingdom 25146.04 1.99 2.85 1.34 21.85 Switzerland 20185.74 4.17 5.44 1.71 31.99 Sweden 20861.17 3.73 6.93 2.48 20.27 New Zealand 16115.38 5.97 5.26 3.09 27.19 Norway 19649.58 6.87 2.46 2.42 27.68 Netherlands 19868.16 2.56 1.66 2.92 12.08 Japan 18902.19 9.15 7.32 1.87 24.15 Italy 14555.72 13.13 5.34 4.84 19.11 Ireland 19262.24 6.07 2.61 2.06 24.78 Germany 19266.40 9.64 4.38 1.93 26.57 France 18716.23 8.06 4.51 2.44 26.26 Finland 20688.60 6.56 4.19 2.11 30.15 Denmark 21027.04 9.16 4.16 2.62 17.87 Canada 19644.24 8.55 3.46 1.98 26.99 Belgium 20551.53 4.08 2.91 2.07 27.29 Austria 19041.42 7.75 5.29 3.36 15.09 Australia Gross Domestic Product - in US$, per head, at the price levels and PPPs of 1995 Average Unemployment Rate Average Year-to-Year Percentage Change Inflation Average Annual Economic Growth Rate Average Public and Mandatory Private Social Spending as Percentage of GDP
  • 27.
    negative and positivecorrelations -0.80 strong negative correlation 0.80 strong positive correlation distribution of plots correlation coefficient very crudely: < 0.25 no correlation 0.25-0.5 weak correlation 0.5-0.75 moderate correlation 0.75 strong correlation
  • 28.
  • 29.
  • 30.
  • 31.
  • 32.
    Macro-Inputs & EconomyNo simple, clear link More complex factors to analyse different elements of spending other influences on economy some elements of welfare may boost economy Study could be flawed long time zone correct? right input measure?
  • 33.
    1. Voluntary PrivateSocial Spending NOT in OECD Health Data Is quite large in some countries Should this count as social spending?
  • 34.
    1. Voluntary PrivateSocial Spending
  • 35.
    2. Net SocialExpenditure Developed by Adema Accounts for: public social spending mandatory private social expenditure voluntary private social expenditure taxes on benefits tax expenditures Big impact on spending ‘league table’
  • 36.
    USA: 9.9%GDP increase 10 place increase Finland: 2.2% GDP decrease 7 place drop
  • 37.
    2. Net SocialExpenditure Less variance in social spending better picture welfare regime size? increasingly necessary in modern era? BUT: private voluntary social spending unequal question of distribution tells us nothing about who benefits
  • 38.
    Macro-Input Limits expenditurespresent a circumspect and possibly misleading picture of welfare-state differences. If what we care about is the strength of social rights, equality, universalism, and the institutional division between market and politics, social-spending levels may camouflage more than they reveal (Esping-Andersen 1990: 106)
  • 39.
    Conclusion Macro-Inputs usuallyabout overall spending levels Pros commonly used many measures widely available data Cons best measures patchy? too broad a picture? micro-inputs may tell us more? INTERPRET MEASURES CAREFULLY
  • 40.
    Assessment Takes placeWeek 10 1.5 Hours Lectures & Seminars form basis Week 9: Revision seminar for each group Sample questions will be worked through then
  • 41.
    Assessment Test with five sections Section A – Definitions (10%) Section B – Methods (20%) Section C – Theory (20%) Section D – Interpreting Comparative Data (30%) Section E – Comprehension Exercises (20%) 35 MCQs and two short written tasks
  • 42.
    Assessment Sections A-C:Standard MCQ 2 marks for correct answer Section D: MCQ with multiple-correct answers 2 marks for correct answer, -1 incorrect Section E: open ended data interpretation