Download to read offline

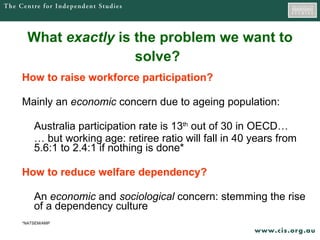
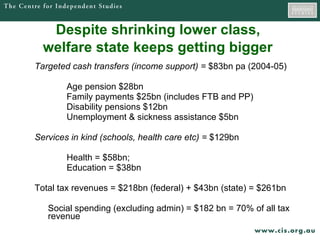
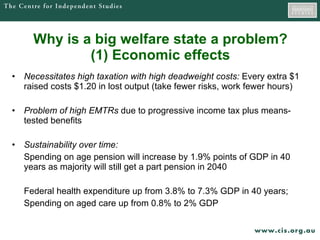
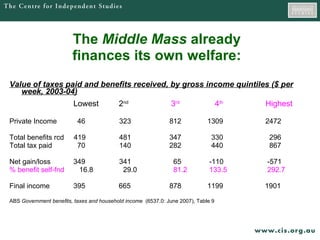
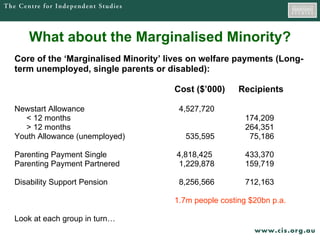
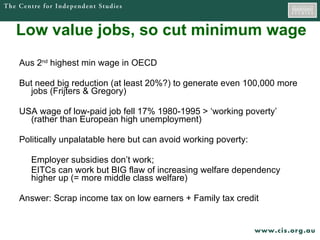
![“ Couple households with dependent children paid $519 per week in taxes [in 2003--4] and received $501 per week in benefits” (ABS, June 2007) Incidence of tax payments and welfare receipts for different types of households ($ per week, 2001-02) Single Couple Couple Couple Couple Couple Couple Single person <35 kids kids kids 55-64 >65 person <35 no kids <5yrs 5-14 15-24 no kids no kids >65 Private income 630.8 1390.6 1095.4 1160.0 1395.6 684.5 287.6 150.7 Total Benefits 101.7 107.2 292.3 507.8 564.1 264.5 548.8 351.3 Total taxes 208.5 426.9 373.8 393.5 474.4 223.4 102.3 56.1 Net cost/benefit -106.7 -319.7 -81.6 114.3 89.7 41.1 446.5 295.1 Final income 524.1 1070.9 1013.9 1274.3 1485.3 725.6 734.1 445. Rachel Lloyd, Ann Harding and Neil Warren, Redistribution, the welfare state and lifetime transitions Paper to the conference on ‘Transitions and Risk’, Melbourne, 24 February 2005, Table 1.](https://image.slidesharecdn.com/dewrpresentationaug07-110627153717-phpapp02/85/Dewr-presentation-aug-07-16-320.jpg)
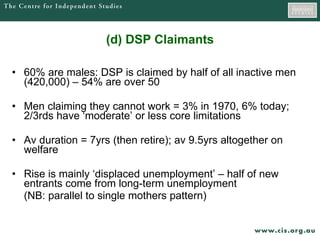
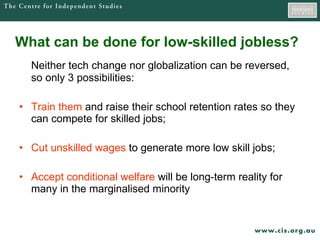
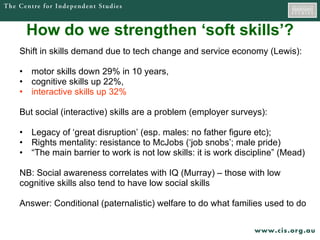
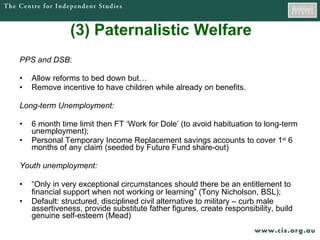

The document discusses strategies to raise workforce participation and reduce welfare dependency in Australia. It argues that while training and education can help some groups like women rejoin the workforce, it may have limited impact for those with low IQ or skills, as many jobs now require minimum IQ levels or skills above what some groups can attain. It suggests two alternatives - creating more low-skilled, low-wage job opportunities through services, or accepting that conditional welfare will be a long-term reality for some with limited capabilities.


![[ARCHIVE] Aviva Real Retirement report, March 2012](https://cdn.slidesharecdn.com/ss_thumbnails/realretirementreportspring2012-120315044038-phpapp02-thumbnail.jpg?width=640&height=640&fit=bounds)


