
Download to read offline


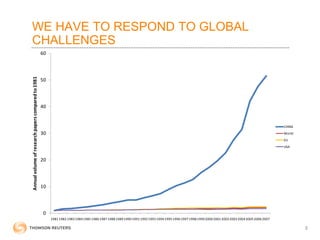
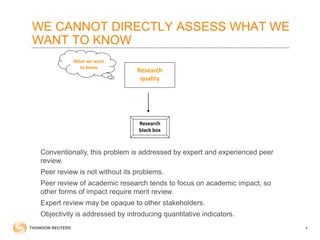
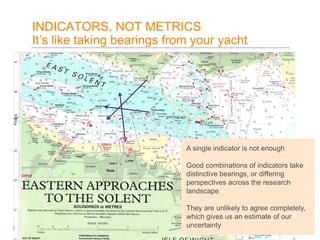


This document discusses research evaluation and the use of quantitative indicators and bibliometrics. It notes that indicators are used to assess research quality and impact when direct assessment is not possible. Multiple indicators that consider field, time, and location are needed to account for differences. Bibliometric data on publications and citations are widely used but must be adjusted for field and time. Tracking broader economic and social impacts is challenging but important. Overall, quantitative indicators provide information to help distribute resources selectively while maintaining confidence, though no single indicator can fully capture research quality or impact.


