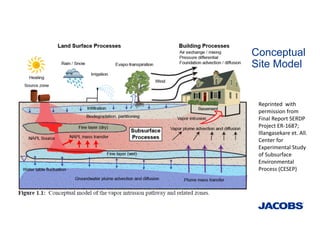
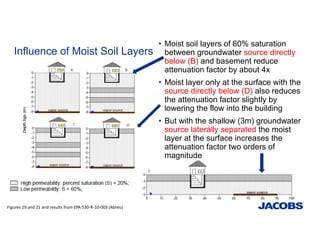
The document discusses the relationship between moisture factors such as precipitation, soil moisture, and groundwater levels with chlorinated vapor intrusion in indoor air. Key findings indicate that certain weather conditions can impact vapor concentrations, and there is a complexity in how these factors influence indoor air quality. Recommendations for future data collection and guidance for practitioners on monitoring practices are also provided.


![Literature – Temporal Prediction using Moisture Related
Variables is Difficult
• Indianapolis: no significant relationship between the measured soil moisture or depth to
water and indoor VOCs in time series analysis. Little evidence of a relationship between rain
events and VOCs.
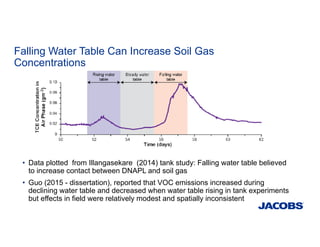
• Sun Devil Manor; Guo (2015 - dissertation), reported that VOC emissions increased during
declining water table and decreased when water table rising.
• Steinmacher (2009) study at Hill AFB precipitation not significantly associated with
percentage detections of TCE.
• Illangeskare “Vapor intrusion will likely spike in the near term during a rain event due to gas
phase displacement from the initial infiltration front propagation. This observation is
supported on the basis of observations from multiple laboratory experiments, model scenario
simulations, and field-testing”.. “A “washout effect” due to the "cleaner water" of the
infiltration front diluting the "dirtier water" of the vadose was significant in the laboratory
experiment and corroborated by the model, but was not readily observed in the rainfall
scenarios…”.
• Shen (2012): Modeled effects – [VOC] go ↑ then ↓ a er rain event, effects weaker at 1 meter
• Infiltration rates vary from >1 inch per hour to <0.10 inches per hour
http://www.soil.ncsu.edu/certification/manual/slides/chapter5a/img14.html](https://image.slidesharecdn.com/07lutesslidesforepa2018workshopmoisturev5-200112010117/85/07-lutes-slides-for-epa-2018-workshop-moisturev5-11-320.jpg)


![Hydrology%20 Intro[1]](https://cdn.slidesharecdn.com/ss_thumbnails/hydrology20intro1-1223061762112095-8-thumbnail.jpg?width=640&height=640&fit=bounds)


![ANIMAL_CELL_,_TISSUE_AND_ORGAN_CULTURE[1].pptx](https://cdn.slidesharecdn.com/ss_thumbnails/animalcelltissueandorganculture1-260204172026-4462b440-thumbnail.jpg?width=640&height=640&fit=bounds)


