SlideShare a Scribd company logo
Assessing water stable isotope variability in precipitation
during phase changes in the hydrologic cycle
Cothran Harris1,2, Andrew Peters2, Hans Christian Steen-Larsen2,3
1North Carolina State University, 2Bermuda Institute of Ocean Sciences, 3University of Copenhagen
Introduction
Acknowledgements
This research was supported by the NSF-REU grant (OCE-1460686) awarded
to the Bermuda Institute of Ocean Sciences
Two effects have been shown to cause variability in the
isotopic composition of precipitation; the “amount effect”
prevalent in tropical latitudes, and the “temperature
effect” in locations of higher latitude. Using data from
three different locations across Bermuda, this study
studied 314 unique rain events in Bermuda, and how
water vapor isotopic content and other meteorological
parameters affect the isotopic content of each
precipitation sample. Our objective is to attain a better
understanding of the mechanism behind the temperature
and precipitation effect, which will aid out knowledge in
the microphysical processes of the hydrologic cycle.
Methods
• Meteorological data was retrieved from the Tudor Hill
site (B) and L.F. Wade International Airport (C), which
included temperature, humidity, dew point, and
barometric pressure.
• Precipitation samples were collected at BIOS (A).
These samples had their isotopic content
analyzed by a Picarro cavity ring down
spectroscopy (CRDS). The isotopic
content of the water
vapor at Tudor Hill
was also analyzed
with a Picarro
CRDS.
A
B
Figure 3: Tudor Hill. All
meteorological measuring
equipment
Is located at the top of the tower.
Methods and Results Preliminary Results
• Most events analyzed have an observable “dip” in water
vapor d18O values that correspond to an observed rainfall
at Tudor Hill. The minimum d18O value, located at the
nadir of each dip, has a positive correlation with the
accompanying precipitation d18O value from the sample
taken at BIOS for each event. Rainfall events that were
accompanied with a wind shift in particular displayed this
correlation.
• Rainfall events that occur during changes in air mass (i.e.
cold fronts) exhibit d18O dips that never rebound once
the rainfall event had ended. Based on this,
characteristics of the new air mass could be described
using precipitation d18O values from rain events
associated with an air mass change.
Further Research
• Further research is needed to investigate the role
evaporation of rain at the surface has in both
precipitation and water vapor isotope values.
• Further research is needed to analyze radiosondes, and
the characteristics of the upper atmosphere during rain
events.
A B
Figure 1: A map of Bermuda, showing where BIOS (Location A) and
Tudor Hill (Location B) are located.
Figure 2: The rain sampling
site is located in BIOS.
Figure 3: Tudor Hill. All meteorological
measuring equipment
Is located at the top of the tower.
Figure 4: Tudor Hill. An example of a sampled rainfall event.
Wind direction, wind speed, temperature, water vapor d18O
vales, rainfall rate, and absolute humidity are all combined to
produce a “snapshot” of the conditions around a rain event.
Figure 5: The lowest water vapor d18O
value for each rain event plotted against
the accompanying precipitation d18O
value for the rain sampled at BIOS.
Figure 6: The change in water vapor d18O
from after each rain event had concluded
to 24 hours after that, plotted against the
accompanying precipitation d18O value for
the rain sampled at BIOS.
C

More Related Content

What's hot

15 evaporation transpiration sublimation
15 evaporation transpiration sublimation15 evaporation transpiration sublimation
15 evaporation transpiration sublimation
University of Zambia, School of Pharmacy, Lusaka, Zambia
 
Abstractions of precipitation ppt
Abstractions of precipitation pptAbstractions of precipitation ppt
Abstractions of precipitation ppt
pradeepkumawat4142
 
Undergraduate Research Poster
Undergraduate Research PosterUndergraduate Research Poster
Undergraduate Research PosterParker Malek
 
Hydrology seminar ppt
Hydrology seminar pptHydrology seminar ppt
Hydrology seminar ppt
PrashantHiremath23
 
COMPARISON OF DIFFERENT METHODS OF ESTIMATING POTENTIAL EVAPOTRANSPIRATION
COMPARISON OF DIFFERENT METHODS OF ESTIMATING POTENTIAL EVAPOTRANSPIRATIONCOMPARISON OF DIFFERENT METHODS OF ESTIMATING POTENTIAL EVAPOTRANSPIRATION
COMPARISON OF DIFFERENT METHODS OF ESTIMATING POTENTIAL EVAPOTRANSPIRATION
Anurag Satpathi
 
BRIEF REVISION - HYDROLOGY - 01. EVAPORATION AND EVAPOTRANSPIRATION
BRIEF REVISION - HYDROLOGY - 01. EVAPORATION AND EVAPOTRANSPIRATIONBRIEF REVISION - HYDROLOGY - 01. EVAPORATION AND EVAPOTRANSPIRATION
BRIEF REVISION - HYDROLOGY - 01. EVAPORATION AND EVAPOTRANSPIRATION
George Dumitrache
 
Abrupt variations in_south_american_mons
Abrupt variations in_south_american_monsAbrupt variations in_south_american_mons
Abrupt variations in_south_american_mons
GeorgeaMelo1
 
Larsen ice shelf has progressively thinned
Larsen ice shelf has progressively thinnedLarsen ice shelf has progressively thinned
Larsen ice shelf has progressively thinned
SimoneBoccuccia
 
Analysis of stable isotopic composition of precipitation in katsina state in
Analysis of stable isotopic composition of precipitation in katsina state inAnalysis of stable isotopic composition of precipitation in katsina state in
Analysis of stable isotopic composition of precipitation in katsina state in
Alexander Decker
 
Approaches for crop et estimation at field scale
Approaches for crop et estimation at field scaleApproaches for crop et estimation at field scale
Approaches for crop et estimation at field scale
Pravash Chandra Moharana
 
River ice jams : risk evaluation, driving conditions and geomorphological imp...
River ice jams : risk evaluation, driving conditions and geomorphological imp...River ice jams : risk evaluation, driving conditions and geomorphological imp...
River ice jams : risk evaluation, driving conditions and geomorphological imp...
etbou24
 
The Sea Level Projections Of USACE EC 1165-2-211 GEER 2010
The Sea Level Projections Of USACE EC 1165-2-211 GEER 2010The Sea Level Projections Of USACE EC 1165-2-211 GEER 2010
The Sea Level Projections Of USACE EC 1165-2-211 GEER 2010
Kris Esterson
 
Ch2 precipitation
Ch2 precipitationCh2 precipitation
Ch2 precipitation
Deenesh Sharma
 
SIMULATED SEASONAL SPATIO-TEMPORAL PATTERNS OF SOIL MOISTURE, TEMPERATURE, AN...
SIMULATED SEASONAL SPATIO-TEMPORAL PATTERNS OF SOIL MOISTURE, TEMPERATURE, AN...SIMULATED SEASONAL SPATIO-TEMPORAL PATTERNS OF SOIL MOISTURE, TEMPERATURE, AN...
SIMULATED SEASONAL SPATIO-TEMPORAL PATTERNS OF SOIL MOISTURE, TEMPERATURE, AN...grssieee
 
Babelene
BabeleneBabelene
Babelene
babelene
 
Presentation by Dr Omar Munyaneza
Presentation by Dr Omar Munyaneza Presentation by Dr Omar Munyaneza
Presentation by Dr Omar Munyaneza
Bosco Hitimana
 
Empirical Analysis of Borehole Temperatures
Empirical Analysis of Borehole TemperaturesEmpirical Analysis of Borehole Temperatures
Empirical Analysis of Borehole TemperaturesStephen C. Gronow
 
15 heat transfer
15 heat transfer15 heat transfer

What's hot (19)

15 evaporation transpiration sublimation
15 evaporation transpiration sublimation15 evaporation transpiration sublimation
15 evaporation transpiration sublimation
 
Abstractions of precipitation ppt
Abstractions of precipitation pptAbstractions of precipitation ppt
Abstractions of precipitation ppt
 
Undergraduate Research Poster
Undergraduate Research PosterUndergraduate Research Poster
Undergraduate Research Poster
 
Hydrology seminar ppt
Hydrology seminar pptHydrology seminar ppt
Hydrology seminar ppt
 
COMPARISON OF DIFFERENT METHODS OF ESTIMATING POTENTIAL EVAPOTRANSPIRATION
COMPARISON OF DIFFERENT METHODS OF ESTIMATING POTENTIAL EVAPOTRANSPIRATIONCOMPARISON OF DIFFERENT METHODS OF ESTIMATING POTENTIAL EVAPOTRANSPIRATION
COMPARISON OF DIFFERENT METHODS OF ESTIMATING POTENTIAL EVAPOTRANSPIRATION
 
BRIEF REVISION - HYDROLOGY - 01. EVAPORATION AND EVAPOTRANSPIRATION
BRIEF REVISION - HYDROLOGY - 01. EVAPORATION AND EVAPOTRANSPIRATIONBRIEF REVISION - HYDROLOGY - 01. EVAPORATION AND EVAPOTRANSPIRATION
BRIEF REVISION - HYDROLOGY - 01. EVAPORATION AND EVAPOTRANSPIRATION
 
Abrupt variations in_south_american_mons
Abrupt variations in_south_american_monsAbrupt variations in_south_american_mons
Abrupt variations in_south_american_mons
 
Larsen ice shelf has progressively thinned
Larsen ice shelf has progressively thinnedLarsen ice shelf has progressively thinned
Larsen ice shelf has progressively thinned
 
Analysis of stable isotopic composition of precipitation in katsina state in
Analysis of stable isotopic composition of precipitation in katsina state inAnalysis of stable isotopic composition of precipitation in katsina state in
Analysis of stable isotopic composition of precipitation in katsina state in
 
Approaches for crop et estimation at field scale
Approaches for crop et estimation at field scaleApproaches for crop et estimation at field scale
Approaches for crop et estimation at field scale
 
River ice jams : risk evaluation, driving conditions and geomorphological imp...
River ice jams : risk evaluation, driving conditions and geomorphological imp...River ice jams : risk evaluation, driving conditions and geomorphological imp...
River ice jams : risk evaluation, driving conditions and geomorphological imp...
 
The Sea Level Projections Of USACE EC 1165-2-211 GEER 2010
The Sea Level Projections Of USACE EC 1165-2-211 GEER 2010The Sea Level Projections Of USACE EC 1165-2-211 GEER 2010
The Sea Level Projections Of USACE EC 1165-2-211 GEER 2010
 
APES Ch. 7
APES Ch. 7APES Ch. 7
APES Ch. 7
 
Ch2 precipitation
Ch2 precipitationCh2 precipitation
Ch2 precipitation
 
SIMULATED SEASONAL SPATIO-TEMPORAL PATTERNS OF SOIL MOISTURE, TEMPERATURE, AN...
SIMULATED SEASONAL SPATIO-TEMPORAL PATTERNS OF SOIL MOISTURE, TEMPERATURE, AN...SIMULATED SEASONAL SPATIO-TEMPORAL PATTERNS OF SOIL MOISTURE, TEMPERATURE, AN...
SIMULATED SEASONAL SPATIO-TEMPORAL PATTERNS OF SOIL MOISTURE, TEMPERATURE, AN...
 
Babelene
BabeleneBabelene
Babelene
 
Presentation by Dr Omar Munyaneza
Presentation by Dr Omar Munyaneza Presentation by Dr Omar Munyaneza
Presentation by Dr Omar Munyaneza
 
Empirical Analysis of Borehole Temperatures
Empirical Analysis of Borehole TemperaturesEmpirical Analysis of Borehole Temperatures
Empirical Analysis of Borehole Temperatures
 
15 heat transfer
15 heat transfer15 heat transfer
15 heat transfer
 

Similar to Poster for BIOS

A climatology analysis of the petrie creek catchment maroochydore australia u...
A climatology analysis of the petrie creek catchment maroochydore australia u...A climatology analysis of the petrie creek catchment maroochydore australia u...
A climatology analysis of the petrie creek catchment maroochydore australia u...Alexander Decker
 
1.Solar-Radiation.Energy.Temp-09.ppt
1.Solar-Radiation.Energy.Temp-09.ppt1.Solar-Radiation.Energy.Temp-09.ppt
1.Solar-Radiation.Energy.Temp-09.ppt
Rasakumar Raj
 
1.Solar-Radiation.Energy.Temp-09.ppt
1.Solar-Radiation.Energy.Temp-09.ppt1.Solar-Radiation.Energy.Temp-09.ppt
1.Solar-Radiation.Energy.Temp-09.ppt
lakshmi sirisha
 
Atmospheric Dispersion in Nuclear Power Plant Siting
Atmospheric Dispersion in Nuclear Power Plant SitingAtmospheric Dispersion in Nuclear Power Plant Siting
Atmospheric Dispersion in Nuclear Power Plant SitingHussain Majid
 
diurnal temperature range trend over North Carolina and the associated mechan...
diurnal temperature range trend over North Carolina and the associated mechan...diurnal temperature range trend over North Carolina and the associated mechan...
diurnal temperature range trend over North Carolina and the associated mechan...
Sayem Zaman, Ph.D, PE.
 
Integrated surface water/groundwater modelling to simulate drought and climat...
Integrated surface water/groundwater modelling to simulate drought and climat...Integrated surface water/groundwater modelling to simulate drought and climat...
Integrated surface water/groundwater modelling to simulate drought and climat...
Dirk Kassenaar M.Sc. P.Eng.
 
Simulating hydrologic response to climate change and drought with an integrat...
Simulating hydrologic response to climate change and drought with an integrat...Simulating hydrologic response to climate change and drought with an integrat...
Simulating hydrologic response to climate change and drought with an integrat...
Dirk Kassenaar M.Sc. P.Eng.
 
Publication_Draft_09Aug
Publication_Draft_09AugPublication_Draft_09Aug
Publication_Draft_09AugKevin Schmidt
 
engineering-hydrology-ppt.pdf
engineering-hydrology-ppt.pdfengineering-hydrology-ppt.pdf
engineering-hydrology-ppt.pdf
govardhanaswamy1
 
The Science of Climate Change r1.pdf
The Science of Climate Change r1.pdfThe Science of Climate Change r1.pdf
The Science of Climate Change r1.pdf
Keith_Shotbolt
 
Satellite Observations Of Rainfall And Water Vapor
Satellite Observations Of Rainfall And Water VaporSatellite Observations Of Rainfall And Water Vapor
Satellite Observations Of Rainfall And Water Vapor
kehowell
 
Assessing Sensitivity to Drought and Climate Change with an Integrated Surfac...
Assessing Sensitivity to Drought and Climate Change with an Integrated Surfac...Assessing Sensitivity to Drought and Climate Change with an Integrated Surfac...
Assessing Sensitivity to Drought and Climate Change with an Integrated Surfac...
Dirk Kassenaar M.Sc. P.Eng.
 
PERMAFROST RUNOFF
PERMAFROST RUNOFFPERMAFROST RUNOFF
PERMAFROST RUNOFF
Shyam Mohan Chaudhary
 
Global warming &climate changes
Global warming &climate changesGlobal warming &climate changes
Global warming &climate changes
Dr. sreeremya S
 
Introduction to Engineering Hydrology
Introduction to Engineering HydrologyIntroduction to Engineering Hydrology
Introduction to Engineering Hydrology
Malla Reddy University
 
Climate Change Basics: Issues and Impacts for Boating
Climate Change Basics:  Issues and Impacts for BoatingClimate Change Basics:  Issues and Impacts for Boating
Climate Change Basics: Issues and Impacts for Boating
NASBLA
 
The True Science of Climate Change - April 2023 r3.pdf
The True Science of Climate Change - April 2023 r3.pdfThe True Science of Climate Change - April 2023 r3.pdf
The True Science of Climate Change - April 2023 r3.pdf
Keith_Shotbolt
 
Incoming solar rediation imbalance
Incoming solar rediation imbalanceIncoming solar rediation imbalance
Incoming solar rediation imbalance
Shubham Pachpor
 
Climate Change Scenarios for Tourist Destinations in the Bahamas: Eluthrea
Climate Change Scenarios for Tourist Destinations in the Bahamas: EluthreaClimate Change Scenarios for Tourist Destinations in the Bahamas: Eluthrea
Climate Change Scenarios for Tourist Destinations in the Bahamas: Eluthrea
intasave-caribsavegroup
 

Similar to Poster for BIOS (20)

A climatology analysis of the petrie creek catchment maroochydore australia u...
A climatology analysis of the petrie creek catchment maroochydore australia u...A climatology analysis of the petrie creek catchment maroochydore australia u...
A climatology analysis of the petrie creek catchment maroochydore australia u...
 
1.Solar-Radiation.Energy.Temp-09.ppt
1.Solar-Radiation.Energy.Temp-09.ppt1.Solar-Radiation.Energy.Temp-09.ppt
1.Solar-Radiation.Energy.Temp-09.ppt
 
1.Solar-Radiation.Energy.Temp-09.ppt
1.Solar-Radiation.Energy.Temp-09.ppt1.Solar-Radiation.Energy.Temp-09.ppt
1.Solar-Radiation.Energy.Temp-09.ppt
 
UHI report 1.4
UHI report 1.4UHI report 1.4
UHI report 1.4
 
Atmospheric Dispersion in Nuclear Power Plant Siting
Atmospheric Dispersion in Nuclear Power Plant SitingAtmospheric Dispersion in Nuclear Power Plant Siting
Atmospheric Dispersion in Nuclear Power Plant Siting
 
diurnal temperature range trend over North Carolina and the associated mechan...
diurnal temperature range trend over North Carolina and the associated mechan...diurnal temperature range trend over North Carolina and the associated mechan...
diurnal temperature range trend over North Carolina and the associated mechan...
 
Integrated surface water/groundwater modelling to simulate drought and climat...
Integrated surface water/groundwater modelling to simulate drought and climat...Integrated surface water/groundwater modelling to simulate drought and climat...
Integrated surface water/groundwater modelling to simulate drought and climat...
 
Simulating hydrologic response to climate change and drought with an integrat...
Simulating hydrologic response to climate change and drought with an integrat...Simulating hydrologic response to climate change and drought with an integrat...
Simulating hydrologic response to climate change and drought with an integrat...
 
Publication_Draft_09Aug
Publication_Draft_09AugPublication_Draft_09Aug
Publication_Draft_09Aug
 
engineering-hydrology-ppt.pdf
engineering-hydrology-ppt.pdfengineering-hydrology-ppt.pdf
engineering-hydrology-ppt.pdf
 
The Science of Climate Change r1.pdf
The Science of Climate Change r1.pdfThe Science of Climate Change r1.pdf
The Science of Climate Change r1.pdf
 
Satellite Observations Of Rainfall And Water Vapor
Satellite Observations Of Rainfall And Water VaporSatellite Observations Of Rainfall And Water Vapor
Satellite Observations Of Rainfall And Water Vapor
 
Assessing Sensitivity to Drought and Climate Change with an Integrated Surfac...
Assessing Sensitivity to Drought and Climate Change with an Integrated Surfac...Assessing Sensitivity to Drought and Climate Change with an Integrated Surfac...
Assessing Sensitivity to Drought and Climate Change with an Integrated Surfac...
 
PERMAFROST RUNOFF
PERMAFROST RUNOFFPERMAFROST RUNOFF
PERMAFROST RUNOFF
 
Global warming &climate changes
Global warming &climate changesGlobal warming &climate changes
Global warming &climate changes
 
Introduction to Engineering Hydrology
Introduction to Engineering HydrologyIntroduction to Engineering Hydrology
Introduction to Engineering Hydrology
 
Climate Change Basics: Issues and Impacts for Boating
Climate Change Basics:  Issues and Impacts for BoatingClimate Change Basics:  Issues and Impacts for Boating
Climate Change Basics: Issues and Impacts for Boating
 
The True Science of Climate Change - April 2023 r3.pdf
The True Science of Climate Change - April 2023 r3.pdfThe True Science of Climate Change - April 2023 r3.pdf
The True Science of Climate Change - April 2023 r3.pdf
 
Incoming solar rediation imbalance
Incoming solar rediation imbalanceIncoming solar rediation imbalance
Incoming solar rediation imbalance
 
Climate Change Scenarios for Tourist Destinations in the Bahamas: Eluthrea
Climate Change Scenarios for Tourist Destinations in the Bahamas: EluthreaClimate Change Scenarios for Tourist Destinations in the Bahamas: Eluthrea
Climate Change Scenarios for Tourist Destinations in the Bahamas: Eluthrea
 

Poster for BIOS

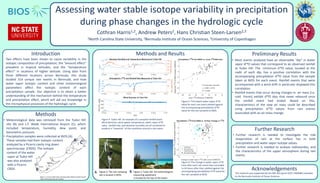
  • 1. Assessing water stable isotope variability in precipitation during phase changes in the hydrologic cycle Cothran Harris1,2, Andrew Peters2, Hans Christian Steen-Larsen2,3 1North Carolina State University, 2Bermuda Institute of Ocean Sciences, 3University of Copenhagen Introduction Acknowledgements This research was supported by the NSF-REU grant (OCE-1460686) awarded to the Bermuda Institute of Ocean Sciences Two effects have been shown to cause variability in the isotopic composition of precipitation; the “amount effect” prevalent in tropical latitudes, and the “temperature effect” in locations of higher latitude. Using data from three different locations across Bermuda, this study studied 314 unique rain events in Bermuda, and how water vapor isotopic content and other meteorological parameters affect the isotopic content of each precipitation sample. Our objective is to attain a better understanding of the mechanism behind the temperature and precipitation effect, which will aid out knowledge in the microphysical processes of the hydrologic cycle. Methods • Meteorological data was retrieved from the Tudor Hill site (B) and L.F. Wade International Airport (C), which included temperature, humidity, dew point, and barometric pressure. • Precipitation samples were collected at BIOS (A). These samples had their isotopic content analyzed by a Picarro cavity ring down spectroscopy (CRDS). The isotopic content of the water vapor at Tudor Hill was also analyzed with a Picarro CRDS. A B Figure 3: Tudor Hill. All meteorological measuring equipment Is located at the top of the tower. Methods and Results Preliminary Results • Most events analyzed have an observable “dip” in water vapor d18O values that correspond to an observed rainfall at Tudor Hill. The minimum d18O value, located at the nadir of each dip, has a positive correlation with the accompanying precipitation d18O value from the sample taken at BIOS for each event. Rainfall events that were accompanied with a wind shift in particular displayed this correlation. • Rainfall events that occur during changes in air mass (i.e. cold fronts) exhibit d18O dips that never rebound once the rainfall event had ended. Based on this, characteristics of the new air mass could be described using precipitation d18O values from rain events associated with an air mass change. Further Research • Further research is needed to investigate the role evaporation of rain at the surface has in both precipitation and water vapor isotope values. • Further research is needed to analyze radiosondes, and the characteristics of the upper atmosphere during rain events. A B Figure 1: A map of Bermuda, showing where BIOS (Location A) and Tudor Hill (Location B) are located. Figure 2: The rain sampling site is located in BIOS. Figure 3: Tudor Hill. All meteorological measuring equipment Is located at the top of the tower. Figure 4: Tudor Hill. An example of a sampled rainfall event. Wind direction, wind speed, temperature, water vapor d18O vales, rainfall rate, and absolute humidity are all combined to produce a “snapshot” of the conditions around a rain event. Figure 5: The lowest water vapor d18O value for each rain event plotted against the accompanying precipitation d18O value for the rain sampled at BIOS. Figure 6: The change in water vapor d18O from after each rain event had concluded to 24 hours after that, plotted against the accompanying precipitation d18O value for the rain sampled at BIOS. C