Lutes, C. and J. Minchak “Non-residential Building Vapor Intrusion (VI) Lifecycle Cost – When Is Preemptive Mitigation a Good Value?” Poster presentation at Tenth International Conference on Remediation of Chlorinated and Recalcitrant Compounds, May 2016, Palm Springs CA.
Call Girls Budhwar Peth Call Me 7737669865 Budget Friendly No Advance Booking
Economics poster 2 jdm rev3_lgl clfinal
1. Vapor intrusion site decision makers frequently have to balance the
cost/benefit ratios of alternative decisions with incomplete information –
such as making a risk management decision at a building where only one
round of indoor air data has been collected with concentrations that exceed
risk-based levels. EPA’s 2015 Vapor Intrusion Guidance suggests weighing
the possibility of preemptive mitigation (PEM)/early action based on a
“consideration of the Operation and Maintenance (O&M) and monitoring
obligations.” The guidance also encourages awareness of the “social costs”
of disrupting building occupants and community concerns with health effects
during an extended investigation period. The economic and disruption
implications of two basic PEM scenarios versus extensive monitoring to
describe temporal variability will be compared in this poster. Results show
that PEM can raise the economic life cycle cost, if there is a reasonable
chance that monitoring will lead to a decision not to mitigate. But if the
probability of mitigation becomes high; then several rounds of monitoring to
describe temporal variability followed by a likely mitigation increases
probable costs. The PEM and monitoring intensive cases have very
different annual cash flow requirements. For mitigation the most cost
sensitive variables are complexity of the building (number of
foundations/suites), size, and soil type. Mitigation cost per square foot drops
considerably in large, but relatively simple and open buildings. Cost should
not be the only consideration in selecting an option, occupant disturbance
can also be an important consideration.
Abstract
Objectives Discussion/Conclusions
Delivering Sustainable Solutions to
Complex Local Challenges, Worldwide
Non-residential Building Vapor Intrusion (VI) Lifecycle Cost –
When Is Preemptive Mitigation a Good Value?
Christopher Lutes (Christopher.Lutes@ch2m.com) (CH2M, Raleigh, NC, USA)
Jeffrey Minchak (Jeffrey.Minchak@CH2M.com) (CH2M, Albuquerque, NM, USA)
Understand the factors that determine if preemptive mitigation is a good
economic value in commercial buildings when compared to a more extensive
monitoring approach.
Compare the disruption caused by the preemptive mitigation vs. the primarily
monitoring alternatives.
Make an informed decision that balances the economic, environmental risk
and building occupant disturbance.
Sign graphic from: http://www.soc.ucsb.edu/
Door knock image from: http://www.townofclaytonnc.org
Poster Copyright 2016 by CH2M. Reproduction and distribution in whole or
in part without the written consent of CH2M is prohibited.
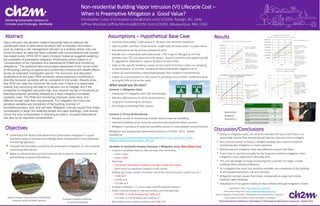
Assumptions – Hypothetical Base Case
Typical medium sized commercial building
showing variety of HVAC systems
Example complex multisuite
commercial building
Results
• Going to mitigation early can raise the ultimate life cycle cost if there is a
reasonable chance that monitoring will lead to a decision not to mitigate.
• But if almost certain to have to mitigate anyway, then several rounds of
monitoring plus mitigation is more expensive.
• Monitoring and mitigation have very different annual cash flows.
• If you have to monitor annually for the long term without mitigation, then
mitigation is less expensive in the long term.
• The cost advantage of trying monitoring first is greater for larger, simple
buildings (few suites/foundations)
• For mitigation the most cost sensitive variables are complexity of the building
(# of foundations/suites), size and soil type.
• Mitigation cost per square foot drops considerably in large, but simple,
relatively open buildings.
• Disturbance of occupants similar (in days visited) although mitigation noisier
• Commercial building: 7,200 square ft, 30 years old, Northern California,
• Slab on grade, one floor, three tenants; single style of construction; no open doors
• Not believed to be the primary release location
• Overall site is reasonably well understood – PCE in gw at 500 µg/l at 15 ft bls
(aerobic case, TCE not expected to be driver). Source treatment just beginning 200
ft. upgradient, expected to require 30 years to reach VISLs
• Data on this specific building consists of one round of 24 hour indoor air sampling,
at two locations, in summer. Compound ratios potentially suggestive of VI.
• Indoor air concentrations substantially greater then ambient concentrations.
• Indoor air concentrations in one round of sampling (normal HVAC conditions) were
at roughly 50% of the action level.
What would you do next?
Scenario 1: Mitigation Early
• Implement VI mitigation with SSD immediately.
• Monitor effectiveness to verify protectiveness
• Long term monitoring for 30 years.
• No change to building HVAC system.
Scenario 2: Primarily Monitoring
• Multiple rounds of monitoring to better define seasonal variability;
• Intensive building survey to locate and eliminate potential indoor sources.
• Mitigate if necessary (If seasonal variability results in unacceptable concentrations)
Mitigation and monitoring requirements based on CA DTSC, 2011. Details
available at
https://iavi.rti.org/attachments/WorkshopsAndConferences/07_Lutes_Commercial_Building_
Mitigation%20Economic%20AnalysisCL_JDM7.pdf
Variables in Sensitivity Analysis (Scenario 1 Mitigation Early, Red is Base Case)
• Long term sampling frequency after passing initial monitoring
– Every 3 years
– Every 5 years
• Reporting
– Full written reporting to occupants and agency after each round
– Brief report (no significant changes) in later rounds
• Building size (scales number of samples, size of fan, extraction points, capital cost etc.)
– 7,000 sq ft
– 35,000 sq ft
– 175,000 sq ft
• Building Complexity: 1, 3, 10 occupied suites/foundation additions
• System Intensity (based on soils permeability and heterogeneity)
– 45 ft ROI; 0.14 HP of blower per 1,000 sq. ft.
– 15 ft ROI; 0.5 HP of blower per 1,000 sq. ft.
• New indoor source analysis response cost $10K, $1K Tenth International Conference on Remediation of Chlorinated and Recalcitrant Compounds - Battelle 2016
Case Description $K total
cost over
30 years
% Change
From Base
Case
Base case 314
LTM increased to every three from every five years 341 +9
Reporting in outyears brief letter only if no significant
changes
299 -5
Building complexity decreased to one suite/foundation
from three
289 -8
Building complexity increased to ten suites/foundations
from three
457 +46
New indoor source analysis response cost decreased
from $10K to $1K per event (still with 10% likelihood)
307 -2
Sensitivity
Analysis:
Scenario 1