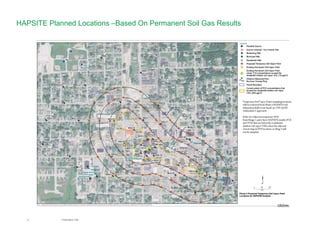
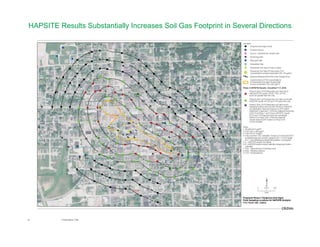
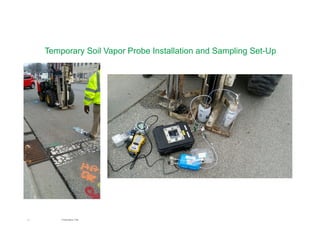
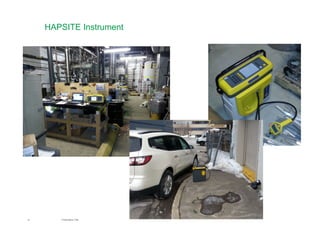
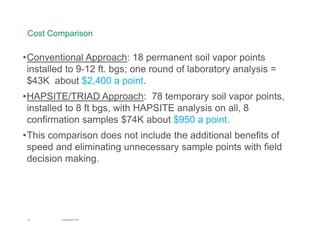
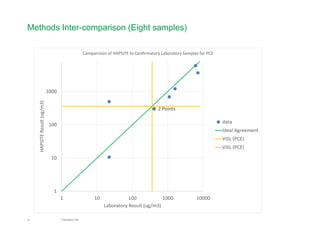
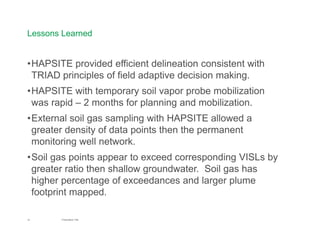
1 Presentation Title
Rapid, Efficient Delineation Of VI Potential From Large Soil Gas Plume
Using HAPSITE and Other Lines of Evidence (Single Slide Summary)
Chris Lutes, CH2M Hill Christopher.Lutes@ch2m.com
• Small town in Indiana; Residential and Commercial areas (pop. = ~5,000) 
• Five of 36 monitoring wells screened over the “shallow” aquifer (5‐23 ft bgs) have PCE 
concentrations in groundwater greater than the residential VISL (~26 µg/L) (14% of wells 
exceed)
• Permanent soil vapor probes (SVP) installed to a depth of one foot above the top of water 
table. Top of water table ranged from 8 to 12 bgs.  A total of 15 of 18 SVPs have PCE 
concentrations that exceed the residential subslab VISL (~360 mg/m3).  (83% of SVPs 
exceed)
• HAPSITE 80 soil gas locations around the site, to delineate the extent of the soil vapor plume 
and guide EPA Emergency Response (size, shape, chemical nature of plume); 
• 80 points completed in 5 days; 8 ft depth (42% exceeded VISL). Comparison presented to 8 
confirmatory lab samples
• Plume size – 4 acres (GW); 13 acres (permanent soil gas points); 87 acres (after HAPSITE Soil 
gas). Plume shape differed.
• HAPSITE provided efficient, economical  delineation consistent with TRIAD principles of field 
adaptive decision making.
Rapid, Efficient Delineation From VI Potential
of A Large Soil Gas Plume Using HAPSITE
and Other Lines of Evidence
Chris Lutes and Jennifer Knoepfle, Ph.D., P.G
3 Presentation Title
•Small town in Indiana; EPA led NPL Site
•Residential and Commercial (pop. = ~5,000) 
•Unconsolidated sand and gravel aquifer (0‐~90 ft bgs) overlies shale 
bedrock 
•Municipal water extracts (~10‐20 µg/L) (drawn from entire aquifer 15 – 90 
ft bgs) exceed the MCL (5 g/L) for PCE
•Five of 36 monitoring wells screened over the “shallow” aquifer (5‐23 ft
bgs) have PCE concentrations in groundwater greater than the residential 
VISL (~26 µg/L) (14% of wells exceed)
•Permanent soil vapor probes (SVP) installed to a depth of one foot above 
the top of water table. Top of water table ranged from 8 to 12 bgs.  A total 
of 15 of 18 SVPs have PCE concentrations that exceed the residential 
subslab VISL (~360 g/m3).  (83% of SVPs exceed)
•Some residents still use private wells screened in the shallow aquifer 
Site Setting
4 Presentation Title
Basic History
•1986‐1991: Industrial dry cleaner (source) 
was operational (PCE contamination)
•2003 – 2008: EPA removal action (soil 
excavation + AS‐SVE in and adjacent to 
source)
•2010: IDEM noticed PCE impacted municipal 
wells exceed PCE MCL and town treats 
water through carbon filtration 
•2015: Region/CH2M began RI efforts (4 field 
events)
•2016: Subslab and Indoor Air Sampling 
Underway by EPA
5 Presentation Title
Recent Investigation Approach
•August 2015: PCE (and TCE) soil vapor plume – 15 of 18 permanent 
SVP exceeded the PCE VISL
•Five locations exceeding the IDEM action levels and EPA Removal 
Management Levels (RMLs) for PCE (2 locations for TCE)
– Soil Vapor Max concentrations 170,000 g/m3 (PCE) and 12,000 
(TCE)
•August 2015: Bulk soil concentrations (discrete depth) for PCE and 
TCE exceeded residential RSLs in one permanent SVP location. Soil 
considered delineated.
•October 2015: PCE “residual” groundwater plume – considered 
delineated (120 g/L= max GW PCE concentration)
6 Presentation Title
December 2015: HAPSITE soil vapor investigation
•80 soil gas locations around the site, to delineate the extent 
of the soil vapor plume and guide EPA Emergency Response 
(size, shape, chemical nature of plume); 
•80 points completed in 5 days; 8 ft depth (42% exceeded 
VISL).  Project included 8 confirmatory lab samples
•2016 Removal branch/START has recently performed targeted 
subslab and indoor air sampling  (results pending)
•May 2016: 2nd HAPSITE soil gas investigation is proposed 
based on results from December 2015 to complete soil vapor 
delineation
7 Presentation Title
Comparison of Effected GW/Soil Vapor Plume Dimensions
•Plume based on locations were GW PCE concentrations exceeded
VISLs
– ~9 buildings
– ~164,000 ft2 (two small plumes 60,000 ft2 and 104,000 ft2 each)
– ~3.9 acres (two small plumes 2.4 acres and 1.4 acres each)
•Plume based on results from results from permanent soil gas points
– ~18 buildings
– ~585,000 ft2 plume area
– ~13.4 acres
•Plume based on results from First HAPSITE investigation
– ~178 buildings
– ~3,796,900 ft2 plume area
– ~87.1 acres
8 Presentation Title
Plume Map Based on Groundwater VISL Exceedances
9 Presentation Title
HAPSITE Planned Locations –Based On Permanent Soil Gas Results
10 Presentation Title
HAPSITE Results Substantially Increases Soil Gas Footprint in Several Directions
11 Presentation Title
Temporary Soil Vapor Probe Installation and Sampling Set-Up
12 Presentation Title
HAPSITE Instrument
13 Presentation Title
Cost Comparison
•Conventional Approach: 18 permanent soil vapor points
installed to 9-12 ft. bgs; one round of laboratory analysis =
$43K about $2,400 a point.
•HAPSITE/TRIAD Approach: 78 temporary soil vapor points,
installed to 8 ft bgs, with HAPSITE analysis on all, 8
confirmation samples $74K about $950 a point.
•This comparison does not include the additional benefits of
speed and eliminating unnecessary sample points with field
decision making.
14 Presentation Title
HAPSITE Output
15 Presentation Title
Methods Inter-comparison (Eight samples)
2 Points 
1
10
100
1000
1 10 100 1000 10000
HAPSITE Result (ug/m3)
Laboratory Result (ug/m3)
Comparision of HAPSITE to Confirmatory Laboratory Samples for PCE
data
Ideal Agreement
VISL (PCE)
VISL (PCE)
16 Presentation Title
Lessons Learned
•HAPSITE provided efficient delineation consistent with
TRIAD principles of field adaptive decision making.
•HAPSITE with temporary soil vapor probe mobilization
was rapid – 2 months for planning and mobilization.
•External soil gas sampling with HAPSITE allowed a
greater density of data points then the permanent
monitoring well network.
•Soil gas points appear to exceed corresponding VISLs by
greater ratio then shallow groundwater. Soil gas has
higher percentage of exceedances and larger plume
footprint mapped.

Hapsite large plume slide

  • 1.
    1 Presentation Title Rapid,Efficient Delineation Of VI Potential From Large Soil Gas Plume Using HAPSITE and Other Lines of Evidence (Single Slide Summary) Chris Lutes, CH2M Hill Christopher.Lutes@ch2m.com • Small town in Indiana; Residential and Commercial areas (pop. = ~5,000)  • Five of 36 monitoring wells screened over the “shallow” aquifer (5‐23 ft bgs) have PCE  concentrations in groundwater greater than the residential VISL (~26 µg/L) (14% of wells  exceed) • Permanent soil vapor probes (SVP) installed to a depth of one foot above the top of water  table. Top of water table ranged from 8 to 12 bgs.  A total of 15 of 18 SVPs have PCE  concentrations that exceed the residential subslab VISL (~360 mg/m3).  (83% of SVPs  exceed) • HAPSITE 80 soil gas locations around the site, to delineate the extent of the soil vapor plume  and guide EPA Emergency Response (size, shape, chemical nature of plume);  • 80 points completed in 5 days; 8 ft depth (42% exceeded VISL). Comparison presented to 8  confirmatory lab samples • Plume size – 4 acres (GW); 13 acres (permanent soil gas points); 87 acres (after HAPSITE Soil  gas). Plume shape differed. • HAPSITE provided efficient, economical  delineation consistent with TRIAD principles of field  adaptive decision making.
  • 2.
    Rapid, Efficient DelineationFrom VI Potential of A Large Soil Gas Plume Using HAPSITE and Other Lines of Evidence Chris Lutes and Jennifer Knoepfle, Ph.D., P.G
  • 3.
    3 Presentation Title •Small town in Indiana; EPA led NPL Site •Residential and Commercial (pop. = ~5,000)  •Unconsolidated sand and gravel aquifer (0‐~90 ftbgs) overlies shale  bedrock  •Municipal water extracts (~10‐20 µg/L) (drawn from entire aquifer 15 – 90  ft bgs) exceed the MCL (5 g/L) for PCE •Five of 36 monitoring wells screened over the “shallow” aquifer (5‐23 ft bgs) have PCE concentrations in groundwater greater than the residential  VISL (~26 µg/L) (14% of wells exceed) •Permanent soil vapor probes (SVP) installed to a depth of one foot above  the top of water table. Top of water table ranged from 8 to 12 bgs.  A total  of 15 of 18 SVPs have PCE concentrations that exceed the residential  subslab VISL (~360 g/m3).  (83% of SVPs exceed) •Some residents still use private wells screened in the shallow aquifer  Site Setting
  • 4.
    4 Presentation Title BasicHistory •1986‐1991: Industrial dry cleaner (source)  was operational (PCE contamination) •2003 – 2008: EPA removal action (soil  excavation + AS‐SVE in and adjacent to  source) •2010: IDEM noticed PCE impacted municipal  wells exceed PCE MCL and town treats  water through carbon filtration  •2015: Region/CH2M began RI efforts (4 field  events) •2016: Subslab and Indoor Air Sampling  Underway by EPA
  • 5.
    5 Presentation Title RecentInvestigation Approach •August 2015: PCE (and TCE) soil vapor plume – 15 of 18 permanent  SVP exceeded the PCE VISL •Five locations exceeding the IDEM action levels and EPA Removal  Management Levels (RMLs) for PCE (2 locations for TCE) – Soil Vapor Max concentrations 170,000 g/m3 (PCE) and 12,000  (TCE) •August 2015: Bulk soil concentrations (discrete depth) for PCE and  TCE exceeded residential RSLs in one permanent SVP location. Soil  considered delineated. •October 2015: PCE “residual” groundwater plume – considered  delineated (120 g/L= max GW PCE concentration)
  • 6.
    6 Presentation Title December2015: HAPSITE soil vapor investigation •80 soil gas locations around the site, to delineate the extent  of the soil vapor plume and guide EPA Emergency Response  (size, shape, chemical nature of plume);  •80 points completed in 5 days; 8 ft depth (42% exceeded  VISL).  Project included 8 confirmatory lab samples •2016 Removal branch/START has recently performed targeted  subslab and indoor air sampling  (results pending) •May 2016: 2nd HAPSITE soil gas investigation is proposed  based on results from December 2015 to complete soil vapor  delineation
  • 7.
    7 Presentation Title Comparisonof Effected GW/Soil Vapor Plume Dimensions •Plume based on locations were GW PCE concentrations exceeded VISLs – ~9 buildings – ~164,000 ft2 (two small plumes 60,000 ft2 and 104,000 ft2 each) – ~3.9 acres (two small plumes 2.4 acres and 1.4 acres each) •Plume based on results from results from permanent soil gas points – ~18 buildings – ~585,000 ft2 plume area – ~13.4 acres •Plume based on results from First HAPSITE investigation – ~178 buildings – ~3,796,900 ft2 plume area – ~87.1 acres
  • 8.
    8 Presentation Title PlumeMap Based on Groundwater VISL Exceedances
  • 9.
    9 Presentation Title HAPSITEPlanned Locations –Based On Permanent Soil Gas Results
  • 10.
    10 Presentation Title HAPSITEResults Substantially Increases Soil Gas Footprint in Several Directions
  • 11.
    11 Presentation Title TemporarySoil Vapor Probe Installation and Sampling Set-Up
  • 12.
  • 13.
    13 Presentation Title CostComparison •Conventional Approach: 18 permanent soil vapor points installed to 9-12 ft. bgs; one round of laboratory analysis = $43K about $2,400 a point. •HAPSITE/TRIAD Approach: 78 temporary soil vapor points, installed to 8 ft bgs, with HAPSITE analysis on all, 8 confirmation samples $74K about $950 a point. •This comparison does not include the additional benefits of speed and eliminating unnecessary sample points with field decision making.
  • 14.
  • 15.
    15 Presentation Title MethodsInter-comparison (Eight samples) 2 Points  1 10 100 1000 1 10 100 1000 10000 HAPSITE Result (ug/m3) Laboratory Result (ug/m3) Comparision of HAPSITE to Confirmatory Laboratory Samples for PCE data Ideal Agreement VISL (PCE) VISL (PCE)
  • 16.
    16 Presentation Title LessonsLearned •HAPSITE provided efficient delineation consistent with TRIAD principles of field adaptive decision making. •HAPSITE with temporary soil vapor probe mobilization was rapid – 2 months for planning and mobilization. •External soil gas sampling with HAPSITE allowed a greater density of data points then the permanent monitoring well network. •Soil gas points appear to exceed corresponding VISLs by greater ratio then shallow groundwater. Soil gas has higher percentage of exceedances and larger plume footprint mapped.