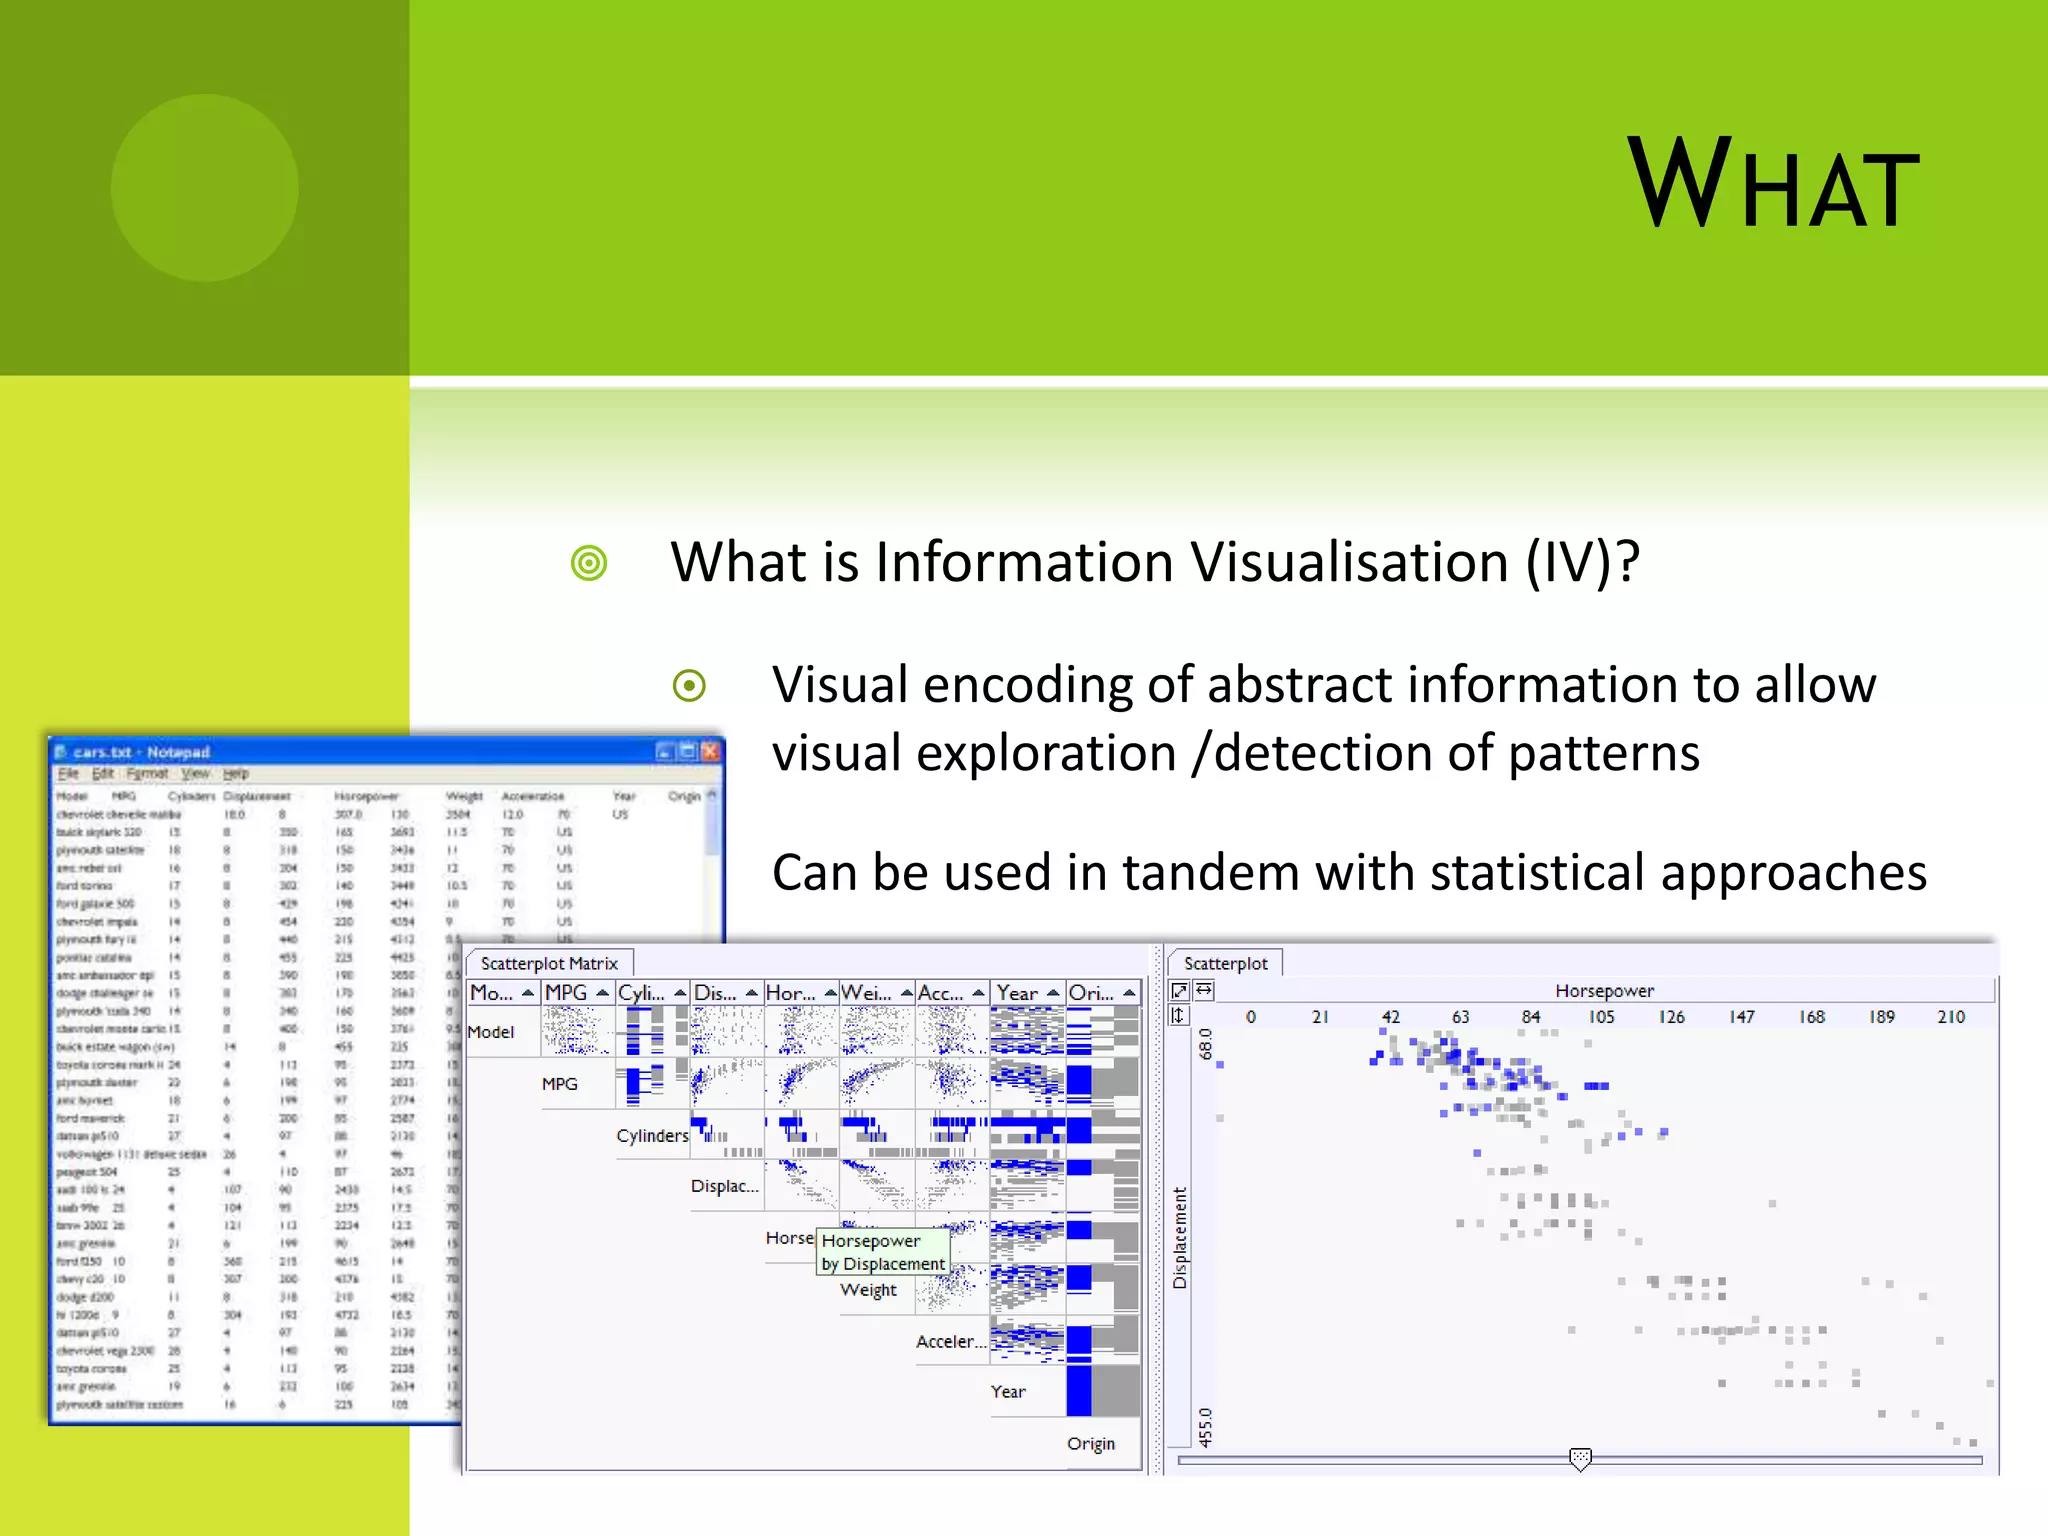
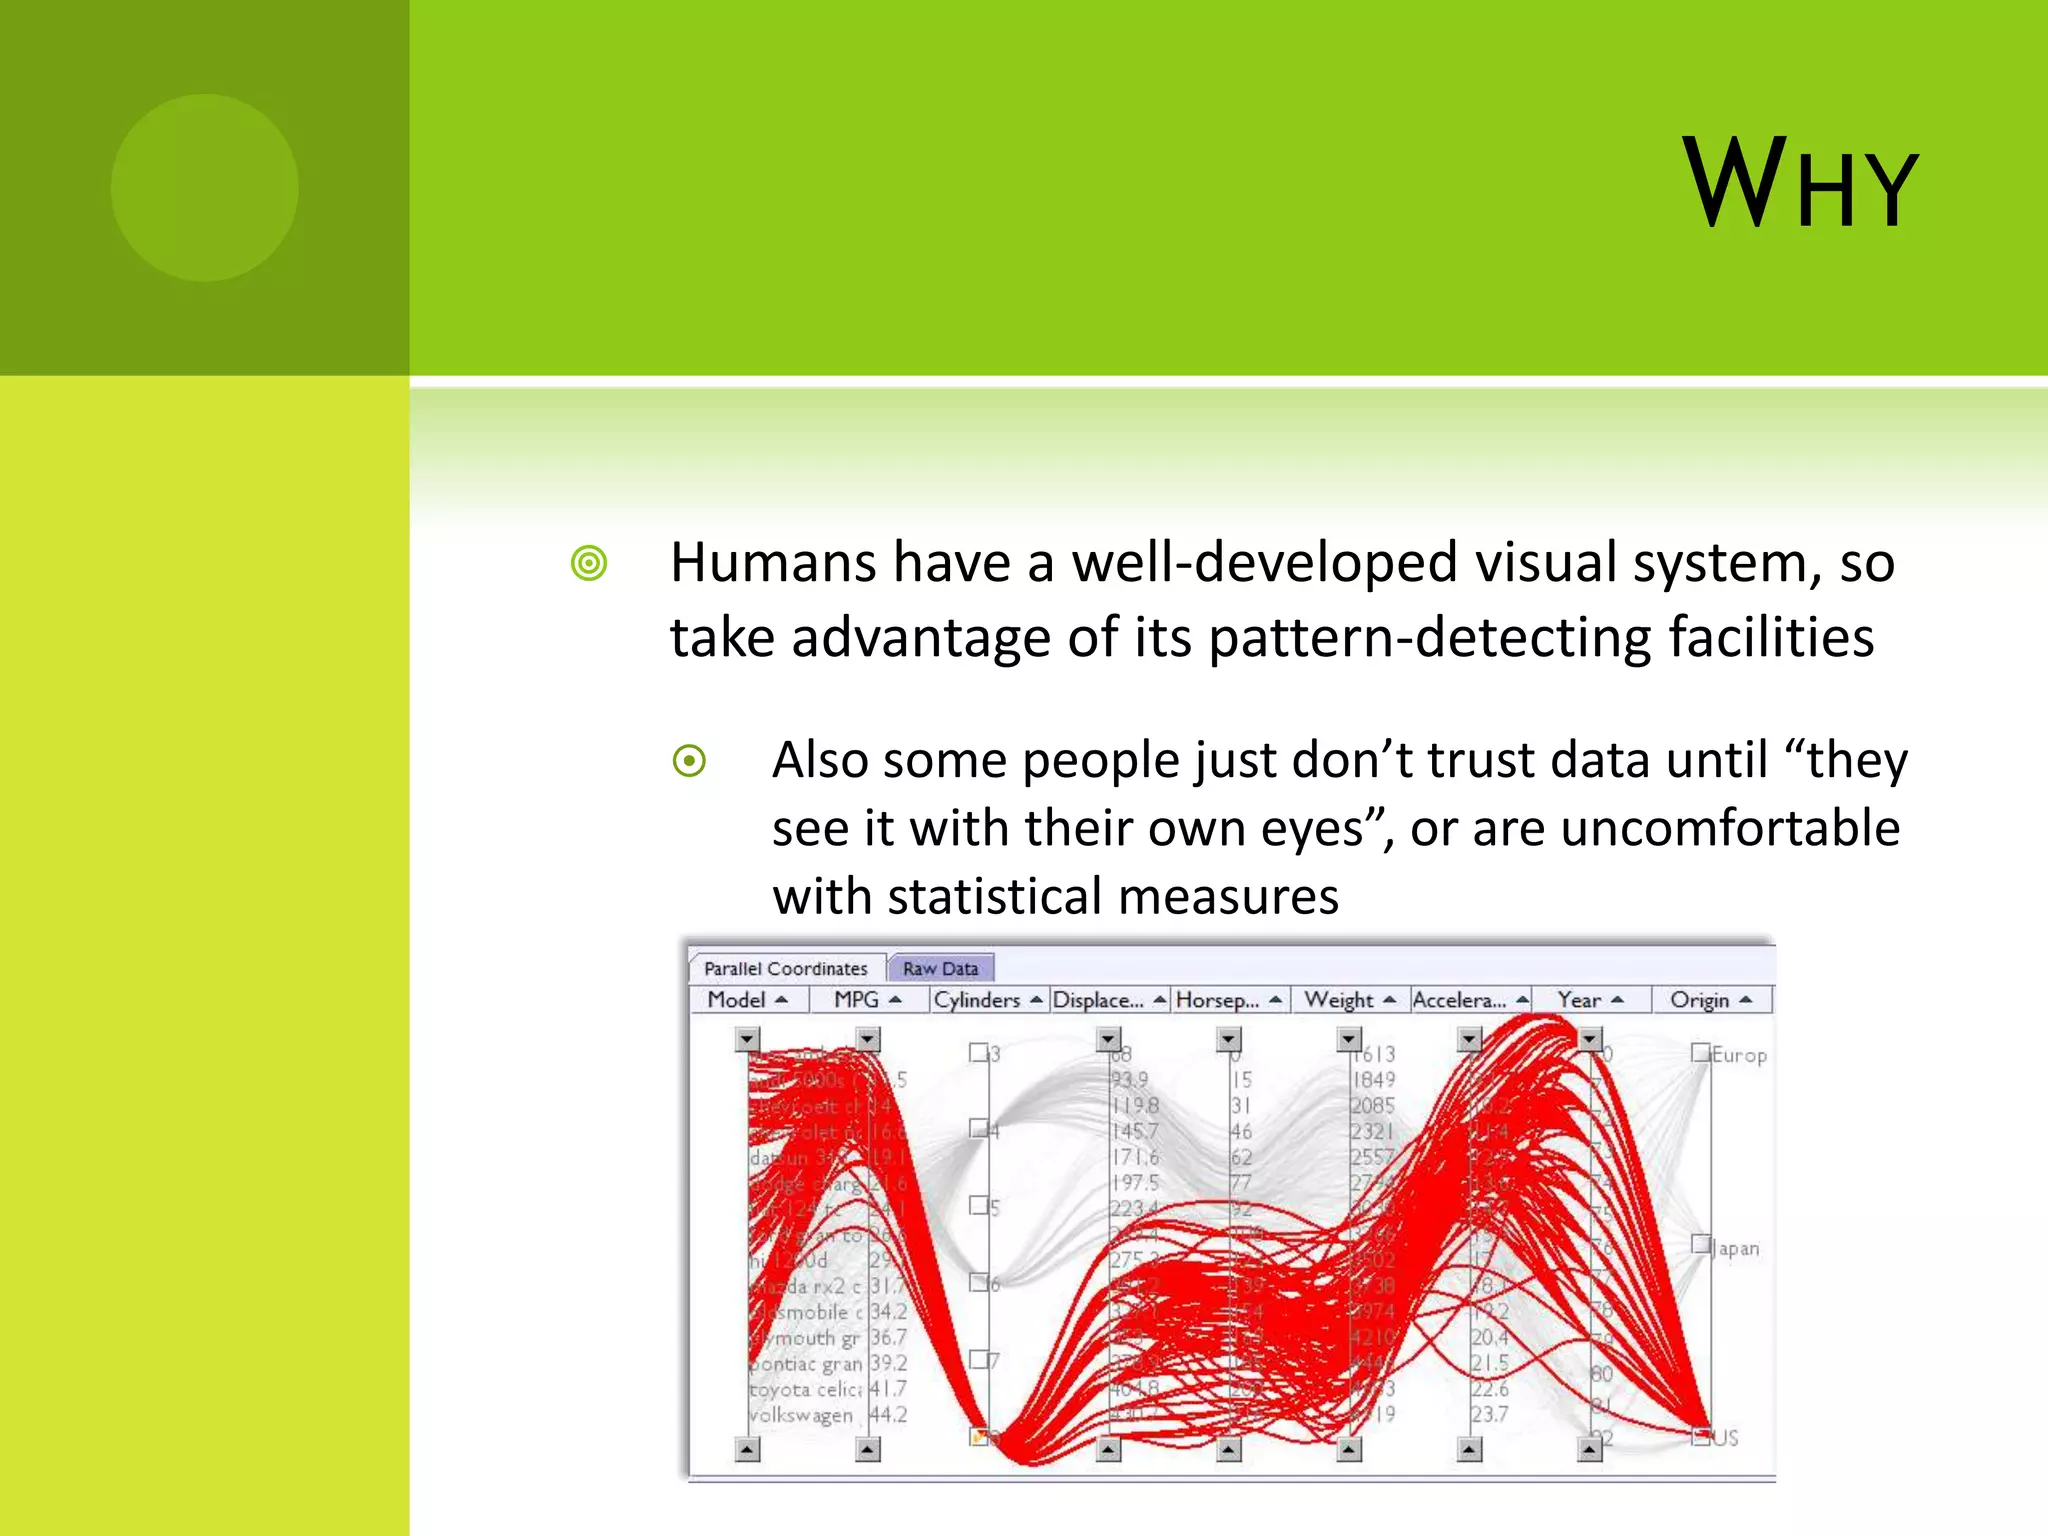
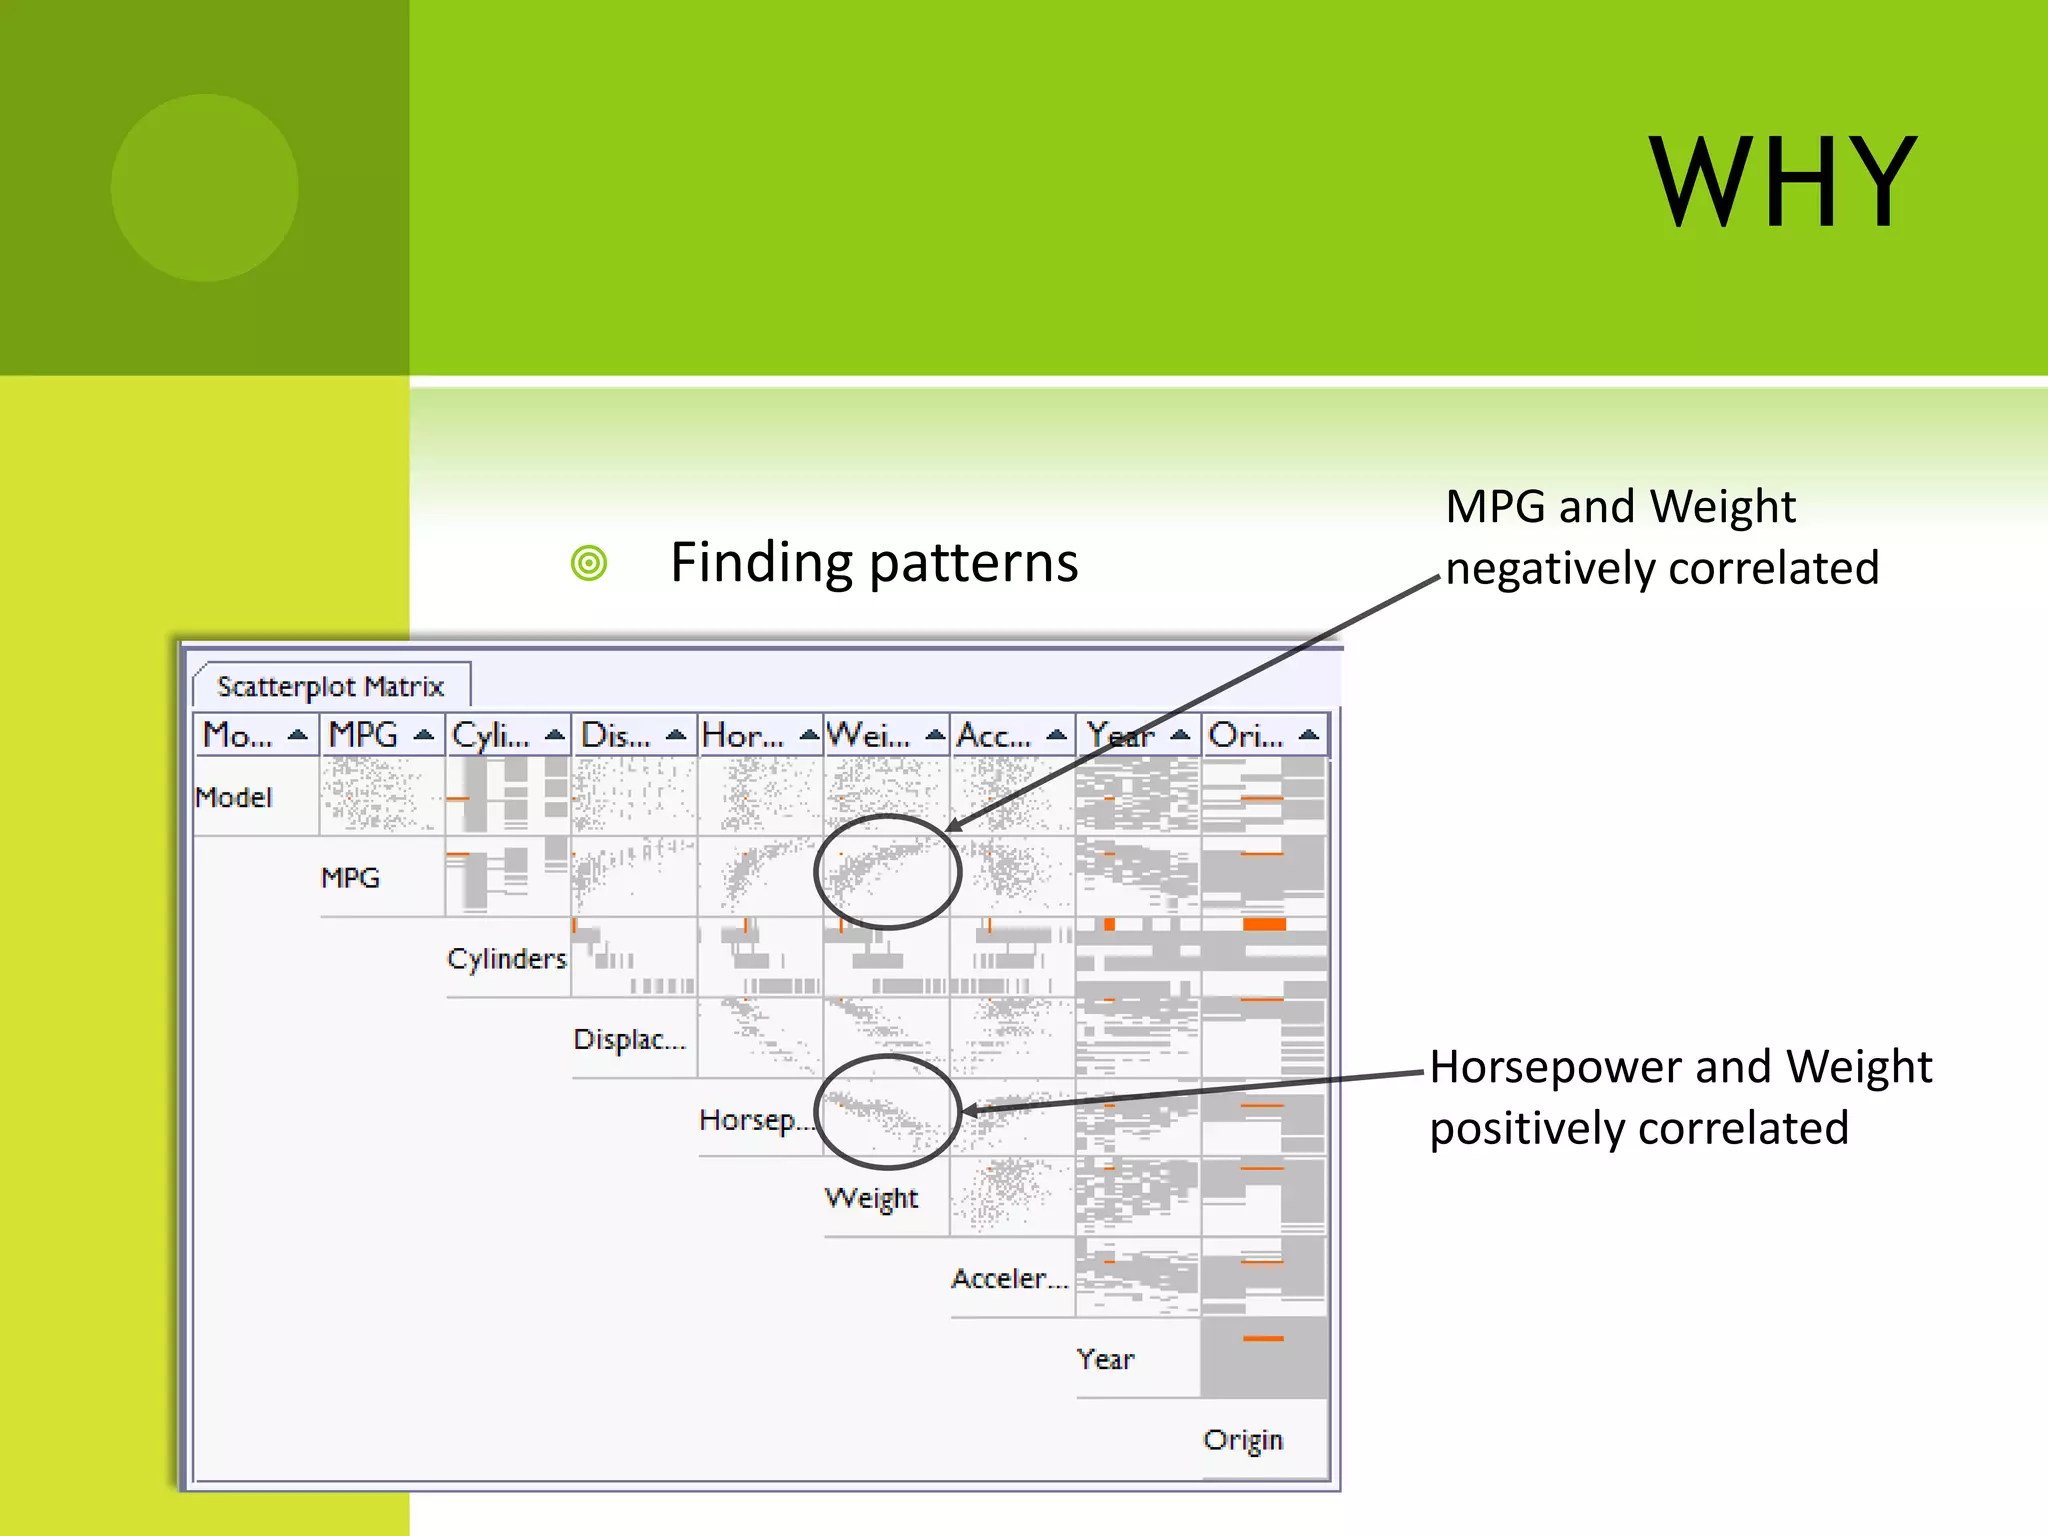
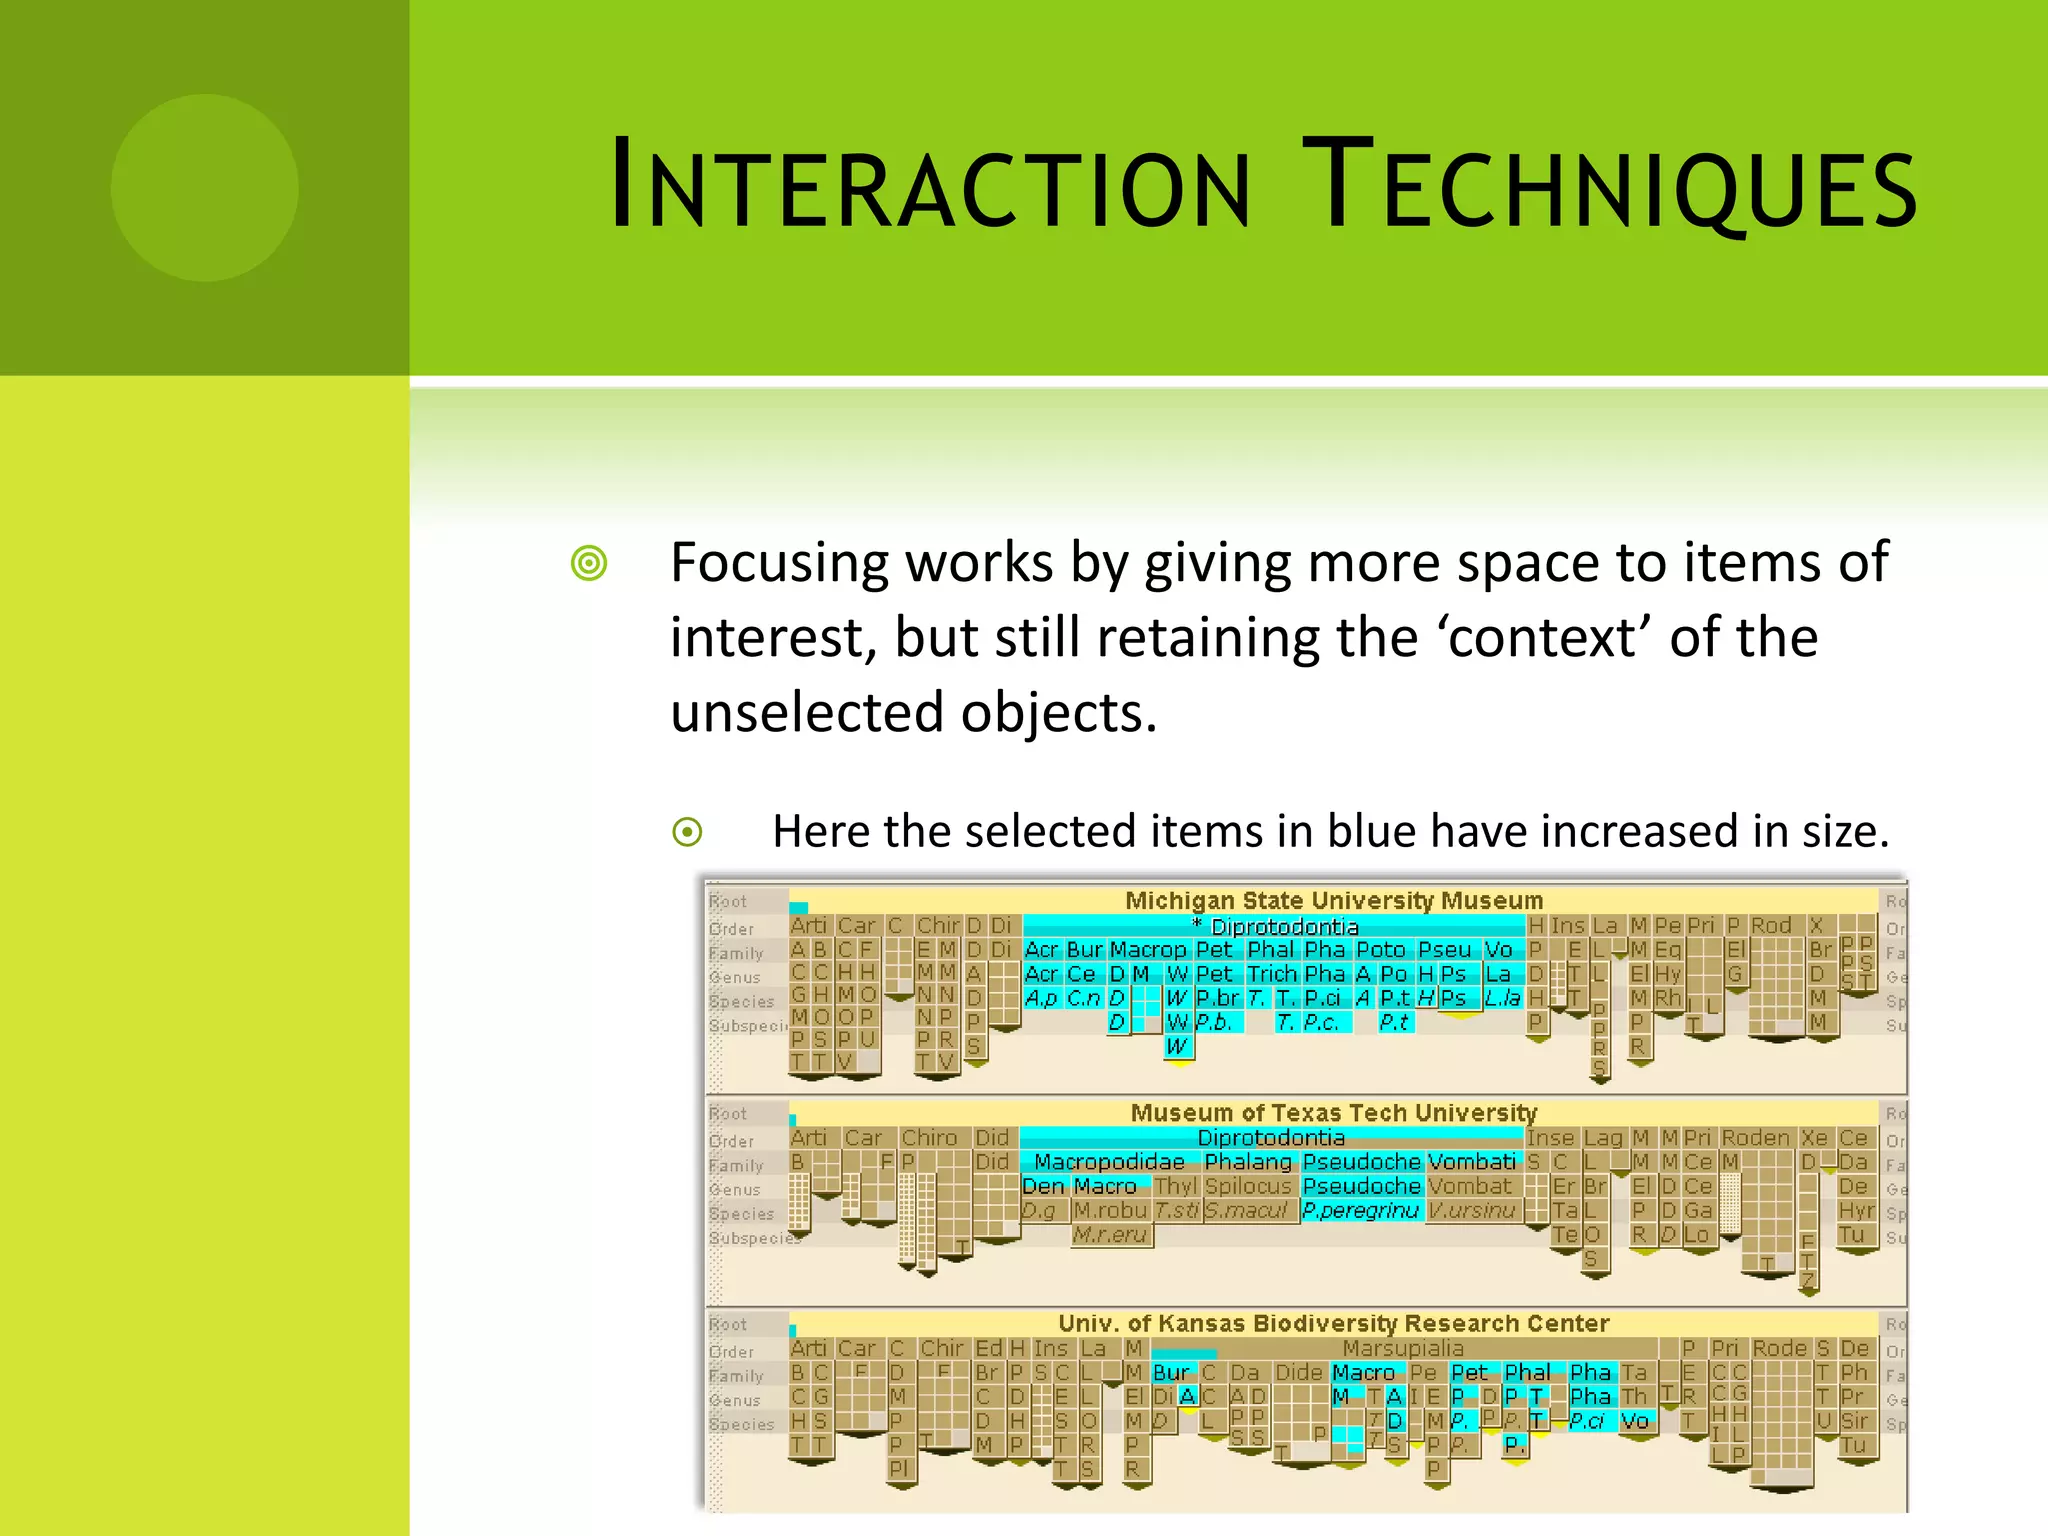
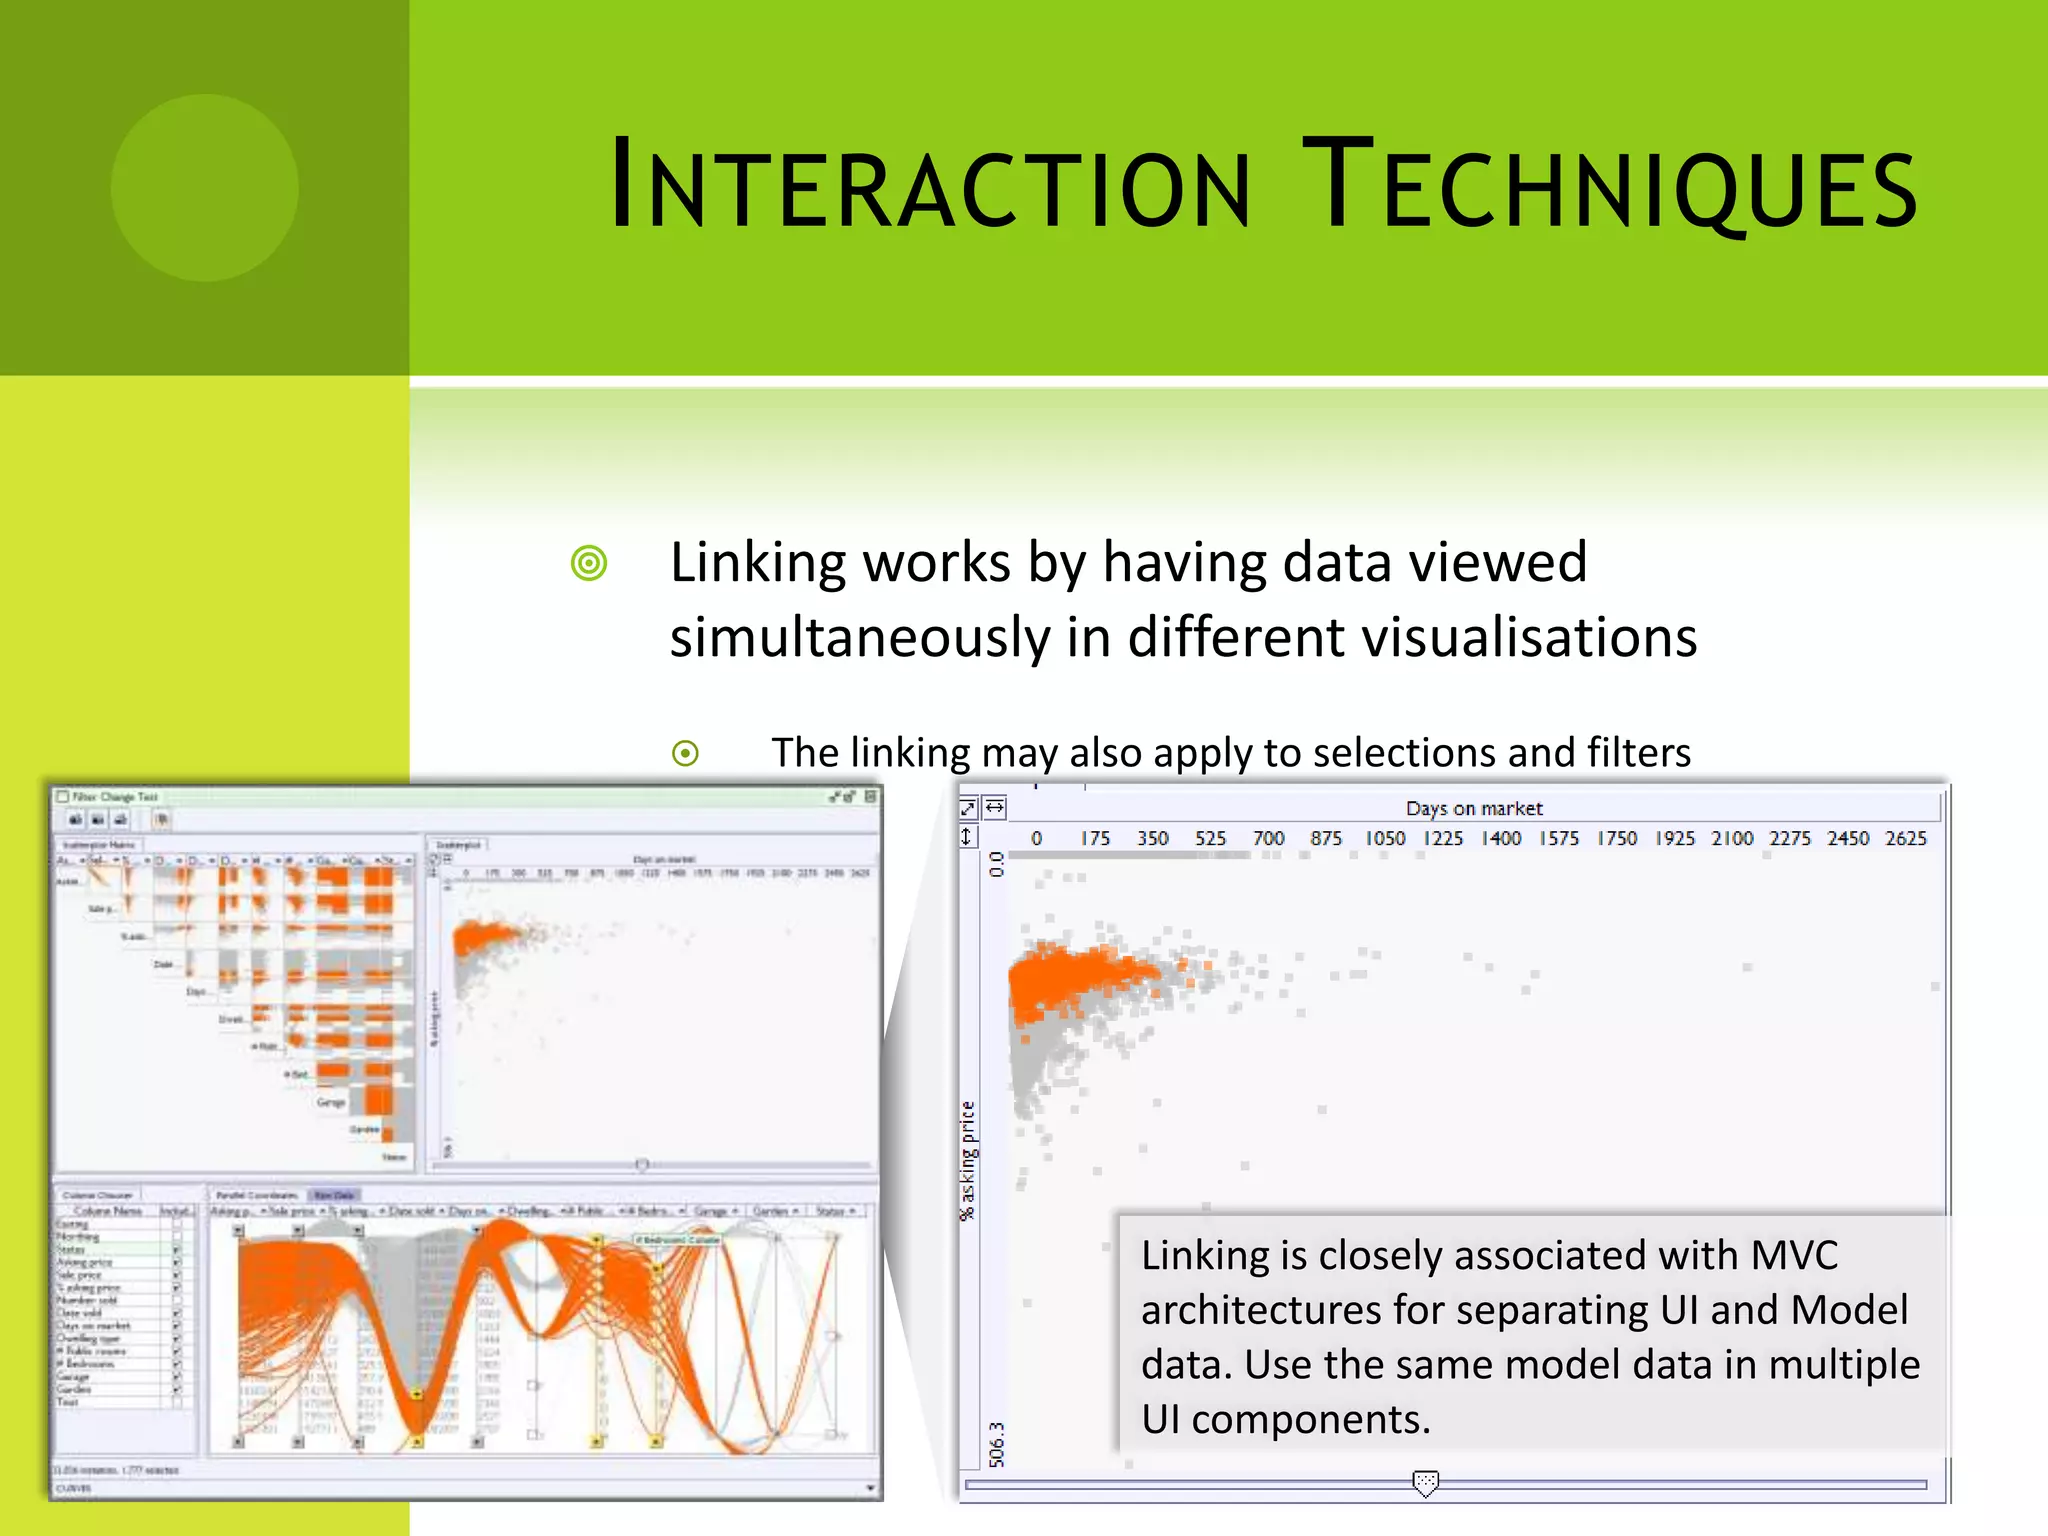
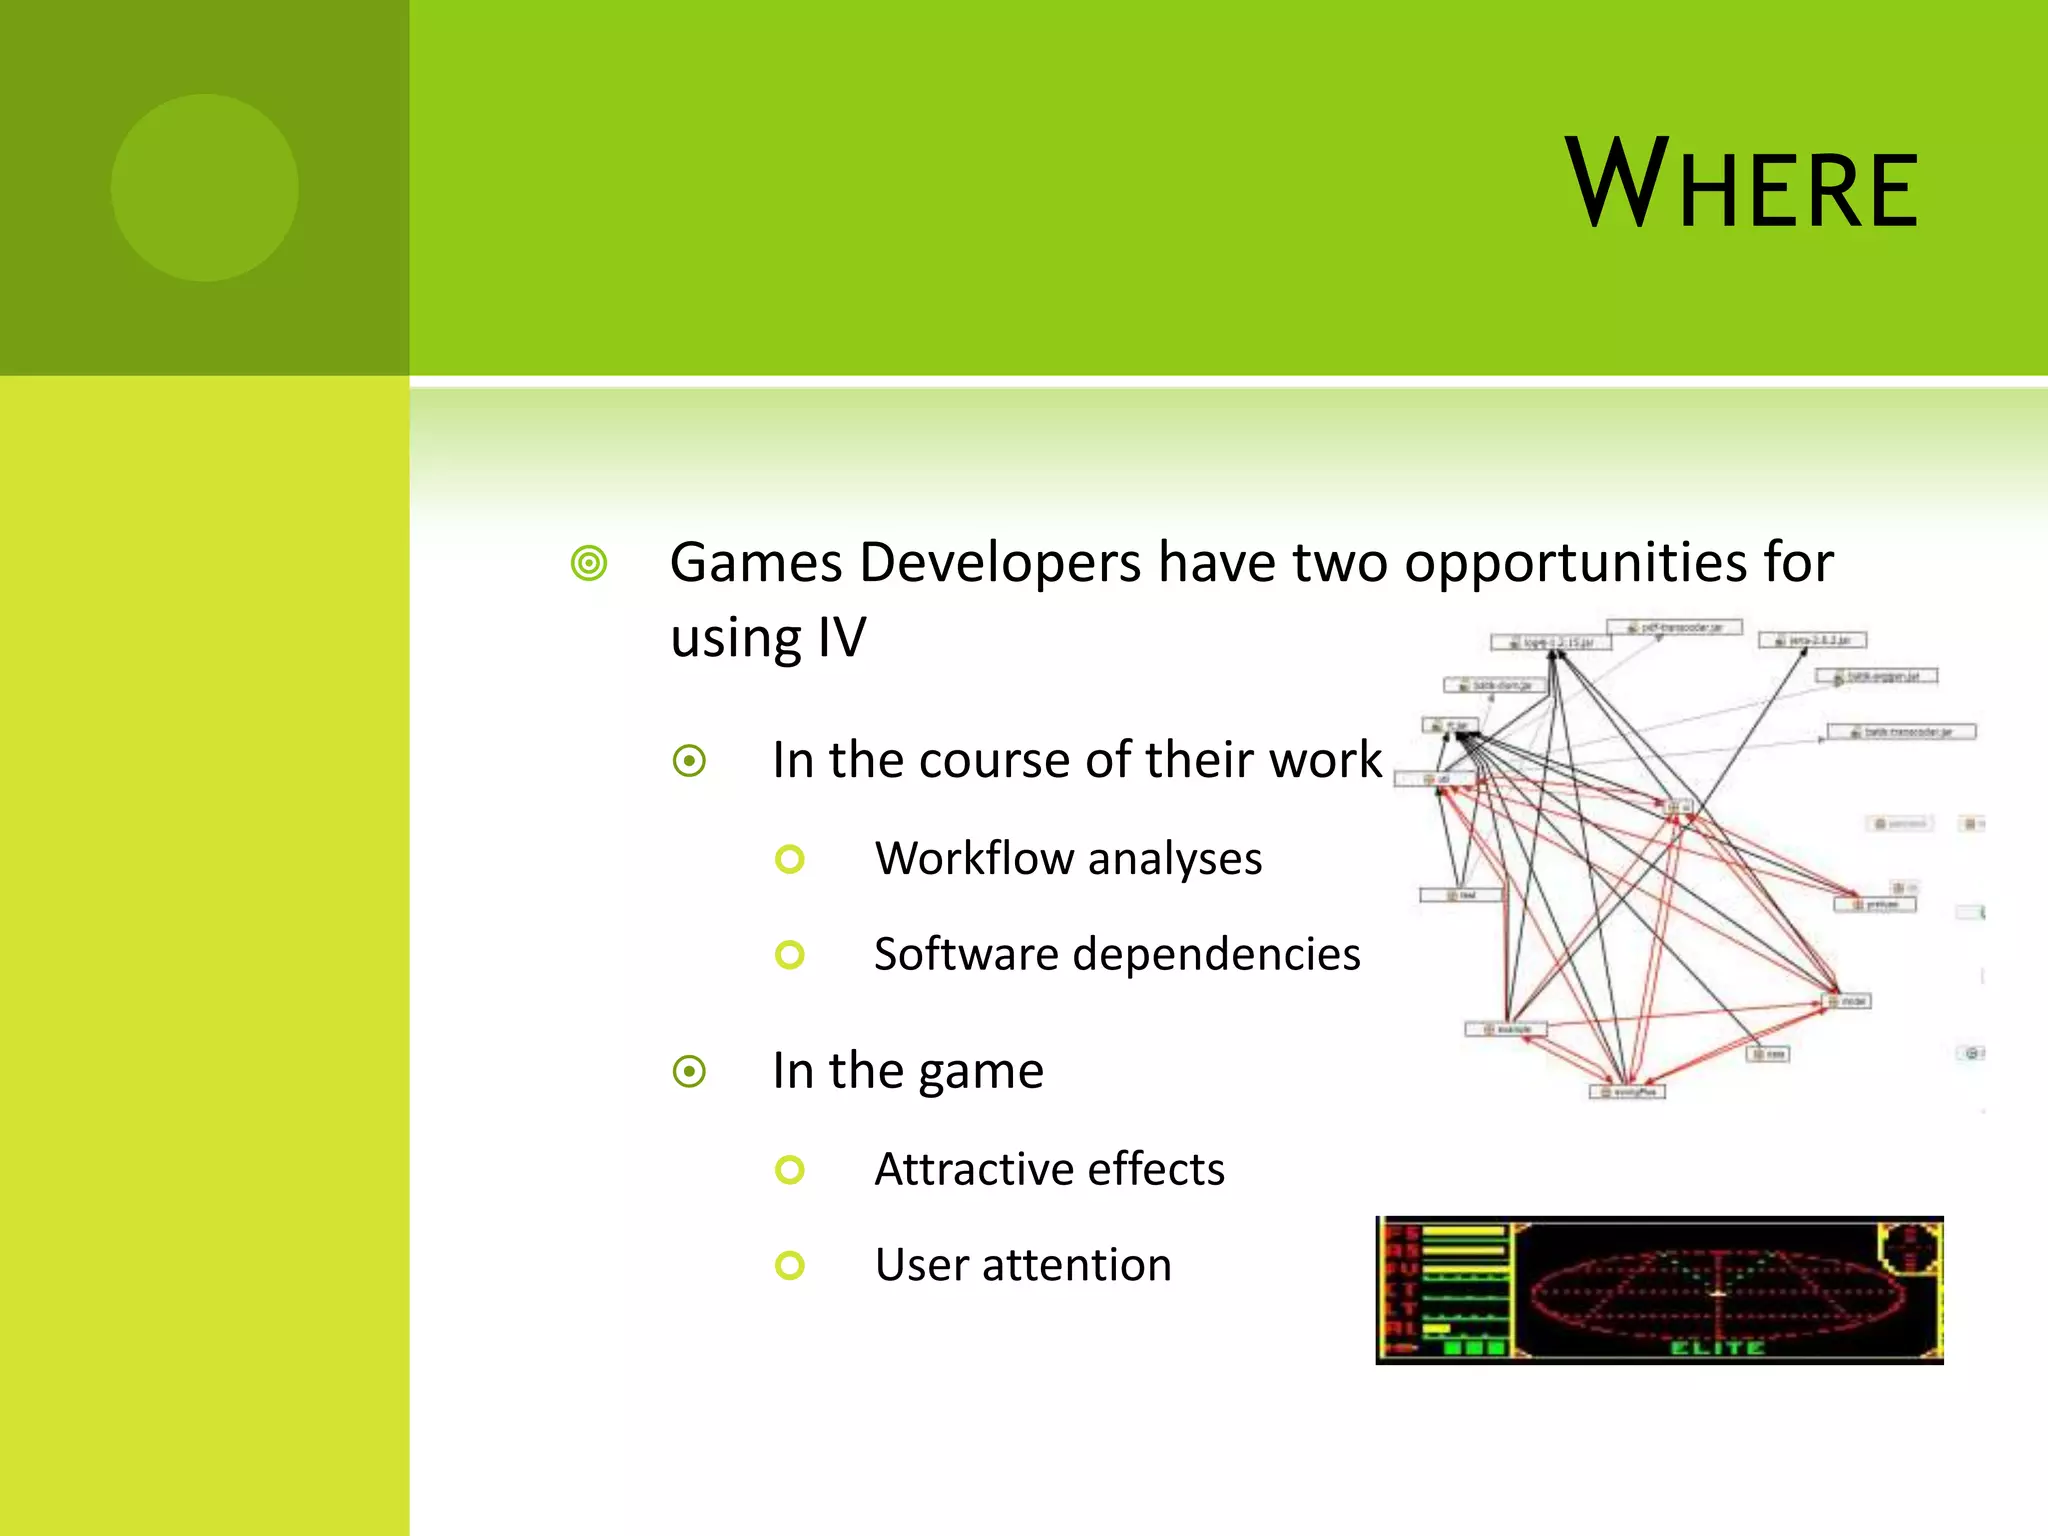
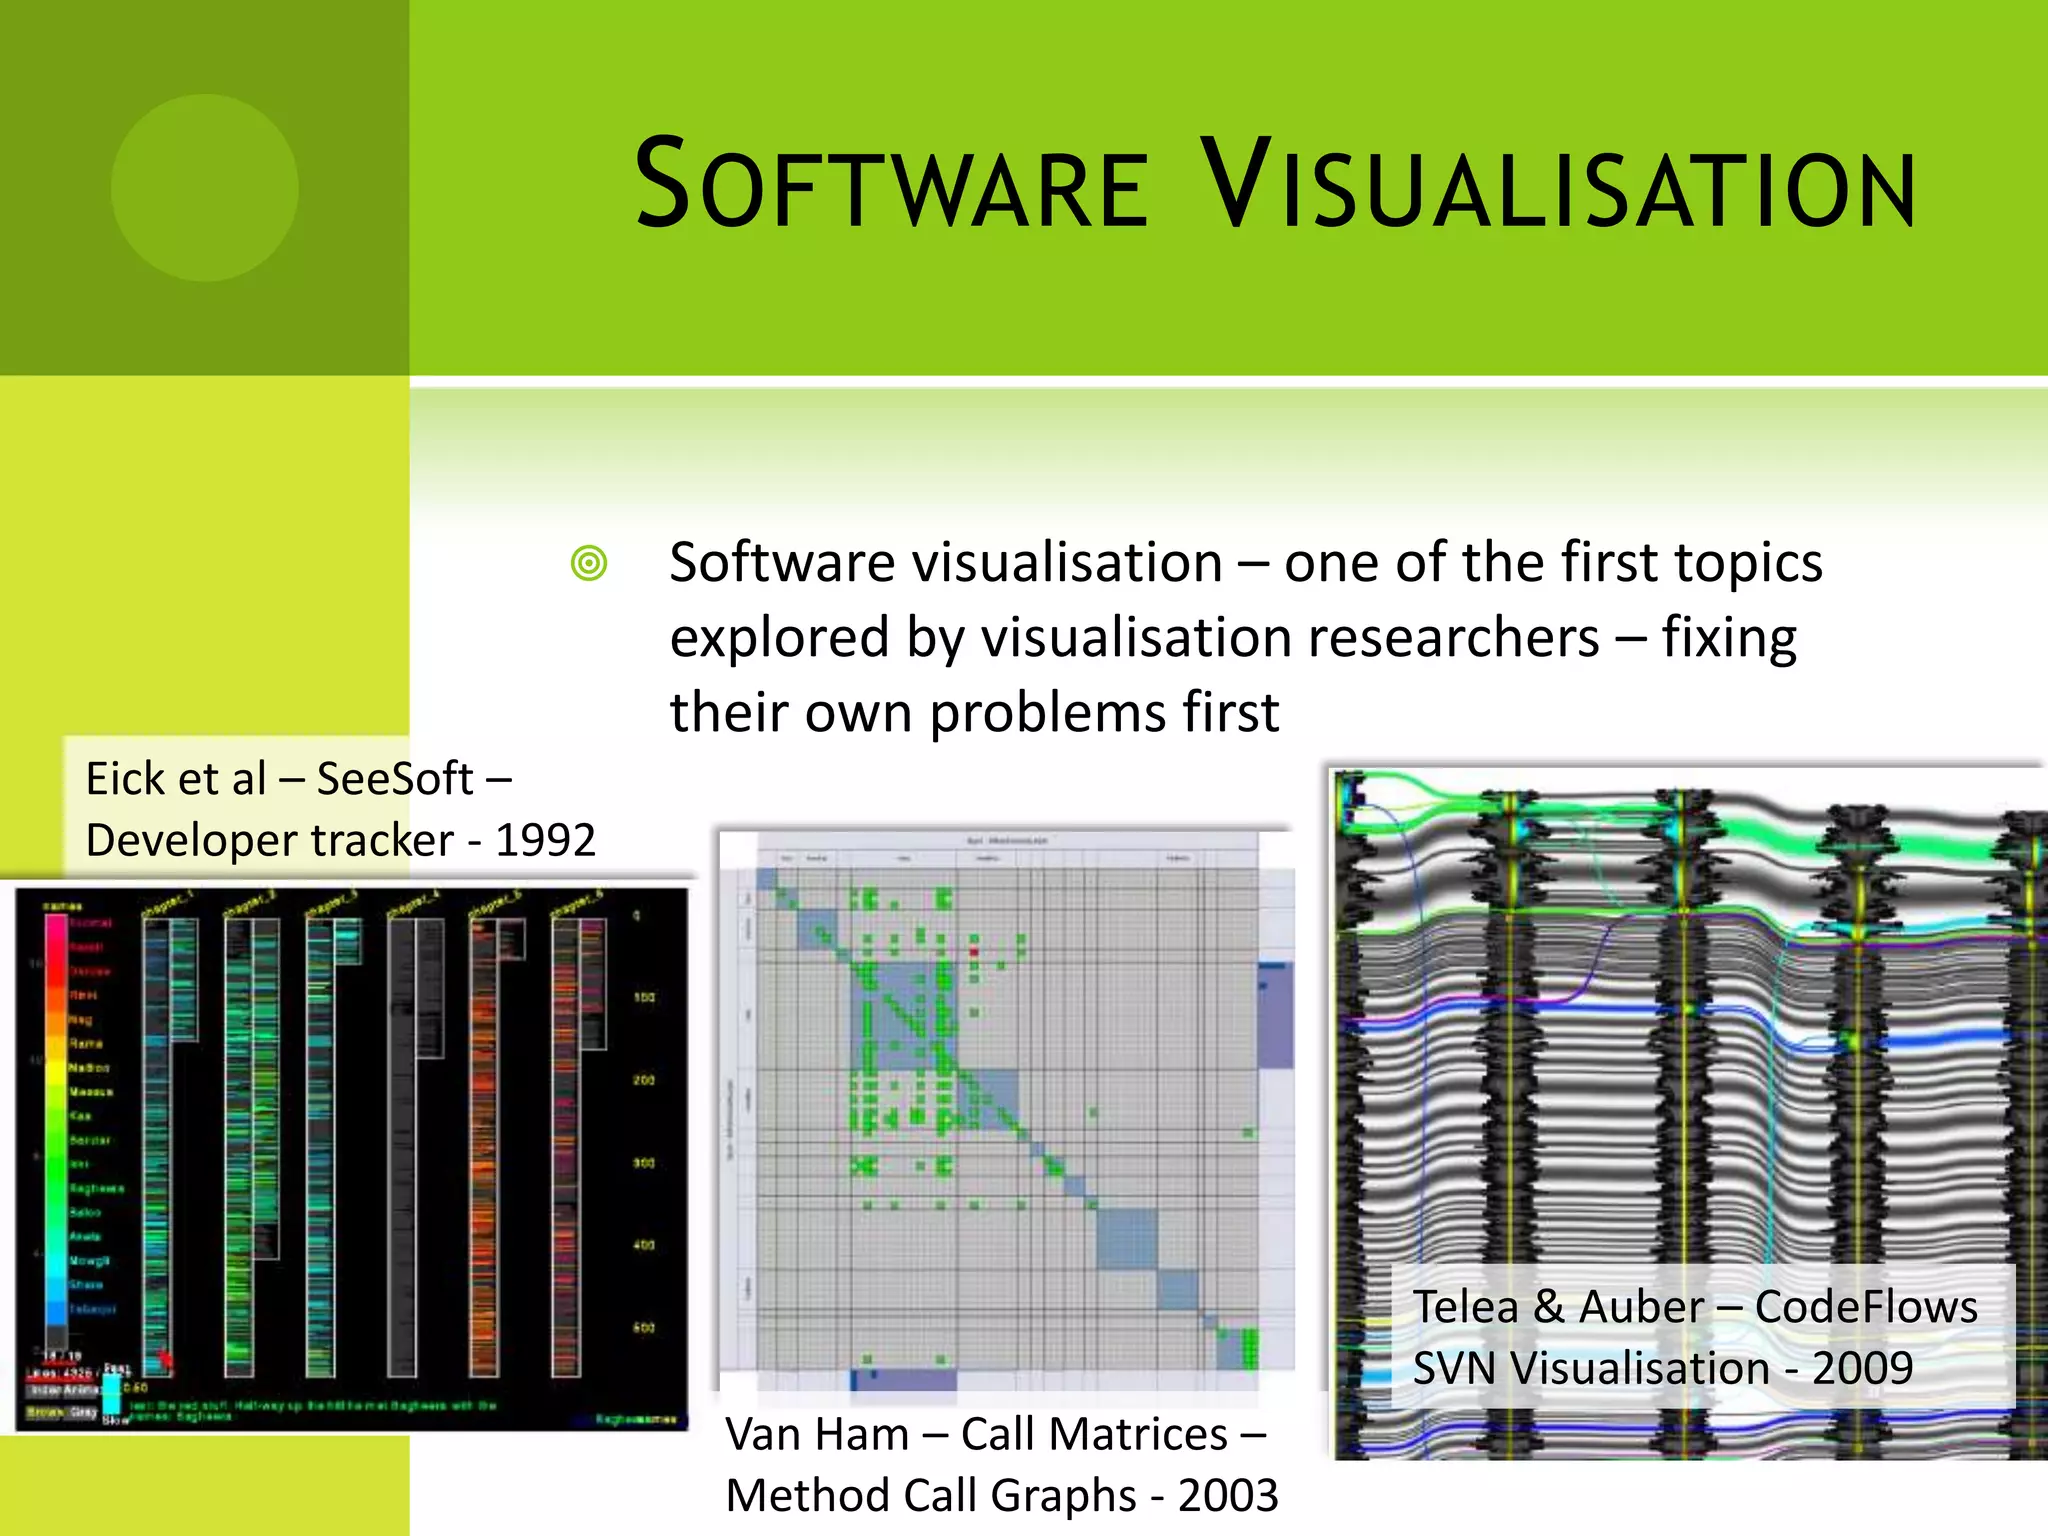
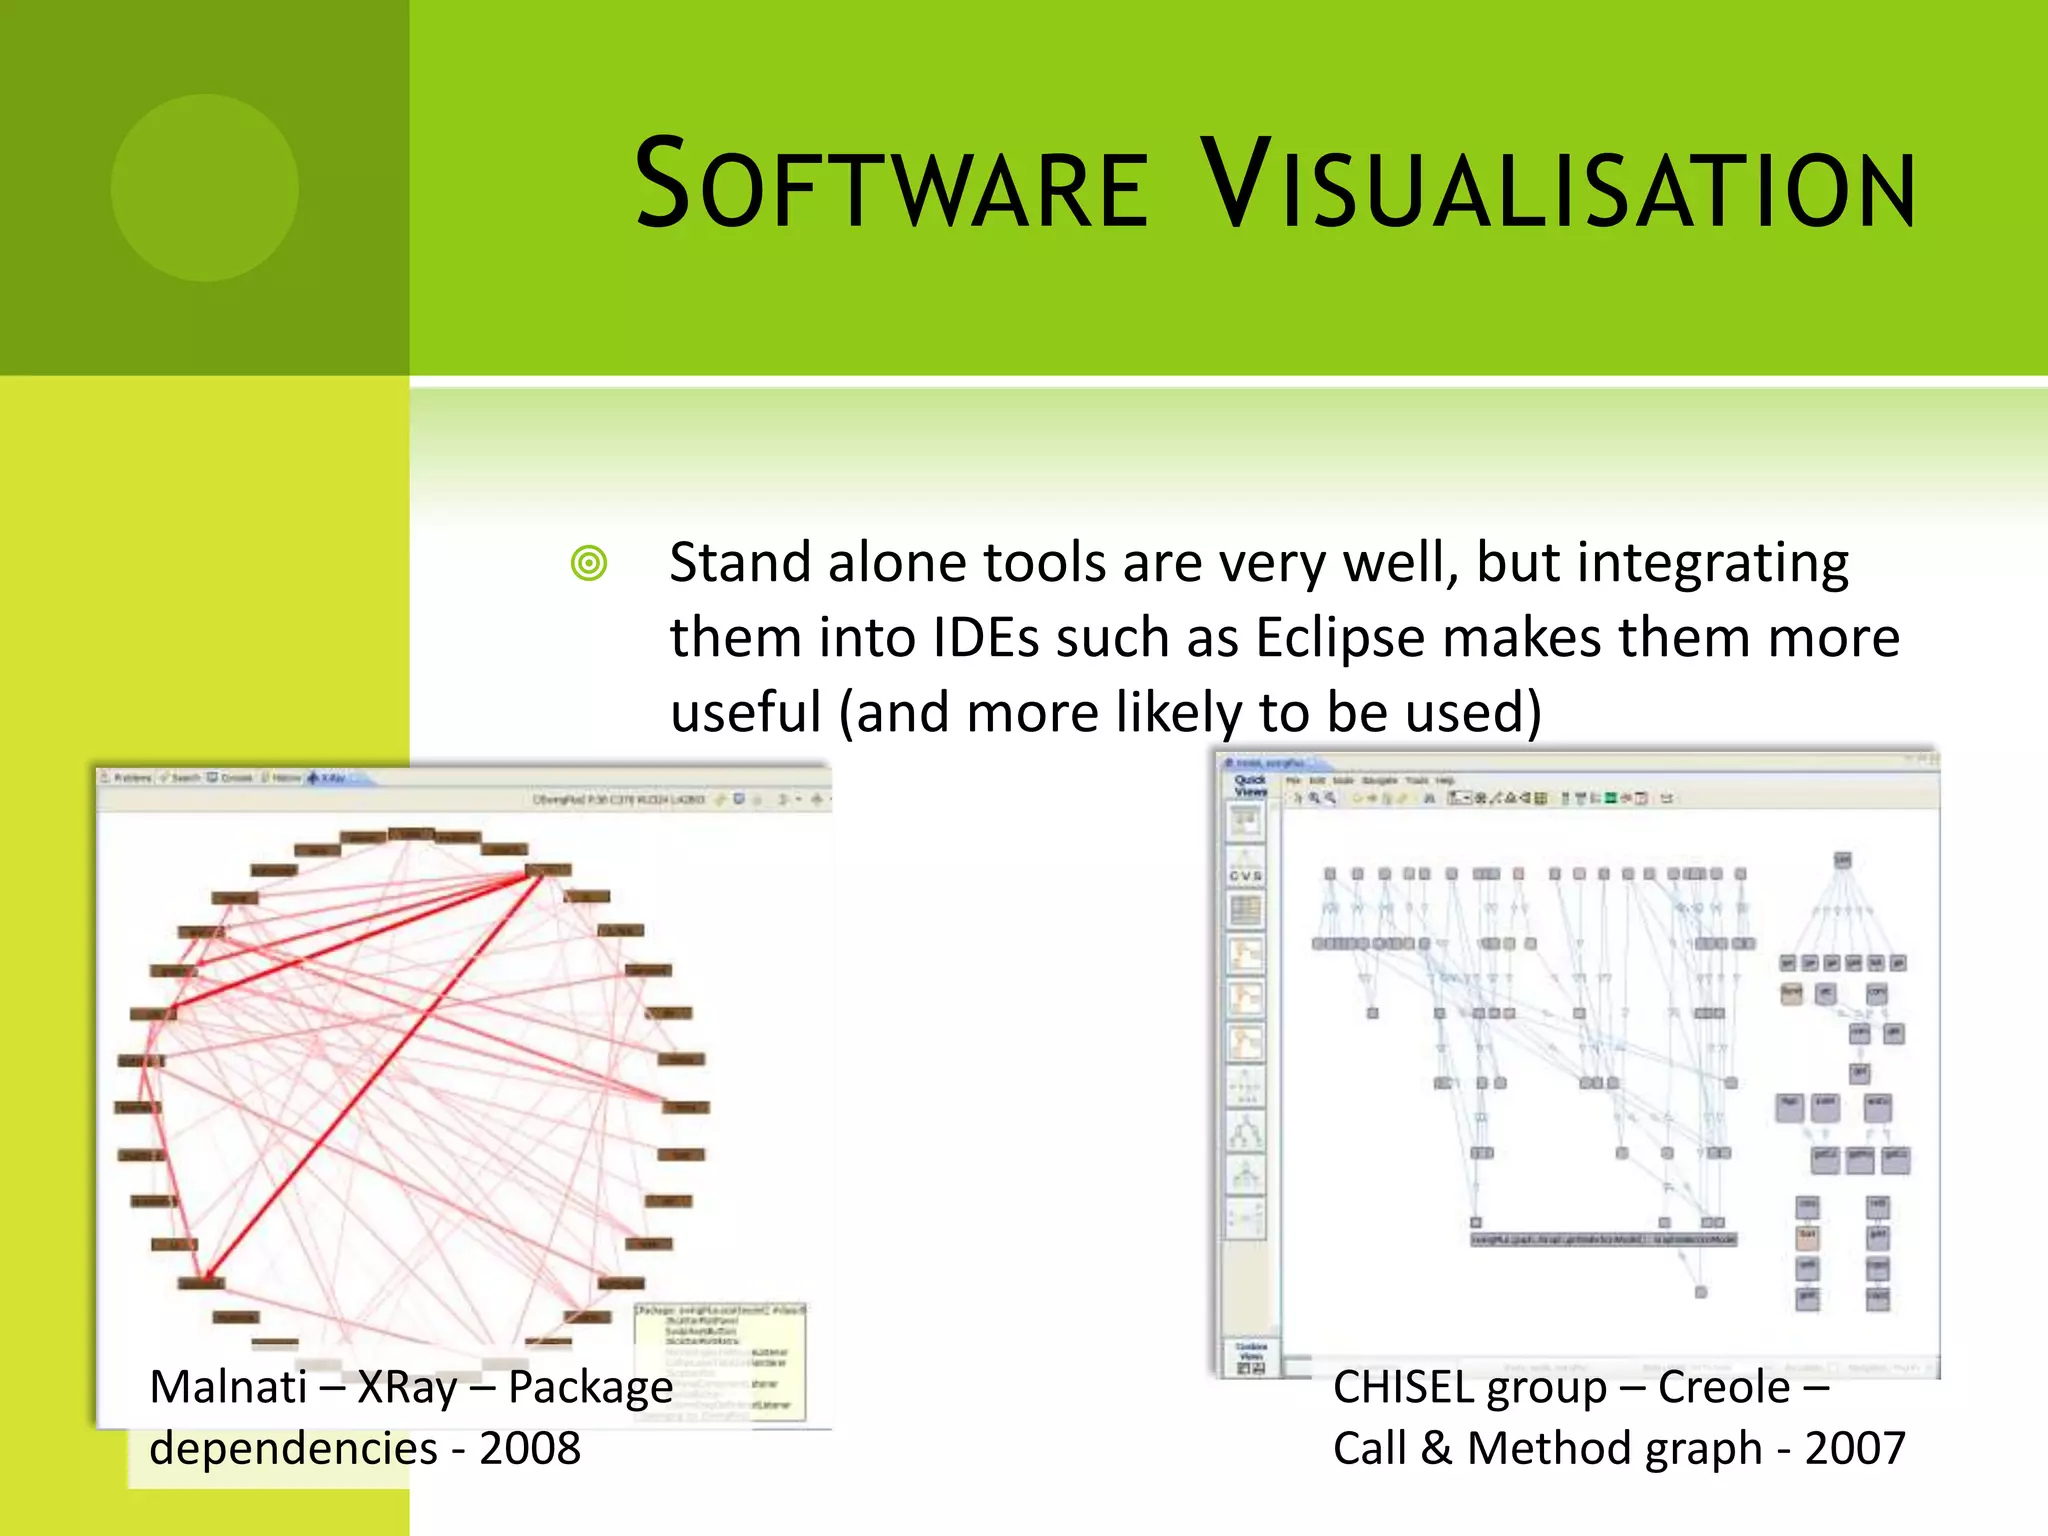
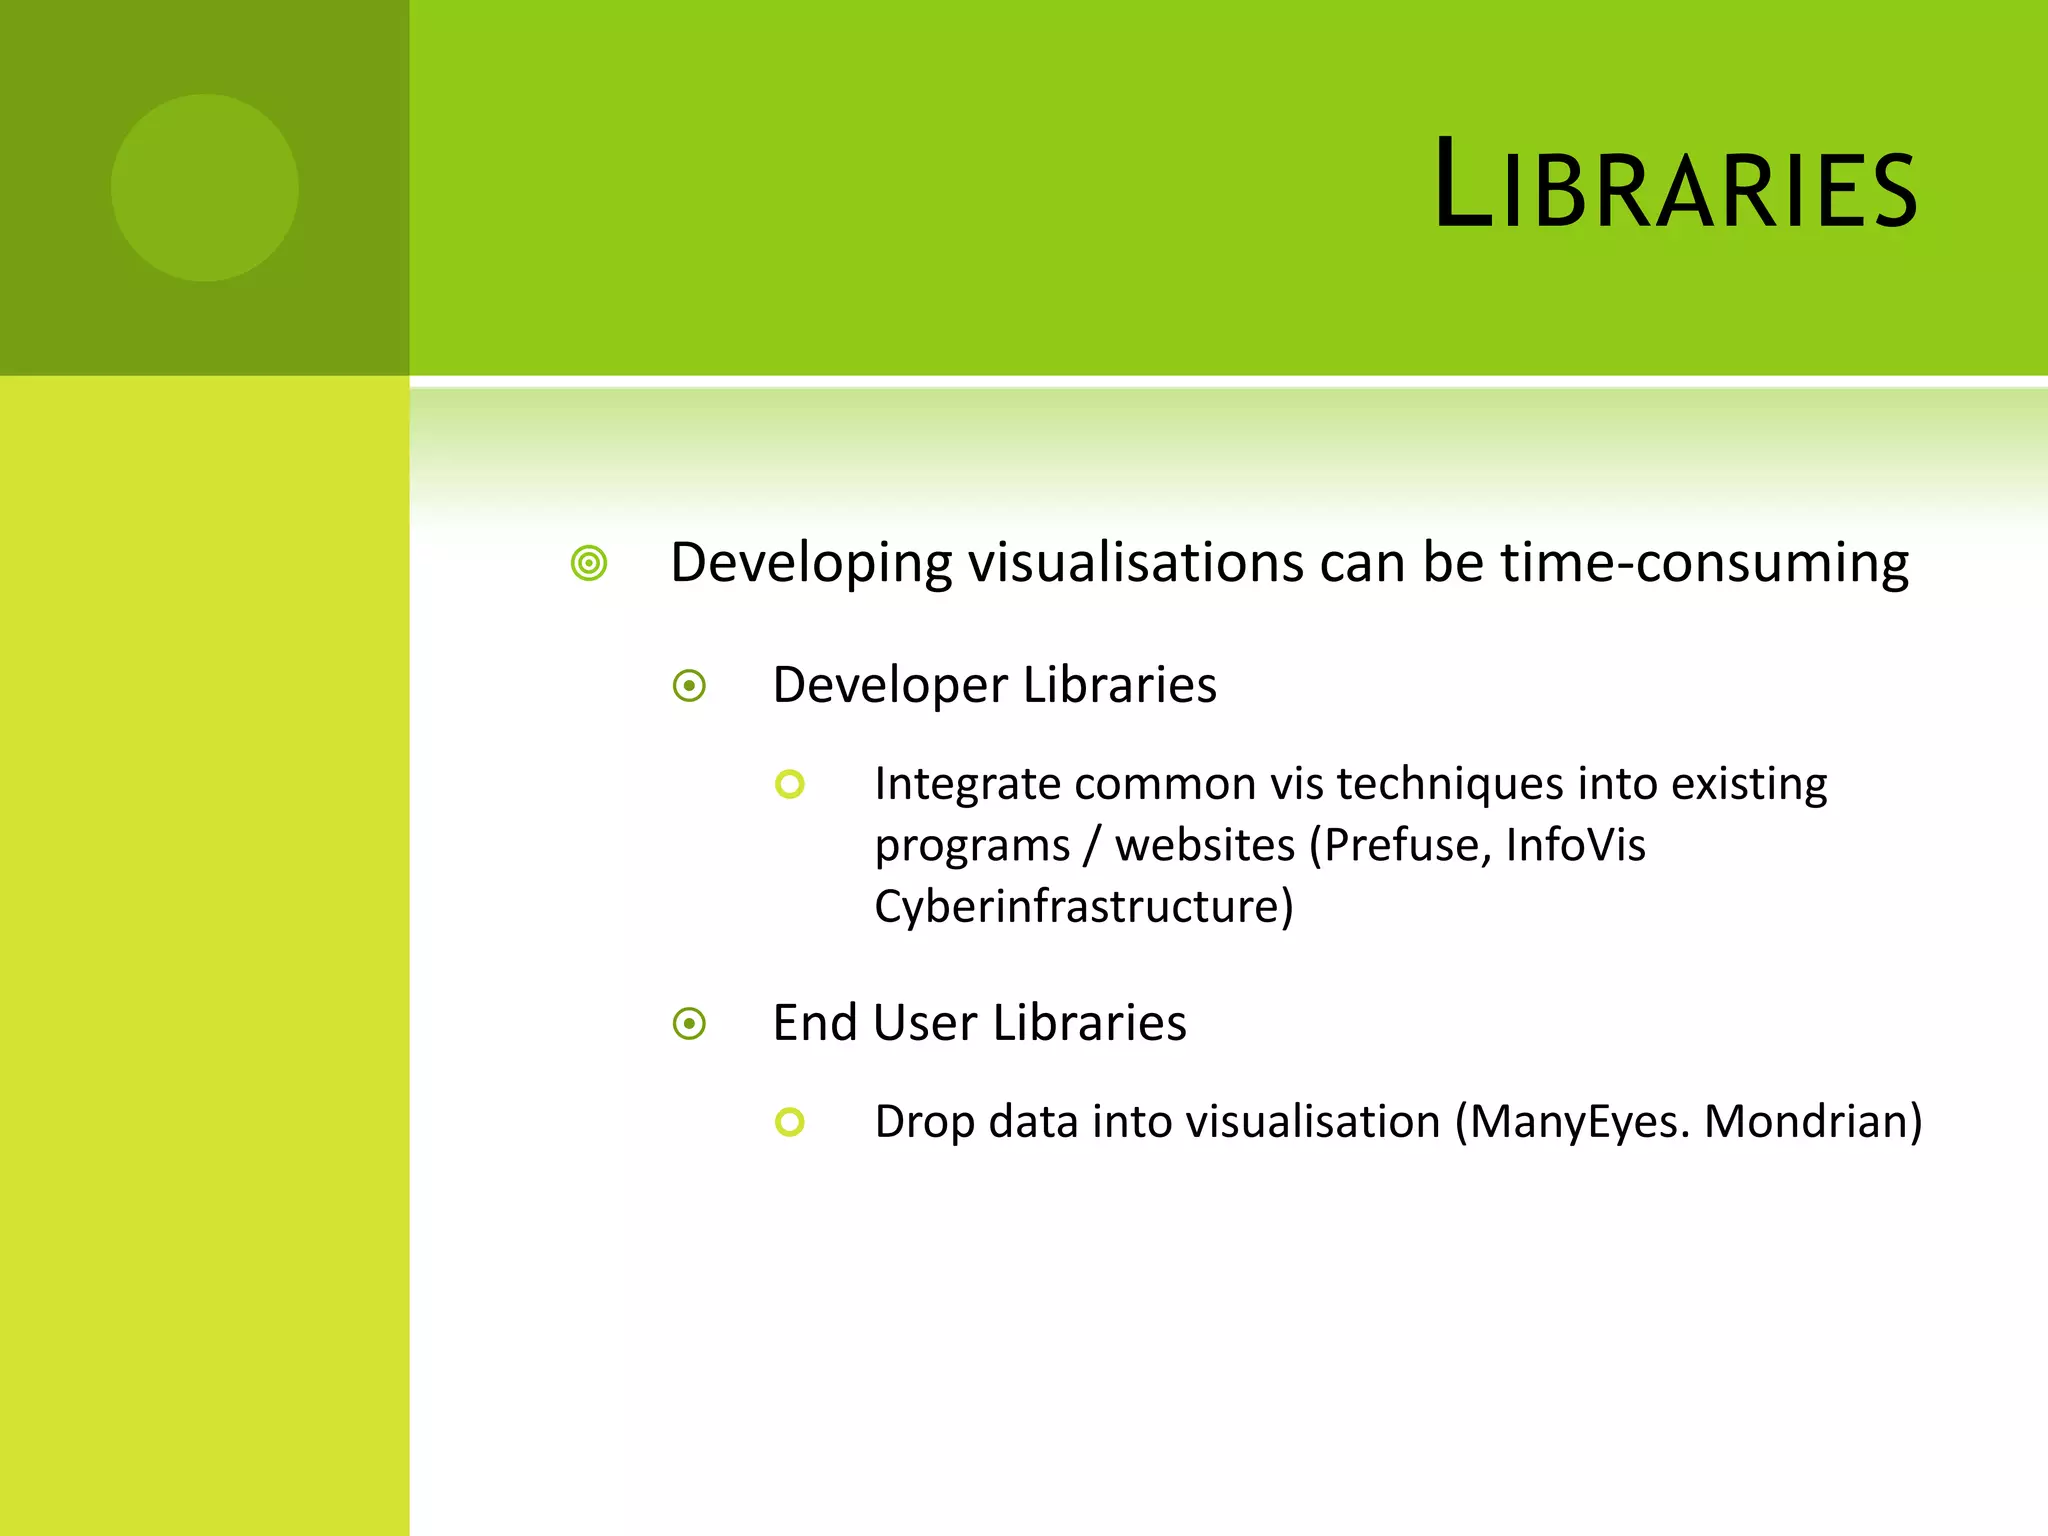
This document discusses information visualization (IV), which involves visually encoding abstract data to allow for visual pattern detection. IV takes advantage of the human visual system and can be used alongside statistical analysis. Common IV techniques include filtering, linking, and focusing data in interactive visualizations. IV has applications in domains like software visualization, where it can help analyze workflows, dependencies, and performance. Libraries exist to help developers integrate IV into their own work and provide end-users with pre-built visualization tools.