Downloaded 2,197 times


![Commentary
The President’s Conference 2005: ‘‘Technology in Imaging
and Radiotherapy – towards improved workflow and
productivity’’
P P DENDY
Gu¨nter Dombrowe, the President of the British Institute
of Radiology (BIR), introduced the theme of this year’s
Conference, and explained its dual purpose – to highlight
the contributions of medical and information technologies
towards improving clinical practice, patient outcome and
health economics; and to pay tribute to the pioneering
work of Sir Godfrey Hounsfield, the inventor of CT
scanning, perhaps the key technology of the digital
imaging age.
This Commentary provides an overview of some of
the important topics discussed at the Conference.
Some of the key presentations are also included in this
issue.
Elizabeth Beckmann reminded the audience of the early
days of CT – the excitement generated by the images of the
brain shown at the 32nd Congress of the BIR on 20 April
1972, the delightfully understated title of Sir Godfrey’s
lecture – ‘‘Computerised axial tomography, a new means
of demonstrating some of the soft tissue structures of the
brain without the use of contrast media’’, and the
subsequent publications in the BJR [1, 2]. The enduring
memory of this and other early developments is that so
much was achieved with so little money. Was Sir Godfrey
one of the last brilliant, intuitive, string and sealing wax
physics brigade?
The first of the two nominated Hounsfield lecturers,
Willi Kalender gave a comprehensive review of the past,
present and future of CT from a physics and technology
standpoint. He pointed out that there had been three
distinct phases of development: (1) the 1970s had been a
time of rapid development with second, third and fourth
generation scanners; (2) the 1980s had been a period of
stagnation with the competing development of MRI (the
late 1980s was the only time during a 30 year period when
there was no increase in the number of CT scanners in
Germany); (3) the 1990s were the renaissance years,
particularly with the introduction of spiral CT and
multidetector arrays.
Scan times are now typically 0.3 s to 0.5 s per full 360˚
scan and 10–30 s for the whole body. The first figure is
important for temporal resolution, especially in cardiac
applications, and one of the limitations on faster times is
the centrifugal force to which sensitive components such as
the X-ray tube are subjected [3]. To achieve better
temporal resolution increased electronic control of the
beam and possibly multiple tube designs are being
explored.
Improvements in total scan time will be achieved
through further development of wider detector arrays,
possibly towards flat panel detectors. This will in turn
require X-ray tubes with an even higher peak output, as
the total flux of photons required to image a given volume
remains roughly the same.
Like for like, patient doses have been reduced with tube
current modulation both on rotation from anteroposterior
(AP) to lateral projections and as the beam traverses the
body from high to low attenuating regions. Achieving
the same counting statistics on all data is a worthwhile
goal [4, 5].
Since 1990 the emphasis has been on scanning volumes
rather than slices and one of the landmarks has been to
achieve isotropically uniform spatial resolution, typically
in the range 0.4–0.6 mm [6]. It is important to recall that
for isotropic resolution, radiation dose to the patient
increases with the fourth power of the resolution element.
These improvements must also be seen in the context of
global use of radiology. CT is a relatively high dose
technique, now accounting for 25% of all radiation
exposure, and there must be strong clinical justification
for its use, and in particular serial, repeat whole body
scans.
The future for CT is hidden from view but there are
many possibilities and it is worthwhile to summarize
Kalender’s predictions – more detector rows; shorter
effective scan times; higher resolutions and more tissue
parameters (there is renewed interest in superimposing, e.g.
a calcium density map on a real density map obtained by
dual energy CT [7]); lower doses (of course!).
The second nominated Hounsfield lecturer, Adrian
Dixon, reviewed the clinical advances in CT. Two
important issues in particular were addressed:
(1) Do the ‘‘advances’’ in CT technology make any
difference to the patient?
(2) Many cutting-edge CT investigations are still chari-
tably funded and if the NHS is to become
responsible for their provision, they must be shown
to be cost-effective.
As a specific example of the clinical issues, he considered
the impact of multidetector CT on abdominal problems.
The improved anatomical resolution of modern helical CT
scanners enables the diagnosis of acute appendicitis or the
cause of small bowel obstruction to be made with a high
degree of accuracy [8]. Consequent on its multitasking
The British Journal of Radiology, 79 (2006), 1–4 E 2006 The British Institute of Radiology
DOI: 10.1259/bjr/19232533
1The British Journal of Radiology, January 2006](https://image.slidesharecdn.com/026britishjournalofradiology-britishinstituteofradiology-2006-130913065550-phpapp02/75/British-Journal-of-Radiology-British-Institute-of-Radiology-2006-eng-5-2048.jpg)
![abilities, CT is increasingly being used as a means of
triaging patients and facilitating early discharge for those
without serious disease – with obvious benefits to the
patients and cost savings to the NHS [9].
CT has become so good that in many areas of radiology
the real questions are now (a) is there a role for plain film
radiography? (b) when should ultrasound be used? (c) is
there a role for MR other than to avoid the use of ionizing
radiation?
This success has come at a price: clinicians are tending
to request a CT scan without fully examining the patient;
surgeons are reluctant to operate without high quality
imaging; for outpatients in oncology the number of
requests for CT staging is starting to approximate the
number of visits to hospital. However, Dixon was able to
conclude on a positive note. For the patient CT has
replaced some very unpleasant investigations.
The tribute to Hounsfield concluded with a more
specialized lecture from Albert de Roos on cardiac CT.
Roos summarized the technical considerations for multi-
slice CT in cardiac scanning – low contrast detection,
spatial resolution at high contrast, temporal resolution,
scan time and patient dose. The choice of acquisition
variables and reconstruction characteristics is very depen-
dent on the clinical problem under investigation.
De Roos then reviewed a wide range of applications
including: the quantitative assessment of coronary artery
calcification [10, 11]; the assessment of coronary artery
morphology; stent and graft patency; the selection of
patients for invasive therapy; assessment of the anatomy of
pulmonary veins and the investigation of acute chest pain.
In the last of these applications there is now a one-stage
protocol, i.e. the nirvana of the ‘‘one stop shop’’ to
diagnose accurately both cardiac and non-cardiac causes
of chest pain [12].
The Mackenzie Davidson lecture, delivered by Nicola
Strickland, touched on many aspects of modern imaging
but concentrated on information technology, especially
PACS.
PACS has now become a mature technology, especially
as a result of the DICOM standard and network
protocols. It clearly has the potential to improve workflow
and productivity but does not, in itself, solve departmental
inefficiencies and may highlight them. It is not a ‘‘quick
fix’’ and must be an integral part of workflow engineering.
Looking to the future, speech recognition and web
browsers will be developed further. The electronic patient
record remains a major challenge, since the facilities
provided need to match the service being provided. A
good example is home reporting – a full work load
requires a full diagnostic service, emergency reporting
needs only more limited facilities.
Strickland concluded that technology provides the
means for improving workflow and productivity – the
challenge is to optimize the use of technology to maximize
productivity in a clinically efficient way.
Manufacturers’ views of the use and development of
technology were also presented. Hermanns Requardt from
Siemens Medical Solutions reminded us that, worldwide,
challenges to healthcare systems are dominated by two
main topics – demographic factors and progress in
medicine. In diagnostic radiology, as in some other
branches of medicine, for example molecular/genetic
medicine, the challenge now is not a lack of information
but a flood of information. Drawing an analogy from
industry where knowledge management systems are
commonplace, Requardt predicted that information tech-
nology would bring about a paradigm shift in medicine if
it could facilitate the formation of a clinical knowledge
database and enable this to be used to complement the
data from the individual patient.
Jacques Souquet from Philips Medical Systems con-
sidered some other aspects of the impact of future
technology on medical imaging. Picking up a theme
from the previous speaker on progress in medicine, he
pointed out that knowledge doubling times have fallen
from about 8 years in 1970 to 1 year in 2001. Increased
use of computer-aided decisions is one way to improve
management of data, for example nodule identification in
a radiograph, using embedded medical knowledge to
reduce avoidable medical errors, genetic algorithms to
discover diagnostic patterns in huge data sets.
Souquet reminded us that much remains to be done.
There are still several diseases for which no diagnostic test
is available and the development of drugs to correct
specific genetic flaws that are biological causes of cancer
has a long way to go. In conclusion, he threw out two
challenges:
(1) How can the translation from cell to mouse to man be
speeded up?
(2) How can the multidisciplinary constituencies contri-
buting to progress (basic sciences, engineering, medi-
cine, industry) be coordinated? This is a challenge that
is close to one of the fundamental aims of the BIR.
Jane Guinn from Kodak Ltd concluded the session by
comparing the techniques of computed radiography (CR)
and digital radiography (DR) from the standpoint of
workflow patterns. She listed 16 distinct stages in the
production of a traditional analogue film, many
involving radiographer movement. CR removed only
two steps, DR removed nine. This had a big impact on
average examination time and in a busy general radio-
graphy room, on patient waiting time. Unfortunately DR
does not provide the flexibility of CR for several
examinations.
Peter Williams delivered the Silvanus Thomson
Memorial Lecture. With the somewhat enigmatic title
‘‘Things can only get better’’ he reviewed the development
of external beam radiotherapy treatment delivery, con-
centrating on current developments and future promises.
Early examples of ‘‘things getting better’’ included
megavoltage therapy with Co-60; isocentric mounting;
electrons as well as X-rays; anatomical data from the CT
scanner for treatment planning. For a few years the ability
to model tumours exceeded the ability to treat, which was
restricted to a cylinder.
In 1987 the multileaf collimator (MLC) became avail-
able for beam shaping and as with most really worthwhile
medical developments, there were no formal health quality
assessments or clinical trials.
MLCs led to intensity-modulated radiotherapy (IMRT),
essentially conformal therapy for difficult targets [13, 14],
and at the same time electronic portal imaging was being
developed to provide active control of beam direction
rather than a passive verification system.
Williams then discussed the current development of real
time tumour tracking to counteract patient movement by
P P Dendy
2 The British Journal of Radiology, January 2006](https://image.slidesharecdn.com/026britishjournalofradiology-britishinstituteofradiology-2006-130913065550-phpapp02/75/British-Journal-of-Radiology-British-Institute-of-Radiology-2006-eng-6-2048.jpg)
![mounting a diagnostic machine with fluoroscopic, radio-
graphic and CT capabilities onto the treatment linear
accelerator. Examples of improved set-up were shown for
lung and bladder treatments – image-guided radiotherapy
will certainly make things better!
For the future, although physicists and engineers are not
yet spent (vide the next topic of proton therapy), they will
need help from other disciplines, e.g. molecular biologists
and geneticists (biological targeting for anoxia and
metabolism, and selective targeting of tumour cells), and
from radiobiologists (for example to exploit the
information on bystander effects coming from microbeam
studies).
As a fitting sequel to the Silvanus Thomson Memorial
Lecture, Bleddyn Jones presented the case for particle
therapy, especially with protons. The theoretical advan-
tages of using the Bragg dose peak to improve the
therapeutic ratio have been known for many years.
Unfortunately, for a 60 MeV beam the peak is at only
3 cm depth and treatment is limited to quite superficial
tumours. Notwithstanding, over 1200 choroidal melano-
mas have been treated successfully at the Clatterbridge
Hospital.
Work by Lomax et al [15] has shown that for treatment
of the breast and regional nodes, a 9-field photon IMRT
approach can either produce similar dose homogeneity
across the planning treatment volumes to that of a proton
plan, or similar sparing of dose to both lungs and the
heart, but not both.
Jones estimated that 10–20% of patients might be better
treated by particle radiotherapy and believes that technical
improvements in physics, bioengineering and computing,
especially in robotics and particle delivery, now make
treatment with a 200 MeV beam, with Bragg peak depths
approaching 20 cm, a practical proposition. It is antici-
pated that this will lead to a big increase in demand for
particle therapy in the UK [16].
The Conference concluded with two further papers in
diagnostic imaging. Catherine Owens gave a wide-ranging
review of the changing practice of paediatric imaging. The
diagnostic capability and accuracy of multidetector CT
(MDCT) angiography was compared with echocardio-
graphy, cardiac catheterization and surgery in the assess-
ment of the great vessels in 40 consecutive patients (mean
age 5 years) with congenital heart disease. MDCT was
accurate, showing good agreement with interventional
catheter and surgery and provided additional information.
Effective doses of radiation were low – ranging from
0.97 mSv in neonates to 1.7 mSv in adolescents [17].
Magnetic resonance coronary angiography and late-
enhancement imaging have been shown to be feasible in
children who had undergone arterial switch for transposi-
tion of the great arteries. Diagnostic quality images were
acquired in 72% of the coronary arteries imaged and this
rose to 100% in subjects over 10 years old [18].
Finally, Peter Ell discussed the contribution of PET/CT
to improved patient management. Whilst acknowledging
the important contribution in neurology and cardiology, in
the limited time available and in the context of the
Conference, Ell concentrated on oncology. Four distinct
areas were covered, diagnosis, staging, radiotherapy
planning and treatment monitoring.
Two very different challenges for this wonderful
technique were highlighted. At the cutting edge of research
there are almost unlimited opportunities for PET/CT to be
used to assess the biology of individual response to
treatment [19]. Whilst recognizing the importance of F-18
fluorodeoxyglucose in oncology, Ell emphasised the need
to look at a wide range of other novel markers that are
being developed, aimed at imaging proliferation [20, 21],
hypoxia, angiogenesis, apoptosis, etc.
At the other extreme there is the huge problem of
diffusion of technology in a cost-effective way so that, on a
day-to-day basis, many more of the millions of cancer
sufferers can benefit from the power of multimodality
imaging.
Ell’s concluding remarks were:
N PET/CT has changed patient management;
N It is best at assessing extent and severity of cancer;
N It informs radiotherapy planning; and
N It combines the power of CT with the unique
metabolic mapping obtained with PET.
These remarks were, of course, addressed to PET/CT
but, in many respects, with suitable changes of wording,
could be applied to the impact of other technological
advances discussed during the 2005 President’s
Conference. We commend to you the full articles
contributed by the speakers in this issue of the Journal.
Acknowledgments
I am grateful to Fergus Gleeson and Gu¨nter Dombrowe
for helpful contributions to this Commentary.
References
1. Hounsfield GN. Computerised transverse axial scanning
(tomography). Part 1 description of system. Br J Radiol
1973;46:1016–22.
2. Ambrose J. Computerised transverse axial scanning (tomo-
graphy). Part 2 clinical application. Br J Radiol
1973;46:1023–47.
3. Shardt P, Deuringer J, Freudenberger J, Hall E, Knipfer W,
Mattern D, et al. New X-ray tube performance in computed
tomography by introducing the rotating envelope tube
technology. Med Phys 2004;31:2699–706.
4. Kalender WA, Wolf H, Seuss C. Dose reduction in CT by an
anatomically adapted tube current modulation. Med Phys
1999;26:2248–53.
5. Greess HR, Wolf H, Suess C, Lutze J, Kalender WA, Bautz
WA. Automatic exposure control to reduce dose in subsecond
multislice spiral CT – Phantom measurements and clinical
results. Radiology 2002;225 Suppl. RSNA programme p 593.
6. Kalender WA. Thin-section three dimensional spiral CT. Is
isotropic imaging possible? Radiology 1995;197:578–80.
7. Kalender WA, Klotz E, Suess C. Vertebral bone mineral
analysis: an integrated approach with CT. Radiology
1987;164:419–23.
8. See TC, Ng CS, Watson CJE, Dixon AK. Appendicitis:
spectrum of appearances in helical CT. Br J Radiol
2002;75:775–81.
9. Ng CS, Watson CJE, Palmer CR, See RC, Beharry NA,
Housden BA, et al. Evaluation of early abdominopelvic
computed tomography in patients with acute abdominal pain
of unknown cause – prospective randomised study. BMJ
2002;325:1387–9.
10. Girshman J, Wolff SD. Techniques for quantifying coronary
artery calcification. Semin Ultrasound CT MR 2003;24:33–8.
Commentary: President’s conference 2005
3The British Journal of Radiology, January 2006](https://image.slidesharecdn.com/026britishjournalofradiology-britishinstituteofradiology-2006-130913065550-phpapp02/75/British-Journal-of-Radiology-British-Institute-of-Radiology-2006-eng-7-2048.jpg)

![President’s conference paper
CT scanning the early days
E C BECKMANN, BSc(Eng)
Lanmark, Beaconsfield, Bucks, UK
Abstract. CT scanning has become an established diagnostic tool within the radiology department. This article
covers some of the history of the development and early days of CT scanning. It is based upon the lecture given
on the Memorial Day for Sir Godfrey Hounsfield during the British Institute of Radiology President’s
Conference 2005.
It is less than 34 years ago, on 20th April 1972, that an
unknown engineer from EMI Ltd, the company better
known at the time for publishing the Beatles records,
gave a presentation at the 32nd Congress of the British
Institute of Radiology. The Engineer, Godfrey Hounsfield,
was lecturing with Dr James Ambrose from Atkinson
Morley’s Hospital on ‘‘Computerised Axial Tomography
(A new means of demonstrating some of the soft tissue
structures of the brain without the use of contrast media)’’
[1, 2]. Many people attending that BIR congress will never
forget the experience of hearing a presentation on CT
scanning for the first time. In fact Hounsfield had
presented the results of some of his animal experiments
the previous year at the 2nd congress of the European
Association of Radiology, in Amsterdam, but they had not
excited much interest. The same might have happened in
the USA because at a Neuro Postgraduate Course at the
Albert Einstein College of Medicine, New York, on
Monday 15th May 1972, only about a dozen people
stayed to hear an extra lunchtime lecture by Hounsfield
and Dr Bull, where they showed the first clinical images.
However these people realised the significance of what they
had seen and the news spread rapidly.
The beginning
In the mid 1960s Hounsfield was working on the pattern
recognition of letters when he began to consider whether
he could reconstruct a three-dimensional representation of
the contents of a box from a set of readings taken through
the box at randomly selected directions. He found that by
considering the three-dimensional object within the box as
a series of slices, reconstruction was easier than treating
the content as a volume.
He tested the theoretical principal by working with a matrix
of numbers set to zero with a square in the middle where each
number was set at 1000. He entered these data into a com-
puter programme to get simulated absorption values and
then reconstructed the picture using another programme.
Hounsfield recalled his surprise at how accurate the result was.
The project proposal
Once Hounsfield had proved the theoretical principle he
went on to generate the original project proposal in 1968.
Here he stated ‘‘The purpose of the study was to investigate
the employment of a computer to make better use of the
information obtained when an object is examined by gamma
rays or X-rays’’. In this proposal Hounsfield compared the
classic conventional X-ray technique producing a confused
and fuzzy picture to the clear outline produced by the
proposed system. Hounsfield proposed a system as shown in
Figure 1 based upon reconstructing pictures of slices through
an object and in detailing the expected benefits he indicated a
theoretical accuracy of detection better than 1%.
The lathe bed model
The initial test rig was built on the bed of an old lathe which
Hounsfield had been using in a previous project working on
computer stores. Hence the early test unit became referred to
as the ‘‘Lathe bed model’’. The initial rig utilized a gamma
source, Americium 95, with a photon counter as the detector.
On this rig, the source made 160 traverses of the object, which
was rotated 1˚at the end of each traverse for a total of 180˚. It
took 9 days to collect sufficient information, and 2.5 h to
reconstruct the image on an ICL 1905 mainframe computer.
However, the resultant images proved the feasibility of the
technique and with the replacement of the gamma source by
an X-ray source as shown in Figure 2, the scanning time was
reduced to 9 h.
Initial images were of inert objects, then specimens from an
abattoir, including bullocks brains and pigs bodies as shown
in Figure 3. Due to the long scan times, particularly with the
gamma source, many of these specimens decayed while the
Received 12 September 2005 and accepted 16 September 2005. Figure 1. Extract of the original 1968 project proposal.
The British Journal of Radiology, 79 (2006), 5–8 E 2006 The British Institute of Radiology
DOI: 10.1259/bjr/29444122
5The British Journal of Radiology, January 2006](https://image.slidesharecdn.com/026britishjournalofradiology-britishinstituteofradiology-2006-130913065550-phpapp02/75/British-Journal-of-Radiology-British-Institute-of-Radiology-2006-eng-9-2048.jpg)


![been introduced, to offer fast scan times, most based upon
xenon gas detectors arranged in an arc [3].
Hounsfield realised the need for a system that was faster
than translate/rotate and that could overcome the
calibration and artefact issues of rotate/rotate systems.
Topaz
The patent for a scanning focus system to produce a
true volume scanner was filed on 19th October 1976. The
Topaz research system, also named after a stone and
shown in Figure 7, was a 3rd generation system with a
flying X-ray spot. The X-ray flying spot scanned in a
direction opposite to the direction of rotation of the
machine which meant that the body could be scanned with
arcs of detector readings which overlapped in such a way
that they could be compared and continuously calibrated.
Built with 612 detectors including a central zoom region,
Topaz had a resolution in the x-y plane of 0.65 mm.
Volume scans taken in June 1980 were displayed in three
dimensions in real time as 1200612006270 pixels.
Recognition
Initially the scale for describing the attenuation
coefficients was referred to as EMI numbers. This was
then expanded by a factor of two and became known as
Hounsfield units (H) where
H~
ktissue{kwater
kwater
|1000
and m is the linear attenuation coefficient. Each Hounsfield
unit is equivalent to 0.1% of the attenuation of water [3].
In addition to giving his name to the unit of attenuation,
Hounsfield received many awards including the BJR
Barclay prize jointly with Ambrose in 1974, the Nobel Prize
for Physiology or Medicine in 1979 [4] and a Knighthood
in 1981.
Hounsfield and his team created the CT scanner,
which has had an explosive impact on diagnostic
radiology, with little money and few resources. By the
end of the 1970s they already had plans for many of the
technologies which were to develop the CT scanner over
the next 30 years, including helical multislice scanners and
high power continuously rated scanned beam X-ray tubes.
They developed many of the techniques which formed
the foundation of modern imaging including image
subtraction. By 1976 the reconstruction techniques used
in CT were already being applied to other areas including
ultrasound and nuclear magnetic resonance.
Acknowledgments
The author is indebted to many people especially those
members of the original EMI team who worked with Sir
Godfrey Hounsfield for their input to the original lecture
and material used in this article.
References
1. Hounsfield GN. Computerised transverse axial scanning
(tomography): Part 1. Description of system. Br J Radiol
1973;46:1016–22.
2. Ambrose J. Computerised transverse axial scanning (tomo-
graphy): Part 2. Clinical application. Br J Radiol
1973;46:1023–47.
3. Brooks RA, Di Chiro G. Principles of computer assisted
tomography (CAT) in radiographic and radioisotropic ima-
ging. Phys Med Biol 1976;21:689–732.
4. Computed medical imaging. Nobel lectures in physiology or
medicine 1971–1980; 568–86.
Figure 7. Topaz 3rd generation flying focal spot scanner.
Figure 6. Body scan of Hounsfield taken on the prototype
scanner in the laboratories and shown at Bermuda conference
on 14th March 1975.
E C Beckmann
8 The British Journal of Radiology, January 2006](https://image.slidesharecdn.com/026britishjournalofradiology-britishinstituteofradiology-2006-130913065550-phpapp02/75/British-Journal-of-Radiology-British-Institute-of-Radiology-2006-eng-12-2048.jpg)
![President’s conference paper
Cardiac applications of multislice computed tomography
1
A DE ROOS, MD, 1
L J M KROFT, MD, 2
J J BAX, MD, 1
H J LAMB, MD and 1
J GELEIJNS, PhD
Departments of 1
Radiology and 2
Cardiology, Leiden University Medical Center, Albinusdreef 2, 2333 ZA Leiden, The
Netherlands
Multislice CT (MSCT) is gaining clinical acceptance for
cardiac imaging owing to improved temporal and spatial
resolution of the latest 16-slice and 64-slice technology.
Although the cardiac MSCT applications are promising,
there is still room for further technical improvements and
optimization of post-processing techniques for cardiac
evaluation.
Interestingly, the data acquired for CT angiography of
the coronary arteries can also be used to create volumetric
cine loops of cardiac function. The functional data are
available without the need for repeat scanning or for
administration of additional contrast material [1].
Furthermore, MSCT allows assessment of first-pass
perfusion and delayed enhancement imaging in patients
with subacute myocardial infarction. Recently, it has been
reported that MSCT reveals microvascular obstruction or
the so-called no-reflow phenomenon as a late perfusion
defect in patients with re-perfused acute infarctions,
similar to observations made by other techniques like
MRI [2]. With further development MSCT may allow
combined assessment of the presence and extent of
coronary atherosclerosis, the percent diameter stenosis,
plaque characterization and the effect of the lesion on
perfusion and myocardial function.
In this review, the technical requirements of cardiac
MSCT and some frequent clinical applications are
discussed.
MSCT imaging requirements
Requirements for cardiac MSCT image acquisition
depend strongly on the clinical problem. For example,
CT coronary angiography requires excellent spatial and
temporal resolution, whereas only modest spatial and
temporal resolution is sufficient for the assessment of the
anatomy of pulmonary veins and the left atrium. In
general, the higher the requirements for image quality
become, the more complex the acquisition, the longer scan
time and the higher patient dose. Main aspects with regard
to imaging performance are low-contrast and spatial
resolution, temporal resolution, and scan time. Patient
dose and radiation risk should always be considered as the
counterpart of image acquisition and image quality.
Low-contrast resolution and spatial resolution
Low-contrast resolution is the ability to visualize
structures that demonstrate only a small difference in
Hounsfield units compared with their direct environment.
In cardiac applications of CT, native tissue contrasts are in
general not sufficient to differentiate between, for example,
the vessel wall and its unenhanced lumen, or the heart and
the inner chambers. Contrast enhancement is thus
mandatory for visualizing the lumen of coronary arteries,
the heart chambers, pathology of the myocardium or
anatomy of pulmonary veins. Low-contrast resolution
depends on tube current (mA), the reconstructed slice
thickness, tube voltage, beam filtration and the reconstruc-
tion algorithm, and is strongly correlated to radiation
exposure. In general, low-contrast resolution performance
of CT scanners is not a limitation for the application of
cardiac CT.
Spatial resolution, or high-contrast resolution, deter-
mines the ability to visualize contours of small structures
within the scanned volume. Small objects can only be
resolved when there is a rather large contrast with the
direct environment. Considerable improvement of spatial
resolution in clinical acquisitions was achieved with the
latest generations of multislice CT scanners. This is of
importance, particularly for the application of CT
coronary calcification scoring and CT coronary angio-
graphy. The actual diameters of the lumen of normal
coronary artery segments range from 5 mm in the
proximal segments to less than 1 mm in the distal
segments [3]. This means that spatial resolution of
1.0 mm in all three dimensions should be sufficient for
imaging of the coronary arteries, except for distal segments
that would require a spatial resolution of at least 0.5 mm.
Bypass graft diameter typically ranges from 4 mm to
6 mm. A spatial resolution of 2 mm3
(voxel size) might
thus be sufficient for imaging the lumen of bypass grafts.
For imaging of small structures within the coronary
arteries, such as atherosclerotic plaque and stents, excellent
spatial resolution, even better than 0.5 mm3
, might be
required. Voxel size is often used as an indicator of
spatial resolution. However, voxel size should be inter-
preted with care since smaller voxel size does not
necessarily imply better spatial resolution. Spatial
resolution is preferably expressed as the response of a
delta-function; in CT, this response is either called a point-
spread-function (spatial resolution in the axial plane) or a
slice sensitivity profile (spatial resolution along the z-axis).
Spatial resolution is limited by the acquisition geometry of
the CT scanner, the reconstruction algorithm and the
reconstructed slice thickness. The performance of current
64-slice scanners with regard to spatial resolution,
expressed as the full-width half-maximum of the response
of a delta-function, is within the range 0.6–1.0 mm in all
three dimensions.Received 22 September 2005 and accepted 5 October 2005.
The British Journal of Radiology, 79 (2006), 9–16 E 2006 The British Institute of Radiology
DOI: 10.1259/bjr/67045628
9The British Journal of Radiology, January 2006](https://image.slidesharecdn.com/026britishjournalofradiology-britishinstituteofradiology-2006-130913065550-phpapp02/75/British-Journal-of-Radiology-British-Institute-of-Radiology-2006-eng-13-2048.jpg)
![Temporal resolution
Temporal resolution determines whether fast moving
objects can be resolved in the CT image. Good temporal
resolution limits motion artefacts and blurring of the
image. Principally, good temporal resolution can be
achieved by a short reconstruction window providing
snap shots of the beating heart and coronary arteries.
Good temporal resolution in cardiac CT is realised by fast
data acquisition (fast rotation of the X-ray tube), but even
more importantly by a dedicated reconstruction algorithm.
A recent paper [4] provides information on the rest
period of the heart, which is a measure for the required
reconstruction window. The rest period is defined as the
time during which the 3D motion of a coronary artery is
less than 1 mm. It was reported that, for patients with a
heart rate of 64¡9 beats per minute (BPM), the end-
systolic rest period duration was 76¡34 ms; and the mid-
diastolic rest period duration was 65¡42 ms for the
proximal to middle segments of the right coronary artery.
For the left coronary artery tree, the end-systolic rest
period duration was 80¡25 ms; the mid-diastolic rest
period duration 112¡42 ms. From these data it is
concluded that the duration of a ‘‘snap shot’’ of the
coronary arteries, or in other words the reconstruction
window, should be shorter than 65–110 ms. This is in good
agreement with earlier papers; in one paper it is suggested
that the reconstruction window should be lower than
100 ms for coronary angiography in mid-diastole at
62¡10 BPM [5], and in another paper it is stated that a
100 ms reconstruction window is relatively optimal for
most patients at heart rates up to 90 BPM [6]. All of these
considerations assume image reconstruction at the cardiac
phase point that is associated with least motion, e.g. a
reconstruction window starting between 60% and 80% of
the interval between two consecutive R-waves. More strict
criteria for the reconstruction window apply if the heart
should be assessed at more than one cardiac phase point,
including those that are associated with rapid movement
of the heart wall, e.g. for studying the dynamics of the
myocardium. More strict criteria apply as well when a
1 mm displacement of a coronary artery within the
duration of the snap shot becomes unacceptable. This
may happen, for example, when imaging small distal parts
of the coronary arteries, quantifying coronary stenoses and
assessment of coronary atherosclerotic plaque.
General reconstruction algorithms that are used for
general CT applications provide, in principle, a temporal
resolution equal to the rotation time (360˚ rotation, full
reconstruction), the best achievable temporal resolution
with general reconstruction algorithms is slightly longer
than 50% of the rotation time (180˚ rotation, half
reconstruction). Current 64-slice scanners that are used
for cardiac applications provide a rotation time of 330–
400 ms. These typical rotation times are not short enough
for achieving a 100 ms or shorter snap-shot of the heart,
even if a 180˚ rotation half-reconstruction is applied.
Therefore, dedicated reconstruction algorithms are used in
cardiac CT that allow for reconstruction of synchronized
images from transmission data acquired during two or
more successive heart cycles according to a method
described already in 1977 [7]. These so-called segmented
(multicycle) reconstruction algorithms allow for merging
synchronized transmission data from successive heart
cycles. The more heart cycles that can be included in the
reconstruction, the better the temporal resolution. A low
pitch factor, which is typical for cardiac CT acquisition, is
required to acquire data from more than one heart cycle.
A pitch factor as low as 0.2 is required to record at least
two heart cycles and to achieve a temporal resolution in
the order of magnitude of 100 ms for typical heart rates
between 60–80 BPM. Figure 1 shows, as an example, the
temporal resolution that is achievable with a reconstruc-
tion algorithm that can merge transmission data from an
unlimited number of heart cycles. The figure illustrates the
dependence of the reconstruction window on rotation time
and heart rate and was calculated for a pitch factor of 0.2.
From Figure 1 it can be concluded that, for achieving the
shortest reconstruction window, rotation time should be
adapted to the heart rate.
Scan time
Scan time is the time interval between the start and the
end of one acquisition, sometimes referred to as a
sequence. To avoid breathing artefacts and to limit the
amount of contrast material in contrast enhanced acquisi-
tions, scan time in cardiac CT should remain at least below
30 s, but preferably below 20 s. The extent of the target
volume, as well as acquisition parameters such as rotation
time, pitch factor, section thickness and number of
simultaneously acquired sections, define scan time. In
general a much shorter scan time than 20 s can now be
realised with the current generation of 64-slice scanners for
typical cardiac CT examinations; for example, a typical
Figure 1. Temporal resolution of CT coronary angiography.
The temporal resolution depends strongly on the rotation time
and the reconstruction algorithm. In segmented (multiphase)
reconstructions, temporal resolution depends also strongly on
the pitch factor. The lower the pitch factor, the more cardiac
phases are captured during the acquisition and the better tem-
poral resolution. The graphs are calculated for a pitch factor
of 0.2. The graphs clearly show the dependence of temporal
resolution on heart rate and rotation time.
A de Roos, L J M Kroft, J J Bax et al
10 The British Journal of Radiology, January 2006](https://image.slidesharecdn.com/026britishjournalofradiology-britishinstituteofradiology-2006-130913065550-phpapp02/75/British-Journal-of-Radiology-British-Institute-of-Radiology-2006-eng-14-2048.jpg)

![of quantitative assessment of coronary artery calcification
are screening of asymptomatic individuals with risk factors
for coronary artery disease and follow-up of patients who
received medication for the treatment of coronary artery
disease.
Coronary artery calcification is well visualized with
X-ray techniques such as radiography but only CT
provides a non-invasive method for detecting and
quantifying coronary artery calcification [8]. Coronary
calcification is best detected and measured in a plain CT
acquisition without contrast enhancement.
Quantification of coronary calcium was introduced in
1990 by Agatston et al [9]. They used electron beam
tomography and established the ‘‘Agatston score’’. The
Agatston score requires an acquisition with a special
protocol (3 mm contiguous slices, 130 kV). The Agatston
score is achieved by setting a threshold for the Hounsfield
unit (130 HU) and for the size of the lesion (1 mm2
). Then
a pragmatic weighting of the calcified area is applied
depending on the maximum HU in the lesions for each
image. The total calcium score is calculated by summing
the weighted areas for all images (Figure 2).
With the introduction of MSCT, new acquisition
protocols came into use; prospective ECG triggering in
combination with a half (180˚) reconstruction at 120 kV is
now generally used for calcium scoring. In prospective
ECG triggered MSCT acquisitions, the patient is only
exposed within the 170–200 ms acquisition window at
diastole and radiation exposure is therefore significantly
less compared with retrospective gated MSCT cardiovas-
cular examinations. The application of MSCT for
quantification of coronary calcium made it mandatory
to switch to new quantification methods that can be
compared for different scanners and that are robust with
respect to different scanners and acquisition protocols.
Alternatives for the Agatston score are the volume score
(the volume of all voxels exceeding a certain threshold)
and calcium mass (mg) [10]. The latter quantity holds the
promise of providing the best physical measure for
coronary artery calcification. Unfortunately, there is still
a lack of standardization of the MSCT techniques with
regard to image acquisition as well as to the methodologies
for quantitative coronary calcification scoring. The devel-
opment of standardized and reproducible protocols is a
technical prerequisite for coronary calcification scoring to
become a useful clinical tool. In addition, for screening
purposes, the coronary calcification score will have to be
established as an independent predictor of existing risk
factors for cardiovascular disease [11].
Coronary angiography
MSCT has rapidly evolved through different stages of
technological innovation, allowing high-quality non-inva-
sive 3D imaging of coronary artery morphology (Figures 3
and 4). Recently the diagnostic accuracy of 64-slice MSCT
for the identification and quantification of coronary artery
stenoses has been reported [12, 13]. The patient-based
analysis revealed that 94% of patients who required
revascularization were correctly diagnosed by CT.
Although excellent accuracy for stenosis detection was
noted, technical restrictions for exact quantification of the
degree of stenosis and reliable visualization of small vessel
segments remain [12]. In an accompanying editorial the
authors express the expectation that MSCT will be used in
the near future on a routine basis for the identification of
patients who do not need revascularization therapy despite
the presence of symptoms [14].
The potential value of MSCT for stenosis quantification
is currently under active investigation. Recently, a good
correlation between MSCT and quantitative coronary
X-ray angiography was shown for stenosis quantification
with the use of 16-slice technology, although MSCT
revealed a systematic overestimation as compared with the
reference standard [15]. Perfusion defects related to
previous myocardial infarction or ischaemia may be well
visualized with the use of MSCT (Figure 5).
In CT coronary angiography, beta-blockers may be used
to reduce the heart rate to a lower range, e.g. to 50–
60 BPM to increase the cardiac rest period and with this to
reduce motion artefacts. The resulting imaging perfor-
mance is more predictable and of more consistent quality
when using such medication. Special reconstruction
algorithms for the reconstruction pose an alternative to
the use of medication. The segmented reconstruction
algorithm yields good temporal resolution even at higher
heart rates. Also, when total scanning time is short, e.g.
below 10 s, the quality of the scan improves since, due to
the reduction of the total amount of heart beats in the
scan, less variation can be expected in the heart rate
during the acquisition. Hyperventilation and administra-
tion of oxygen may be used to stabilize heart rate
particularly at scan times of approximately 20 s scanning
time or longer.
Figure 2. Coronary artery calcification imaging at 64-row
multidetector CT (MDCT). 64-row MDCT of a 52-year-old
male patient with risk factors for coronary artery disease.
Small calcifications in the left anterior descending artery. The
total calcium score according to Agatston was 21, and the
total volumetric score was 25, indicating mild atherosclerotic
plaque with mild or minimal coronary artery narrowings likely.
CT-angiography revealed no coronary artery stenoses.
A de Roos, L J M Kroft, J J Bax et al
12 The British Journal of Radiology, January 2006](https://image.slidesharecdn.com/026britishjournalofradiology-britishinstituteofradiology-2006-130913065550-phpapp02/75/British-Journal-of-Radiology-British-Institute-of-Radiology-2006-eng-16-2048.jpg)

![Assessment of ventricular function
With retrospective gated 180˚segmented sinogram space
reconstruction the data can be reconstructed for evalua-
tion of ventricular function [16]. Diastolic and systolic
images can easily be extracted and reconstructed in any
orientation for functional evaluation (Figure 6).
Global ventricular function is generally measured as the
end-systolic and end-diastolic volume (ESV, EDV).
Subsequently, stroke volume (SV) and ejection fraction
(EF) can easily be derived from ESV and EDV.
Semiautomatic software may be used for ventricular
cavity contour detection and for the calculation of
global ventricular function. Regional LV wall motion
can be assessed by visual scoring of cinematic loops of well
described myocardial segments [17].
Integrated CT assessment of the coronary arteries and
regional myocardial function allows assessment of the
functional consequences of a coronary artery stenosis
leading to ischaemia and contraction abnormalities. The
usefulness of this combined approach has been reported in
patients with hypertension and diabetes mellitus [18, 19].
From the same data set global function and left ventricular
mass can also be determined, which have clinical relevance
in patients with hypertension for prognosis and guidance
of therapy.
Several studies have shown that right ventricular
function can also be accurately measured by gated
MSCT. The assessment of right ventricular function may
have special interest in patients with acute pulmonary
embolism. Right ventricular enlargement on chest CT has
been shown to be a predictor of early death in patients
with acute pulmonary embolism [20, 21]. Even the
dimensions of the right ventricle in non-gated CT
images may be predictive for mortality in this setting.
The potential value of gated MSCT for assessing right
ventricular function in patients with pulmonary embolism
is now under investigation.
Assessment of pulmonary veins
Atrial arrhythmias often originate in the pulmonary
veins and can be treated with percutaneous radiofrequency
catheter ablation. With this technique, the arrhythmic foci
are electrically disconnected from the left atrium by means
of catheters placed in the left atrium [22]. Pre-procedural
MSCT examination is helpful to depict the anatomy of the
pulmonary veins and left atrium and particularly to
demonstrate additional pulmonary veins (e.g. middle
lobe vein), which is important for planning the interven-
tional procedure. Variations in pulmonary venous anat-
omy are quite common and comprise variation in the
number of veins as well as the occurrence of common ostia
Figure 5. Multiple perfusion defects imaged with 64-row multi-
detector CT (MDCT). Same patient (78-year-old male) as in
Figure 4 after coronary artery bypass graft operation and mul-
tiple venous bypass graft occlusions. Multiple perfusion defects
with regional wall thinning.
Figure 6. Ventricular function imaging at 64-row multidetector CT (MDCT). 26-year-old male patient after surgery for congenital
heart disease. Ventricular function can be assessed after drawing the endocardial ventricular contours in (a) end-diastolic and (b) end-
systolic phases at multiple cardiac levels, thereby including the ventricular volumes.
A de Roos, L J M Kroft, J J Bax et al
14 The British Journal of Radiology, January 2006](https://image.slidesharecdn.com/026britishjournalofradiology-britishinstituteofradiology-2006-130913065550-phpapp02/75/British-Journal-of-Radiology-British-Institute-of-Radiology-2006-eng-18-2048.jpg)
![and early branching [23]. Three-dimensional surface
rendering reconstructions provide a quick overview of
the pulmonary venous anatomy, but cross-sectional
reconstruction in coronal, sagittal and transverse orienta-
tions is necessary for full appreciation of the morphology
of the pulmonary veins (Figure 7) [24]. Post-procedural
MSCT also offers an opportunity for follow-up of the
pulmonary vein after ablation [25].
MSCT pulmonary venography requires a contrast
enhanced helical acquisition. To avoid motion artefacts
a half reconstruction is generally performed, yielding a
reconstruction window of about 165–200 ms. This is
sufficiently short for imaging the rather large pulmonary
veins with diameters well above 10 mm. Reliable images
can be acquired without the use of ECG gating. Breath-
hold acquisitions with a high pitch factor and resulting
rather low patient dose are routinely obtained. The
potential additional value of ECG synchronized MSCT
is under investigation.
Conclusion
MSCT is a highly accurate tool for the non-invasive
detection of coronary artery disease. Further technical
advances are expected in acquisition techniques as well as
post-processing of the CT data. Detector technology and
arrays may be further expanded, allowing shorter imaging
times. Improved temporal and spatial resolution will
contribute to better stenosis quantification and plaque
characterization. Integration of coronary artery imaging
and functional data are feasible with current MSCT.
Shorter scanning times may allow integration of coronary
imaging, first-pass perfusion imaging as well as wall
motion analysis from the same data set. Other cardiovas-
cular applications also benefit from the improvements in
CT technology. Recently, the value of MSCT for the
evaluation of patients with chest pain presenting to the
emergency department was reported [26]. It was shown
that MSCT is feasible to evaluate chest pain patients
comprehensively. During one comprehensive MSCT pro-
tocol cardiac and non-cardiac causes of chest pain can
accurately be diagnosed. It is expected that MSCT will
become a gatekeeper in patients presenting with chest pain
from various sources.
References
1. Schuijf JD, Bax JJ, Salm LP, Jukema JW, Lamb HJ, van der
Wall EE, et al. Noninvasive coronary imaging and assessment
of left ventricular function using 16-slice computed tomo-
graphy. Am J Cardiol 2005;95:571–4.
2. Paul JF, Wartski M, Caussin C, Sigal-Cinqualbre A, Lancelin
B, Angel C, et al. Late defect on delayed contrast-enhanced
multi-detector row CT scans in the prediction of SPECT
infarct size after reperfused acute myocardial infarction:
initial experience. Radiology 2005;236:485–9.
3. Dodge JT Jr, Brown BG, Bolson EL, Dodge HT. Lumen
diameter of normal human coronary arteries. Influence of
age, sex, anatomic variation, and left ventricular hypertrophy
or dilation. Circulation 1992;86:232–46.
4. Shechter G, Resar JR, McVeigh ER. Rest period duration of
the coronary arteries: implications for magnetic resonance
coronary angiography. Med Phys 2005;32:255–62.
5. Hofman MB, Wickline SA, Lorenz CH. Quantification of
in-plane motion of the coronary arteries during the cardiac
cycle: implications for acquisition window duration for MR
flow quantification. J Magn Reson Imaging 1998;8:568–76.
6. Lu B, Mao SS, Zhuang N, Bakhsheshi H, Yamamoto H,
Takasu J, et al. Coronary artery motion during the cardiac
cycle and optimal ECG triggering for coronary artery
imaging. Invest Radiol 2001;36:250–6.
7. Harell GS, Guthaner DF, Breiman RS, Morehouse CC, Seppi
EJ, Marshall WH Jr, et al. Stop-action cardiac computed
tomography. Radiology 1977;123:515–7.
8. Girshman J, Wolff SD. Techniques for quantifying
coronary artery calcification. Semin Ultrasound CT MR
2003;24:33–8.
9. Agatston AS, Janowitz WR, Hildner FJ, Zusmer NR,
Viamonte M Jr, Detrano R. Quantification of coronary
artery calcium using ultrafast computed tomography. J Am
Coll Cardiol 1990;15:827–32.
10. Ulzheimer S, Kalender WA. Assessment of calcium scoring
performance in cardiac computed tomography. Eur Radiol
2003;13:484–97.
11. Thompson GR, Partridge J. Coronary calcification score: the
coronary-risk impact factor. Lancet 2004;363:557–9.
12. Leber AW, Knez A, von Ziegler F, Becker A, Nikolaou K,
Paul S, et al. Quantification of obstructive and nonobstructive
coronary lesions by 64-slice computed tomography: a
comparative study with quantitative coronary angiography
and intravascular ultrasound. J Am Coll Cardiol
2005;46:147–54.
13. Leschka S, Alkadhi H, Plass A, Desbiolles L, Grunenfelder J,
Marincek B, et al. Accuracy of MSCT coronary angiography
with 64-slice technology: first experience. Eur Heart J
2005;26:1482–7.
14. Achenbach S, Daniel WG. Computed tomography of the
coronary arteries: more than meets the (angiographic) eye. J
Am Coll Cardiol 2005;46:155–7.
15. Cury RC, Pomerantsev EV, Ferencik M. Comparison of the
degree of coronary stenoses by multidetector computed
tomography versus by quantitative coronary angiography.
Am J Cardiol (In press).
Figure 7. Pulmonary vein imaging at 64-row multidetector CT
(MDCT). 64-row MDCT, non-ECG-synchronized imaging. 59-
year-old male patient. Pre-interventional assessment of pulmon-
ary veins for radiofrequency ablation. Posterior view of the
patient’s heart. Common ostium for the left pulmonary veins,
i.e. the pulmonary veins join before entering the left atrium.
Separate ostia for the right pulmonary veins. LS, left superior
pulmonary vein; LI, left inferior pulmonary vein; RS, right
superior pulmonary vein; RI, right inferior pulmonary vein;
LA, left atrium; LPA, left pulmonary artery; RPA, right pul-
monary artery; VC, inferior vena cava.
Cardiac MSCT
15The British Journal of Radiology, January 2006](https://image.slidesharecdn.com/026britishjournalofradiology-britishinstituteofradiology-2006-130913065550-phpapp02/75/British-Journal-of-Radiology-British-Institute-of-Radiology-2006-eng-19-2048.jpg)

![President’s conference paper
Technology solutions for better outcomes: integrated
information management in key to productivity increases in
medicine
H REQUARDT, PhD
Group Executive Management, Siemens Medical Solutions, Henkestrasse 127, 91052 Erlangen, Germany
Abstract. The challenges to healthcare systems around the world are primarily impacted by two topics:
demographic factors and progress in medicine. An ageing population inherently needs more medical services
which add financial burdens, in particular, to public healthcare. Since the level of medical education is growing
at the same time, we are observing an increased demand for sophisticated (in general expensive) medicine.
Drastic changes in financing seem unavoidable. Multiple diagnoses, repeated examinations, trial-and-error,
overcapacities and other signs of missing economical considerations are reinforced by reimbursement systems.
In a world where, in principle, all information is available everywhere, more than a patient’s history should be
accessible. Other industries have knowledge management systems in place that make state-of-the-art expertise
available everywhere. Intelligent patient databases could consist of learning cycles that (i) enable the individual
to benefit from structured knowledge, in addition to personal experience of the physician, and (ii) use the
knowledge generated from the individual to extend the database. The novel area of molecular medicine fits
perfectly well into these scenarios. Only attached to an IT backbone can the flood of information be managed in
a beneficial way. Efficiency improvements in healthcare address the needs of all parties in the system: patients,
providers, and payers. The opportunities, however, can only materialize if everyone is prepared to change. IT
will set the standards for the biggest challenge in healthcare: The paradigm shift in medicine.
Introduction
Demographic developments are placing tremendous
pressure on healthcare systems around the world.
Although age distribution varies significantly in different
countries (e.g. China’s one-child policy versus India’s fir-
tree distribution), problems come down to one common
denominator: We are all living longer.
Figure 1 [1, 2] shows the age distribution in more
developed regions and the prognoses for 2025. It is
obvious that health is a major macroeconomic factor. If
we want to avoid the situation that fewer and fewer payers
have to support more and more users of healthcare
services, we will need to see more elderly people working.
The prerequisite for this development is that they stay
healthy. Healthcare systems thus would need to prove that
the investment in them pays off as a productivity factor.
A related challenge is reflected in the fact that a growing
population is increasingly demanding to actively partici-
pate in medical progress. Mass media and the Internet
depict what is possible today; with the majority of research
being funded by the public purse. Thus, it is a natural
desire that the same paying public also wants to enjoy the
benefits that are generated.
The basic question is: How can all of this remain
affordable? Cutting cost by cutting services is not helpful
for addressing both the need for higher quality care and
the necessity to reduce cost. Instead, all contributors to the
delivery of healthcare need to ask themselves ‘‘How can we
do more with less?’’ If we draw an analogy with industry,
this question translates to ‘‘What levers do we see to
improve efficiency?’’
Innovations drive efficiency
Medical industries are developing not only more cost
effective and reliable systems, but are also generating more
and more relevant patient information in less examination
time.
Figure 2 shows a standard way of looking at CT
datasets. The approximately 2 GB of raw image data that
are typically acquired in a 5 s scan are stored in cache
memories, are post-processed with volume renderers and
can be displayed according to the interpreter’s comfort
view.
A different example is given in Figure 3: Not only has
the amount of data dramatically increased, but so has the
quality. In this case, a high-resolution three-dimensional
(3D) image of the moving heart displays the stent
structures with superb resolution.
The broadening of the application scope is typical for
each of the imaging modalities: Angio suites do excellent
3D imaging with cone beam reconstruction algorithms,
linear accelerators deliver kV and MV images, magnetic
resonance scanners have left the domain of pure
morphologic imaging, and now measure functions in
various ways. As an example, Figure 4 shows colour
coded diffusion spectral imaging that is highly correlated
with the directions of nerve bundles.
The international medical industry has developed many
technologies that can be utilized to improve efficiency inReceived 16 August 2005 and accepted 16 September 2005.
The British Journal of Radiology, 79 (2006), 17–23 E 2006 The British Institute of Radiology
DOI: 10.1259/bjr/23726774
17The British Journal of Radiology, January 2006](https://image.slidesharecdn.com/026britishjournalofradiology-britishinstituteofradiology-2006-130913065550-phpapp02/75/British-Journal-of-Radiology-British-Institute-of-Radiology-2006-eng-21-2048.jpg)


![‘‘smarter data’’. Yes, there will be CT scans that do 256
slices. But at the same time there will be an industry focus
on systems with two or three X-ray detector systems that
can generate not only increased temporal resolution, but
also open up new degrees of freedom with respect to
contrast by applying different anode voltages in the sub-
systems. Figure 8 shows a basic set-up for such a
system.
Overall, the focus of industry will move from ‘‘genera-
tion of data’’ towards ‘‘exploitation of data’’. It is evident
that information technology is a key enabler for that shift.
IT enables process optimization
In a patient-centric system, the ultimate outcome of the
treatment is reflected by the status of the patient. The
typical patient process in a hospital usually starts with
diagnostic steps (radiology, ECG, lab, …), iterates with
various therapeutic procedures (medication, surgery,
radiation, …), and terminates with the recovery of the
patient (ICU, ward, rehab, …). The most competitive
healthcare provider will be the one that optimizes the
entire procedure chain rather than the individual steps
(this does not relieve the individual departments from
delivering the best quality; ‘‘best’’ according to cost
optimization criteria means ‘‘adequate and intelligent’’).
In industrial analogy this means analysis, mapping and
continuous improvement of workflow.
Workflow optimization comprises the moving of
patients, resources and information within the healthcare
continuum according to certain rules. Everything (includ-
ing the rules) is subject to best practice shared across all
relevant healthcare participants throughout the world.
Workflow can be referenced in ‘‘hospital information
systems’’ by so-called workflow engines. An example of
what a workflow engine can contribute is given in
Figure 9: The emergency treatment of an acute stroke
patient is managed by a computer network. The state-of-
the-art workflow engine would not only draft a work list,
it would also monitor all activities in feedback loops.
Cross-checks with rules engines ensure that the patient
experiences state-of-the-art stroke treatment procedures.
Figure 9 gives an impression how a workflow engine can
be programmed according to the local conditions. It is
obvious that workflow engines not only synchronize
Figure 7. Computer-aided detection (CAD) algorithms detect polyps in a virtual colonoscopy. The sensitivity for polyps ¢ 6 mm is
on average 90%; and the median false positive rate is a manageable 3 per volume [3].
Figure 8. Multitube CT set-up. The system enables a new
degree of freedom allowing for double temporal resolution
and/or novel contrast opportunities.
H Requardt
20 The British Journal of Radiology, January 2006](https://image.slidesharecdn.com/026britishjournalofradiology-britishinstituteofradiology-2006-130913065550-phpapp02/75/British-Journal-of-Radiology-British-Institute-of-Radiology-2006-eng-24-2048.jpg)


![treatment plan for the patient is mainly impacted by two
elements: (1) the clinical knowledge database with rules for
utilization of equipment and drugs, contraindications,
standardizations, procedures and others; (2) the EPR
consisting of images, lab data, structured reports, ‘‘omics’’,
etc.
Those databases will be mined by software agents for
reference cases with proven outcome data to derive the
most promising treatment plans. This enables the primary
care physician (PCP) to match his individual experience
with all the information that is available in the data stores.
The databases will not only be filled with expert knowl-
edge from medicine, but will also include related
disciplines like pharmacology, radiation biology, biome-
chanics and others. In short, the PCP has a real, powerful
tool that leaves him with a high degree of confidence that
he has done all he can to help the patient.
It will certainly be a long way to reach this scenario, but
at the same time it is worth defining and working towards
a common vision. Enabling technologies are there to help
make this vision reality. Many new problems will come up
including topics like data protection, ethics, business
models or simply operational realization, and a social
consensus will be required to address them all.
Medicine will never become deductive, but managing its
complexity will become easier. Although basic work
remains to be done, the technological solutions are
available today. It is now a question of political desire
to launch the paradigm shift in medicine.
References
1. Population Division of the Department of Economic and
Social Affairs of the United Nations Secretariat. World
Population Prospects: The 2004 Revision Population
Database. [Online]. 2005 [cited 2005 March 15]. Available
from: URL: http://esa.un.org/unpp/
2. Economic Policy Committee (EPC). Budgetary challenges
posed by ageing populations: the impact on public spending
on pensions, health and long-term care for the elderly and
possible indicators of the long-term sustainability of public
finances. Brussels. 2001 October 24 (EPC/ECFIN/655/01-EN
final). p. 34.
3. Bogoni L, Cathier P, Dundar M, Jerebko A, Lakare S, Liang
J, et al. Computer-aided detection (CAD) for CT colonogra-
phy: a tool to address a growing need. Br J Radiol 2005;78:57–
62.
Technology solutions for better outcomes
23The British Journal of Radiology, January 2006](https://image.slidesharecdn.com/026britishjournalofradiology-britishinstituteofradiology-2006-130913065550-phpapp02/75/British-Journal-of-Radiology-British-Institute-of-Radiology-2006-eng-27-2048.jpg)
![President’s conference paper
The case for particle therapy
B JONES, MD, FRCR, MedFIPEM
Queen Elizabeth University Hospital, Birmingham B15 2TH, UK
Abstract. Among the most important decisions facing the British Government regarding the treatment of cancer
in the National Health Service (NHS) is the purchase of charged particle therapy (CPT) centres. CPT is
different from conventional radiotherapy: the dose is deposited far more selectively in Bragg Peaks by either
protons or ‘‘heavy’’ ions, such as carbon. In this way, it is possible to ‘‘dose paint’’ targets, voxel by voxel, with
far less dose to surrounding tissues than with X-ray techniques. At present the UK possesses a 62 MeV
cyclotron proton facility at Clatterbridge (Wirral), which provides therapy for intraocular cancers such as
melanoma; for deeper situated cancers in the pelvis, chest etc., much higher energies, over 200 MeV are required
from a synchrotron facility. There is an impressive expansion in particle beam therapy (PBT) centres worldwide,
since they offer good prospects of improved quality of life with enhanced cancer cures in situations where
conventional therapy is limited due to radioresistance or by the close proximity of critical normal tissues. There
is a threat to UK Oncology, since it is anticipated that several thousand British patients may require referral
abroad for therapy; this would severely disrupt their multidisciplinary management and require demanding
logistical support.
The benefits of an increase in charged particle therapy
(CPT) centres in the UK would be not only for children
and young adults with cancer, where a reduced risk of
radiation induced malignancy is predicted, but also in
older patients where it is necessary to avoid abnormal
tissues such as an enlarged heart/restricted lung irradiation
and where artificial (metallic) joints may cause difficulties
in the use of conventional radiotherapy techniques. The
results of phase I and II clinical studies are extremely
encouraging. The UK must obtain at least one CPT centre
with protons/ions in order to conduct research and
development; it is suggested that quality adjusted life
years should be used to assess outcomes. It is anticipated
that the UK might eventually require 7–8 such centres in
10–15 years from now. In the meantime, healthcare
purchasers and providers need to put in place mechanisms
and personnel for patient referrals abroad, as well as the
establishment of UK CPT facilities.
Background
The connection between subatomic particles and health
delivery improvements may seem rather tenuous, but the
narrative begins in 1879, when J J Thompson discovered
the negatively charged electron in Cambridge, and
Aneurin Bevan was born in Wales. The subsequent
discoveries of the positively charged proton (a term
coined by Ernest Rutherford in 1920) and the uncharged
neutron by James Chadwick in 1931, confirmed the pre-
eminence of our science. Bevan, with similar precision of
thought, digested the wide recommendations of the Beveridge
Report (1942) and transformed most of its principles to
practical achievements, including the National Health Service
Act of Parliament (1946) and the inception of the service in
1948. Subsequently, Britain was at the forefront of practical
applications of physics and engineering developments in
cancer therapy until the early 1990s, when the reorganized
NHS became disadvantaged in terms of expensive tech-
nological acquisition.
Dr R D Errington related the history of cyclotron
radiotherapy at the BIR President’s Day conference in
2003. He detailed how the initial promising results
obtained with neutron therapy at The Hammersmith
Hospital were not subsequently confirmed in randomized
trials at Edinburgh and at the Clatterbridge facility [1, 2],
which produced neutrons that matched a 5 MeV X-ray
beam. The latter facility was converted to produce protons
on the recommendation of the late Prof. Arthur Jones of
St Bartholomew’s Hospital. This enabled patients with
choroidal melanoma of the eye to receive radical radio-
therapy using protons; this technique was the first example
of three-dimensional (3D) radiotherapy in the UK. Over
1400 patients have by now received this therapy with a
local control rate of 98% – an outstanding achievement
within British medicine [3].
Past attempts to obtain a higher energy facility in
the UK
Since 1992, Clatterbridge, Oxford and the National
Physical Laboratory at Daresbury (near Warrington)
have all unsuccessfully attempted to obtain a higher
energy CPT facility [4]. All these bids were rejected
because of perceived lack of clinical support,
intermittent beam availability, the lack of clinical trial
evidence, the recommendation that a facility should be
sited in a University Hospital campus and perhaps
mostly, the expected high initial costs incurred at a
time when NHS reforms discouraged large-scale
projects, even the provision of new (replacement) linear
accelerators.
More recently, there has emerged a more collective
response from clinical oncologists and medical physicists
who appreciate that obtaining a CPT facility is essential
The British Journal of Radiology, 79 (2006), 24–31 E 2006 The British Institute of Radiology
DOI: 10.1259/bjr/81790390
24 The British Journal of Radiology, January 2006](https://image.slidesharecdn.com/026britishjournalofradiology-britishinstituteofradiology-2006-130913065550-phpapp02/75/British-Journal-of-Radiology-British-Institute-of-Radiology-2006-eng-28-2048.jpg)
![for the advancement of radiation oncology standards in
the UK. The Royal College of Radiologists (RCR), British
Institute of Radiology (BIR) and Institute of Physics and
Engineering in Medicine (IPEM) for example all support
the case for a CPT facility. Recent improvements in the
quality of cancer imaging and the availability of
industrially produced turnkey facilities, has allowed the
question to be carefully re-considered and better under-
stood, particularly in relation to the rapid expansion in
CPT facilities abroad.
Technical aspects
The velocity of heavy charged particles (electrons are
considered to be light) is reduced as they traverse deeper
through tissues. The interaction probability to cause
ionization increases as the velocity falls, so that a peak
of dose occurs at a depth proportional to the energy
imparted to each particle. William Bragg, a British
physicist, described this phenomenon over 100 years ago
[5]. The so called Bragg peak can be ‘‘spread out’’ to
achieve a plateau of uniform dose that covers a target by
use of rotating range-shifting modulators of variable
thickness. In the past, passively scattered beams were
used in this way to provide wide circular or rectangular
beams with spread out Bragg peaks (Figure 1). More
recently, the spot scanning method allows smaller beams
to deposit their peaks within individual voxel targets
defined by good imaging techniques: by the use of
‘‘wobbler’’ magnets and particle energy selection, the
raster scanning system allows cancer bearing voxels
(defined by x, y, z, co-ordinates), to be ‘‘dose painted’’.
The Bragg peak position will depend on the initial
energy imparted to the particles as well as their mass and
charge; the Bethe-Bloch equation contains all the neces-
sary parameters. It can be seen from Figure 2 that the
range for clinical use should be at least 200 MeV in the
case of protons; higher energies – up to 400 MeV – for
carbon ions.
Gantries and robots
Within treatment rooms there are options for beam
arrangements. The simplest approach is to have either
fixed horizontal or vertical beams, or a combination of the
two for the simplest treatments. An isocentric rotating
gantry is required for more complex geometrical problems.
These consist of large cylindrical rotating structures that
contain the beam bending magnets: they weigh 100 tonnes
for protons and 200 tonnes for ions and require movement
with 1 mm precision of beam placement. Future engineer-
ing innovations may reduce the tonnage and costs.
Robotic treatment couches are desirable in order to
rapidly position the patient at predetermined angles
relative to the beams; they may also transport patients
in fixed positions from image guided or other localization
devices in the treatment rooms to the actual treatment
location. Radiographers may feel sensitive about robotics,
but it will always be the radiographer who commands the
robot and remotely monitors their performance.
Typical centre
The typical layout of a centre is illustrated in Figure 3.
The particles are injected from a small linear accelerator
and further accelerated to higher energies around the
synchrotron, then extracted and delivered selectively to
different rooms; the beam switching time between rooms is
Figure 2. Approximate depth dose positions of partially spread
out Bragg peaks for protons of different energies.
Figure 3. A schematic diagram of a synchrotron treatment
centre.
Figure 1. Schematic depth dose diagram of a proton beam
Bragg peak, the spread out Bragg peak and a megavoltage
X-ray beam (modified from Suit et al [12]). The grey shaded
areas indicate the extent of dose reduction within normal tis-
sues situated proximal and distal to the tumour target.
The case for particle therapy
25The British Journal of Radiology, January 2006](https://image.slidesharecdn.com/026britishjournalofradiology-britishinstituteofradiology-2006-130913065550-phpapp02/75/British-Journal-of-Radiology-British-Institute-of-Radiology-2006-eng-29-2048.jpg)
![as short as 10–20 s. A high throughput of patients can be
achieved by efficient placement and preparation of patient
position in advance of the beam availability in each room.
Larger synchrotrons can deliver carbon ions or protons.
Some rooms may be equipped with positron emission
tomography (PET) scanning facilities and other image
guided devices. The overall arrangement is quite different
from standard radiotherapy departments where there is a
linear accelerator in each treatment room. For more
detailed plans see various chapters in Supplement 2 of
Radiotherapy & Oncology (volume 73), 2004 [10].
The dose distribution advantages
Many authors have made important contributions by
means of comparative dose distributions using X-rays and
protons, which are summarized elsewhere [6, 7]. The
essential principles may be better realised by inspection of
relatively simple depth dose diagrams as seen in Figure 4.
In Figure 4A, the spread out Bragg peak (SOBP) is seen
from a single beam entering from the left hand side. In
contrast, the X-ray fall off of dose is pseudo-exponential
as shown in Figure 4D. When two opposed fields are used
there is approximately uniform dosage in the case of
X-rays (as in Figure 4E), whereas for particles there is a
preferential dose deposition where the SOBPs coincide, as
in Figure 4B. For three intersecting beams, there is now
some degree of selectivity for X-rays as seen in Figure 4F,
but the ratios of dose in the centre to that near the surface
is considerably better for the particles as shown in
Figure 4C.
Inspection of axial views of three intersecting beams, as
in Figure 5, shows the different dose distributions achie-
vable. These figures can be normalized to give the same
dose in the central region, with resulting lower peripheral
doses for particles. The absence of dose in one direction
beyond the target is striking – this arrangement may be
used to reduce exposure to critical structures such as
rectum, spinal cord, etc. Rotation of the beams may also
be used to avoid beam traversion through, or scattered
radiation from metal prostheses, which cause dose
uncertainties in treatment planning.
The reduction in the so called integral dose, which is an
assessment of dose to wider volumes within a patient, is
considerable – proton beams generally reduce this by 50%
and frequently by more in some cases [7]. This effect alone
should reduce the risk of second cancer formation [8],
which may be enhanced with the use of some modern
linear accelerator based techniques such as intensity-
modulated radiotherapy (IMRT), where there is a ‘‘dose
bath’’ effect due to increased integral dose. Not only is the
risk of second cancers reduced, but also substantial
reductions occur in dose commitment to organs that are
sensitive to radiation, e.g. kidneys, eyes, lung, heart, and
parts of the nervous system. Low doses to substantial
proportions of these organs can cause functional pro-
blems. For example, consider the treatment plans shown in
Figure 6, where multiple field IMRT is compared with
single field spot scanning protons. Whilst the target
volume is covered equally well with both techniques, the
dose bath effect is readily seen for IMRT, with significant
dose to spinal cord and kidneys; the proton plan
effectively spares these critical organs. Even a tissue
such as bone is highly relevant: bone marrow cell
production is not supported at doses above 30 Gy and
longer term effects include osteoporosis, micro-fractures
and fractures; in practice, low backache is not infrequent
following pelvic radiotherapy, and bone density changes,
revealed by MRI, are seen to exactly correspond to the
beam portals used.
For a wide variety of cancers the advantages of the
improved dose distributions should provide substantial
improvements in the quality of life where normal tissue
doses are reduced and improved cure potential when
tumour dose is increased. These are considered in further
detail in Table 1, although the generic reduction of second
malignancy is not included.
Meticulous studies in Japan, using carbon ions, with
respiratory movement gating compensation, have shown
two extremely important results. They are:
(1) Cure of small peripheral screen detected lung cancers in a
single exposure and without loss of lung function; similar
Figure 4. (A–C) Simplified schematic diagrams of protons and
(D–F) X-ray percentage depth dose distributions for three
simple field arrangements. In B, C, E, F depth is measured
along the direction of opposing fields. Relatively small changes
in dose are not included in these fields.
Figure 5. (a,b). Axial views of simplified schematic dose distri-
butions for three field coplanar techniques using X-rays and
protons.
B Jones
26 The British Journal of Radiology, January 2006](https://image.slidesharecdn.com/026britishjournalofradiology-britishinstituteofradiology-2006-130913065550-phpapp02/75/British-Journal-of-Radiology-British-Institute-of-Radiology-2006-eng-30-2048.jpg)
![cure rates can be achieved by surgery, but with inevitable
loss of lung function [9].
(2) Cure of patients with primary liver cancers treated in
four exposures; again similar rates of cure can be
achieved following surgery but with considerable
morbidity and some mortality [10].
These results suggest that radiotherapy might eventually
replace radical surgery in deeply situated anatomical
locations. The risks and costs of radical surgery are
likely to increase with time in an ageing population. In
addition, these results confirm previous theoretical predic-
tions based on radiobiological modelling that as dose is
better localized to the target and markedly reduced in a
wider range of surrounding tissues, the principles of
fractionation become less important [11]. Thus treatment
can be delivered in far fewer exposures; the economics of
CPT then become more favourable. In addition, the
treatment is more elegant, involves fewer beams and is
potentially less liable to errors made in treatment delivery.
Owing to space constraints it is only possible to show a
limited number of treatment plans. Figure 7 shows the
advantages of a four field proton plan which could be used
to treat a hepatoma or cholangiocarcinoma. The colour
wash dose distribution shows how restricted the dose is to
target; this spares the patient the acute side effects of
nausea, vomiting and severe malaise which occur with
X-ray traversion of the stomach, duodenum and liver.
(a) (b)
Figure 6. (a, b) Comparative dose distributions for IMRT and protons for a recurrent sarcoma in a young 12-year-old boy (repro-
duced by kind permission of Dr A Lomax, PSI, Switzerland and Prof. P Hoskins, Editor of Clinical Oncology).
Table 1. The advantages of charged particle therapy (CPT) in a range of anatomical situations
Cancer bearing region Advantage of CPT
Breast Avoid irradiation of heart, lung and brachial plexus
Head and neck Reduced dose to spinal cord, salivary glands, eyes, bone and brain
Pelvis (e.g. prostate, bladder, rectum) Reduced irradiation of bone, sparing of organs such as bladder, rectum; large sarcomas are
safely treated without sacral plexus damage
Gynaecological system As in pelvis, but also improved dose to lateral parametrium, better distribution for vulvar
cancers; can be used where brachytherapy not feasible; field extension to para-aortic region
with less toxicity
Limbs Reduced lymphoedema and deformities
Lung Better preservation of lung and heart function
Liver/pancreas Marked reduction in acute effects, can safely dose escalate for radio-resistant cancers, e.g.
hepatoma, cholangiocarcinoma
Paraspinal/para-aortic Sparing of small bowel, spine and kidneys
CNS Reduction of irradiation to sensitive structures such as hypothalamus, pituitary, reduced risk
of stroke
Reduction of collateral irradiation to tissues outside the CNS, e.g. all tissues anterior to spine
and reduced irradiation of appendages e.g. external auditory apparatus and eye, etc.
Figure 7. Comparisons of dose distributions for a 4 field
X-ray (photon) plan and a proton plan for treatment of hepa-
tocellular cancer (courtesy of Dr J Munzenrider, Northwest
Proton Therapy Centre, Boston, USA).
The case for particle therapy
27The British Journal of Radiology, January 2006](https://image.slidesharecdn.com/026britishjournalofradiology-britishinstituteofradiology-2006-130913065550-phpapp02/75/British-Journal-of-Radiology-British-Institute-of-Radiology-2006-eng-31-2048.jpg)
![The next example (Figure 8) shows how the brain and
other bony structures in the head and neck can be spared
due to the sheer elegance of a single field proton approach
to treat cancers in the posterior orbit, such as lachrymal
gland cancer or rhabdomyosarcoma. To obtain equivalent
uniformity of dose across the target region, at least 2 or 3
X-ray fields would be required, with resultant exit doses
into the brain.
The existing evidence base
The clinical evidence base consists of phase I/II dose
escalation studies. There are no randomized control trials
that compare CPT with conventional radiotherapies [6],
although there are randomized phase II ‘‘dose searching’’
studies. One example is the randomization between 72 Gy
and 78 Gy cobalt Gray equivalent (CGE) for skull base
chordomas at Massachusetts General. Some international
authorities consider that randomized studies that compare
conventional X-ray therapy with protons are not justified
because of the advantageous dose distributions for the
latter [12]. Whereas this may be true for skull base
tumours and in hepatic cancers, there must be greater
justification elsewhere, e.g. the comparison of IMRT/
implants with protons in prostate cancer. Whether phase
III studies (comparisons with conventional radiotherapy)
will be performed remains to be seen: some authorities
consider that such research would be unethical [12]. It is
inevitable that randomized comparisons of CPT against
radical surgery will have to be done for small screen
detected cancers in deeply situated tissues (see below).
Misconceptions
It is not surprising that misconceptions abound
when referring to CPT. Comparisons are often made
with neutrons due to their production from similar
sophisticated equipment. It must be remembered that
neutrons are neutral particles and consequently do not
have Bragg peak characteristics: the additional toxicity
seen with neutron therapy was due to the higher relative
biological effect (RBE) and high integral doses.
Precision is another issue: are protons and ions too
precise? Certainly, the dose can be painted onto any safe
volume, so that tumour margins can be fully respected.
There is no reason why, in certain tumours, one cannot do
wide initial volumes, shrinking down to smaller targets
with increasing dose; protons could be used with three
definite dose volume regions, e.g. 55 Gy, 65 Gy and 75 Gy
volumes defined around a target simultaneously.
Many oncologists assume that the advantages are only
seen in tumours such as skull base chordomas. It must be
realised that such tumours were treated because of poor
results with conventional therapy and with limited proton
beam time coupled with relatively low energy beams that
precluded treatment of deeper structures. Greater beam
availability has allowed testing of CPT in a wider variety
of tumours in different locations.
Added value for science research and teaching
A clinical facility could also be used for radionuclide
production: the particles can activate stable elements to
become radioactive, with applications in healthcare and
industry. Overnight production allows income generating
use of short-lived radionuclide on the following day.
Synchrotron radiation, essentially mono-energetic brem-
strahlung emitted when the particles are deviated by
magnets, can be used for X-ray crystallography studies.
Particle micro-beam analysis of solid state and biological
material can also be pursued, e.g. intracellular diagnostic
capacity at nanometre levels, testing of materials for their
resistance to cosmic rays prior to space flights. A detailed
case is presently being written by the Engineering and
Physical Sciences Research Council (EPSRC) Medical
Applications of Ion Beams Network.
Contributions from molecular biology
The vast expansion in knowledge gained by research in
molecular biology applied to oncology will inevitably
result in more reliable early diagnosis of cancer. Screening
of a population by ‘‘PCR (polymerase chain reaction)
amplification’’ techniques and proteomic techniques
should detect aberrant DNA and protein products from
quite small cancers in body fluids. Further gene specific or
target protein imaging using sophisticated forms of PET
scanning may be sufficient to confirm the presence of small
cancers in deeply situated organs. Image guided biopsies
may also be necessary in some cases. These approaches are
probably more practical than the more distant Holy Grail
of cancer cure following the application of such
approaches. This is not to say that such approaches will
not be useful, particularly in modifying cancer growth
patterns and metastatic potential; but when used alone,
molecular approaches may be doomed to failure because
of the capacity of a cancer to produce further mutations
and to bypass metabolic blockade even when multiple
approaches are used. However, the reliable earlier
diagnosis of cancer would create a high demand for
Figure 8. An example of a single field application of protons
to treat a posterior orbital cancer (courtesy of Dr
J Munzenrider, Northwest Proton Therapy Centre, Boston,
USA). The colours denote different dose levels with red being
the full prescribed dose, with fall off to the limits of the beam.
B Jones
28 The British Journal of Radiology, January 2006](https://image.slidesharecdn.com/026britishjournalofradiology-britishinstituteofradiology-2006-130913065550-phpapp02/75/British-Journal-of-Radiology-British-Institute-of-Radiology-2006-eng-32-2048.jpg)
![surgery and radiotherapy, particularly highly focal forms
of radiotherapy that enable a high localized dose to be
delivered with good sparing of normal tissues, as in CPT.
The decisive clinical trials of the future may be those that
compare CPT with surgery, particularly in sites where the
latter has a high morbidity, mortality and cost, e.g.
hepatic, pancreatic and renal surgery.
Contributions from medical oncology
The reduction of exit dose radiation to skeletal regions
that contain active bone marrow will reduce the risk of
severe neutropenia and the morbidity and mortality that
follow septicaemia. Thus CPT radiotherapy may be
combined with more aggressive chemotherapy regimens.
In addition, the risk of subsequent organ failure on
exposure to certain classes of radiotherapy may be
reduced. For example, the cochlear sparing associated
with medulloblastoma proton-therapy is likely to reduce
the high tone deafness associated with the use of Cis-
platinum treatment [13]; the risk of renal failure may be
reduced when using protons instead of IMRT to treat the
para-aortic nodes in metastatic or advanced local cervix
cancers. Also, the risk of severe cardiomyopathy may be
reduced – even in the case of later exposure to
anthracycline drugs – if the heart has not been exposed
to significant radiation dose by use of CPT, e.g. in the case
of left sided breast cancer. There is clearly a wide
prospectus for research with a major input from medical
oncologists with an interest in radiotherapy in this
important area of oncology.
Contributions from surgery
The increasing future role of radiotherapy in small
volume deep-seated cancers has already been mentioned.
For larger cancers, volume reduction using surgery may
still be desirable, as might the concept of ‘‘improving
treatment geometry’’ by selective resection and restoring a
finite space between tumour and critical normal tissues.
Prolonged surgery will always reduce tissue tolerance
owing to accumulated vascular damage. Decisions regard-
ing operability, the extent of surgery and the necessary
dose of radiation will always need careful consideration
according to circumstances. The possibility of pre-
operative CPT in some situations would be useful: in
Massachusetts General Hospital there is already some
experience of pre-operative proton therapy to paraspinal
bone tumours in order to reduce the potential for
brachytherapy catheter implantation of tumour cells
when radio-iodine seed implants are made into the
adjacent bone situated distally to the tumour. There is
clearly considerable scope for research in the degree to
which surgery and CPT can be combined.
Research and development: quality adjusted survival
end points
There is increasing disquiet that very large trials are
required to detect small incremental changes in outcomes,
with a tendency to favour patient survival as the primary
end point, possibly with inclusion of some separate quality
of life study. This stance is not unreasonable for
comparisons of chemotherapy schedules, where severe
acute toxicity is life threatening and influences survival.
Such approaches are far from ideal for the assessment of
new radiation techniques where subtle long-term differ-
ences in a wide spectrum of tissues are more relevant.
Newer forms of trial assessment will probably be
necessary. One such approach is considered here. In a
computer generated survival curve with only 100 patients
in each treatment arm, with a survival advantage of ,10%
for CPT c.f. X-rays, the p-value exceeds 0.05 using the log-
rank test (p.0.05). The side effect profiles (graded in four
categories according to ascending severity) show subtle
improvements with CPT, although when tested using a
contingency table the Chi-squared statistic shows a non
significant trend (p.0.05) because of the low numbers in
each category. But when survival is adjusted by using the
toxicity grade factor F defined as (5-x)/5, where x is
the toxicity grade with five categories, the quality adjusted
survival (F times the actual survival) becomes highly
significant (p,0.0001). More work is required to justify
and encourage these approaches, but the potential
advantages in terms of cost and rapidity of obtaining
results with a greater number of trial arms containing
different doses/treatment combinations are readily appar-
ent from the example given. Such a novel approach could
be used within CPT studies.
The threat to British oncology
If the UK will not invest sufficiently rapidly in CPT
facilities, there is a real risk of there being between 5000
and 12 000 patients who will require or demand therapy
abroad in around 10 years from now [14]. These estimates
were arrived at using the logistic equation to simulate
supply and demand with best and worst case scenarios for
overall capacity to accept UK referrals abroad. Treatment
abroad would undoubtedly cause severe disruption of
multidisciplinary cancer care as well as anticipated social
and linguistic problems. In terms of staff retention, there is
a risk that many British physicists, radiographers and
oncologists might be attracted to work abroad. Also, the
UK clinical trial portfolio may not contain state of the art
radiotherapy and consequently our trials may become
irrelevant and ignored elsewhere in the world.
Costs
It has become politically incorrect to mention costs in
medical circles, although cost effectiveness is deemed
respectable and quotable. Such restrictive criteria are, for
example, accepted by The British Medical Journal for its
publications. One cannot escape the fact that the costs for
synchrotron commissioning are large, of the order of
£70–100 million depending upon the specifications for
protons and the more expensive ions and how many large
gantries are required. Some consideration has already been
given to cost benefit and patient demand in Switzerland,
Sweden, France and Austria [15–18]. Cost benefit will be
most accurately measured prospectively within clinical
trials. The costs charged will vary with the number of
exposures: presently around £12 000 for 4 exposures at
Clatterbridge; but with some economies of scale and
improved throughput one can envisage CPT for around
The case for particle therapy
29The British Journal of Radiology, January 2006](https://image.slidesharecdn.com/026britishjournalofradiology-britishinstituteofradiology-2006-130913065550-phpapp02/75/British-Journal-of-Radiology-British-Institute-of-Radiology-2006-eng-33-2048.jpg)
![£8000–25 000 per patient, depending on the fractionation
used; this is less than the cost of renal dialysis necessary to
keep a patient alive for 1 year and compares favourably
with the cost of prolonged radical surgery.
A single UK centre should recoup its own initial and
running costs within 6 years providing it can treat 2500
patients by its third year of operation. However, the UK
would depend on a multitude of healthcare purchasing
agreements – a most unsatisfactory system for the
provision of complex healthcare. Definitive cancer treat-
ment using radiation should be separated from these
cumbersome procedures, with a clear assurance that all
British patients with a diagnosis of cancer will receive
equal access to more complex therapy where necessary.
Dr Neil Burnet has estimated from Swedish data
(Burnet N, personal communication) that the proportion
of total cancer care costs spent on radiotherapy would
increase from the present 5% to 6% if 15% of all
radiotherapy is given by protons [18]. This is likely to
be cost effective in the long term because of the reduced
side effects and compares well with the present expenditure
on cytotoxic chemotherapy, which accounts for around
12% of total cancer care.
It remains unclear as to how funding can be achieved
without a high level political decision. Even the new
Foundation NHS Trusts cannot borrow the necessary
monies to enable CPT. Our NHS needs better structures
that can arrange finance, whether public or private:
perhaps a return to regional and supraregional systems
for cancer care?
Logistics for a National Centre
The NHS has developed impressive Cancer Networks as
part of its Cancer Plan, and CPT will need to be
imaginatively superimposed on this framework. These
existing networks are essential to ensure equity of access
for CPT. Each local Network should form the basis of
referral to special multidisciplinary team (MDT) meetings
concerned with CPT. When a clinical indication is
identified, then appropriate dose planning assessments
are necessary: this might be achieved by electronic transfer
of data to a national reference centre which itself might be
virtual, i.e. it can be envisaged that all cases of tumour
type X might be independently assessed in City A, and for
tumour type Y in City B as for the physical appropriate-
ness of IMRT or CPT. The referring city could also plan
with the two modalities and confer with the national CPT
centre. Encouragement for physicists and oncologists to
attend a National Centre on a rotational or frequent basis,
e.g. for specific MDT and treatment planning meetings,
should also be encouraged. A national service will need to
have strong links with other centres abroad for the
treatment of rare conditions.
Logistics for referral abroad
The prospect of referring hundreds or thousands of
patients abroad is daunting. The time taken to assess and
counsel, and to send all diagnostic information away is
significant. There is an immediate need for full time staff
devoted to these logistics, with attention to transfer
funding for provision of appropriate care abroad. British
staff should be put in place to support patients and
families whilst abroad and also to promote training in how
to deliver CPT. Eventually, the number of treatment
facilities in the UK should become appropriate to meet the
needs of the British people. However, UK healthcare
planners should urgently apply themselves to these
problems and produce appropriate plans that meet the
most likely short and long-term requirements.
Politics/Government/Research Councils and Charities
CPT needs to be fully researched, with major UK
participation. At least one high-energy UK CPT facility
should be established to conduct clinical research and
trials, with equitable patient referral via the Cancer
Networks. The immediate questions for the UK autho-
rities are ‘‘when’’ and ‘‘how many facilities’’ do we need?
These important decisions confront the UK Government
for future cancer care, and must be judged in the context
of the proposed increased investment in the scientific base
of this country [19]. The concept of joined up working
across the various Research Councils (EPSRC, MRC,
Accelerator Science, N-Tech), and linked to the major
cancer charities (Cancer Research UK) should allow the
UK to further develop the technology that underpins the
most sophisticated form of radiation therapy against
cancer. It would be tragic to wait until public awareness
forces the issue. Bevan, an astute politician and cancer
sufferer, would surely have sensed that the NHS should
possess the weapon of particle radiotherapy within its
arsenal against cancer, in the same way as he bravely
supported an independent nuclear deterrent. He wanted
only the best for the British people and so should we.
Acknowledgments
The author is indebted to the following for discussions
and their encouragement. Oncologists & Physicians: Prof.
Pat Price, Dr Neil Burnet, Dr Trevor Roberts, Dr R D
Errington, Dr P R Blake, Dr F Saran, Dr D Dearnaley,
Dr D A L Morgan, Dr R Taylor, Dr A Cassoni, Dr M
Gaze, Dr K I Hopkins, Dr D J Cole, Dr P N Plowman, Dr
R Beaney, Dr R Rampling, Dr D Spooner, Dr A Crellin,
Dr N G Glaser, Dr R H Phillips, Dr D V Ash, Prof. A
Price, Prof. W Duncan, Prof. A Munro, Dr J Staffurth,
Prof. C Coombes, Dr R K Coker, Prof. W Littler. RCR:
Dr A Barrett, Dr R Hunter, Dr M V Williams, Prof. P
Hoskins, Dr F Calman. Surgeons: Mr I McIndoe, Mr R E
Kingston, Prof. G Cruickshank. Medical Physicists: Dr A
Kacparek, Dr Roger Dale, Dr Ivan Rosenberg, Dr Stuart
Green, Prof. A Beddoe, Dr S Blake, Dr D Thwaites, Dr A
Nahum, Dr A Carabe. Academic Physicists: Dr K Kirkby,
Dr D Parker, Prof. J Nelson. National Physics
Laboratory: Dr H Palmens, Dr D Rayner.
Declarations: BJ is a Trustee of The Cyclotron Trust
(UK Charity) and a member of the EPSRC Medical
Applications of Ion Beams Network.
References
1. Errington RD, Ashby D, Gore SM, et al. High energy
neutron treatment for pelvic cancers: study stopped because
of increased mortality. Br Med J 1991;302:1045–51.
B Jones
30 The British Journal of Radiology, January 2006](https://image.slidesharecdn.com/026britishjournalofradiology-britishinstituteofradiology-2006-130913065550-phpapp02/75/British-Journal-of-Radiology-British-Institute-of-Radiology-2006-eng-34-2048.jpg)

![President’s conference paper
The contribution of PET/CT to improved patient management
P J ELL, FMedSci, FRCP, FRCR
Institute of Nuclear Medicine, UCL, London, UK
Abstract. With the introduction of both SPET/CT and PET/CT, multimodality imaging has truly entered
routine clinical practice. Multiple slice spiral CT scanners have been incorporated with multiple detector gamma
cameras or PET systems, such that the benefit of these modalities can be achieved in one patient sitting. The
subject of this manuscript is PET/CT and its impact on patient management. Applications of PET/CT span the
whole field of medical and surgical oncology since very few cancers do not take up the labelled glucose tracer,
18
F-FDG. Given the contrast achieved, high-quality data can be obtained with FDG PET/CT. This technology
has now spread worldwide and has been the subject of intense interest, as witnessed by the vast body of
published evidence. In this short overview, only a brief discussion of the main clinical applications is possible.
Novel applications of PET/CT outside the field of oncology are expected in the near future.
Introduction
The technologies of positron emission tomography
(PET) and spiral computed tomography (CT) have been
combined in a single multimodality detection instrument.
The PET/CT scanner provides, in a single patient sitting,
both the data to be expected from a high-end advanced
spiral CT scanner and information recorded by a top of
the range PET scanner, capable of depicting the distribu-
tion of positron-labelled tracers such as fluorodeoxyglu-
cose (FDG). Routine image fusion is obtained, CT data
being merged with PET data to aid in the exact
localization of the site of FDG uptake. CT information
is also used for the purpose of attenuation correction,
which is now almost instantaneous; as a consequence,
whole-body PET/CT studies can be obtained in less than
30 min. This has led to an increase in patient acceptance
and throughput (30% over that achieved with PET alone).
Scanning times are expected to improve further in the near
future. With PET/CT studies obtained from a flat bed, this
information can be used to improve radiotherapy plan-
ning, a novel and rapidly evolving application of this
technology. PET/CT leads to improved lesion detection
and localization and a faster learning curve for all
involved; it has achieved significant acceptance at multi-
disciplinary case conferences [1, 2].
Applications
Tables 1 and 2 summarize the present and predicted
areas of application of PET/CT, and anticipated changes
in tracer use. There are realistic expectations that a
number of novel tracers, labelled with, for example, 18
F or
even 68
Ga (to mention just two radionuclides), will lead to
useful clinical studies on atherosclerosis [3], angiogenesis,
hypoxia and detection of amyloid plaque in Alzheimer’s
disease. Other tracers such as 18
F-labelled thymidine
(FLT: a marker of TK1 activity and indirectly of cellular
proliferation) and 18
F-labelled dopamine have already
been applied in the fields of oncology (FLT and dopamine)
[34, 35] and movement disorders (dopamine). The discus-
sion below will, however, be restricted to the use of FDG
in oncology.
Labelled FDG provides some of the highest signal-to-
noise ratios to have been observed in nuclear medicine.
This is the result of a number of factors which play a
role in the cellular uptake of FDG: over-expression of
membrane GLUT transporters, increased glucose trans-
port in malignancy, increased glycolysis, and increased
hexokinase activity coupled with a decrease in glucose-6-
phosphatase activity. It is also now well known that
maximal FDG uptake in the lesion is not reached within
the first hour of intravenous administration. Invariably, a
further increase in the signal-to-noise ratio can be
observed at 2 h, and a plateau is reached much later. It
must also be stressed that FDG is not a cancer-specific
ligand: macrophages actively take up FDG [4, 5], and
granulomas and inflammatory lesions can be falsely
interpreted as malignant.
From a practical point of view, the unit most often used
to quantitate FDG uptake is the standardized uptake
value (SUV). This normalizes the FDG taken up in a
region of interest to the total amount of tracer injected and
the patient’s body weight. The SUV is time dependent,
since FDG continues to accumulate during the period of
imaging. For each study, SUVs have to be measured at the
Table 1. Present and predicted areas of applications of
PET/CT
Present Future
Oncology 97% Oncology 70%
Infection 2% Infection + Musculoskeletal 5%
Cardiology 1% Cardiology 15%
Psychiatry 10%
Table 2. Anticipated changes in tracer use
Present Future
FDG 95% FDG 85%
68
Ga + Others : 15%
Received 31 May 2005 and accepted 6 September 2005.
The British Journal of Radiology, 79 (2006), 32–36 E 2006 The British Institute of Radiology
DOI: 10.1259/bjr/18454286
32 The British Journal of Radiology, January 2006](https://image.slidesharecdn.com/026britishjournalofradiology-britishinstituteofradiology-2006-130913065550-phpapp02/75/British-Journal-of-Radiology-British-Institute-of-Radiology-2006-eng-36-2048.jpg)
![same time after administration of FDG. From a region of
interest, average or maximum SUVs can be obtained, the
maximum SUV being the most reproducible value for
comparative purposes. SUVs greater than three are most
often associated with malignancy. Whilst this cut-off is
somewhat arbitrary, it is of value since it helps to
distinguish malignant from benign nodal disease: enlarged
nodes on CT with low SUVs are almost always benign.
PET/CT and FDG in oncology
As one might expect, the main areas of interest are in
diagnosis, staging, treatment monitoring and radiotherapy
planning [6].
Diagnosis
PET/CT is infrequently used to offer or aid in the
diagnosis of a patient’s primary condition, the principal
indications for this purpose being suspected paraneoplastic
syndrome, pyrexia of unknown origin and unresolved
suspicion of a CNS tumour (the more frequent application
is for differential diagnosis of post-treatment radiation
necrosis versus recurrence, rather than diagnosis at
presentation). Impressive data have been obtained in the
diagnosis of paraneoplastic syndromes and a variety of
vasculitides and arteritides [7]. Occasionally PET has
helped in the evaluation of patients with malignant
paragangliomas and carcinoid tumours [8], and PET/CT
holds promise for this indication.
Staging and re-staging
It is in the setting of cancer staging that PET/CT comes
into its own. Combined PET/CT has been shown to be
superior to other imaging modalities in most tumour types.
A gain of 20% was documented when the TNM tumour
classification was used as the comparator and PET/CT was
compared with whole-body MRI [9].
In lymphoma, PET/CT is better than CT in the
diagnosis of both nodal and extranodal disease, and can
detect disease in normal-sized lymph nodes that will be
overlooked by CT. As a consequence, PET/CT upstages
approximately 40% of all cases of lymphoma. PET/CT is
also better than CT for the purpose of post-therapy
evaluation owing to its greater predictive value: a positive
post-treatment PET study is associated with poorer
prognosis, whilst a scan performed after the first cycle
of treatment is often predictive of response, especially in
cases of aggressive Hodgkin’s disease and non-Hodgkin’s
lymphoma [10–12]. FDG PET is useful to guide adoptive
immunotherapy with donor lymphocyte infusions post
transplant [13].
With regard to non-small cell lung cancer (NSCLC),
three major studies have shown that PET/CT prevents
unnecessary surgery in one out of five patients deemed
operable by other criteria [14–16]. This is because PET/CT
upstages a large proportion of patients by demonstrating
both soft tissue and skeletal involvement. A further study
found that PET/CT resulted in a change in management in
30% of patients with NSCLC [17]. Recently, Goren et al
[18] discussed the relative roles of CT, PET and
endoscopic-guided ultrasound with needle aspiration in
the management of patients with lung cancer.
There is a clear clinical role for PET/CT in colorectal
cancer. It is of value for staging of recurrent disease,
detection of liver involvement, detection of local recur-
rence, differential diagnosis of recurrent disease from scar
and assessment of patients who present with rising tumour
markers [19–21]. A meta-analysis carried out over a 5-year
period showed that FDG PET changed the management in
approximately 35% of patients in the setting of colorectal
cancer. Often PET/CT demonstrates multiple liver deposits
not seen on other imaging modalities [22]. A case could
now be made that PET/CT should be the first imaging
modality to be employed in the staging and re-staging of
colorectal cancer.
PET/CT is also applied to the staging and re-staging of
patients with cancers in the head and neck, breast,
oesophagus, pancreas, cervix and testicle, as well as
patients with sarcomas and melanomas.
In the head and neck, PET/CT misses micrometastatic
disease (as do all imaging modalities) but it is useful in the
context of upstaging N0 disease [23, 24]. In patients who
present with cervical adenopathy and negative cross-
sectional imaging (CT/MRI), PET/CT is a useful investi-
gation [25]. Patients with advanced disease tend to be
upstaged with PET/CT. PET/CT is useful in disease
monitoring after therapy (surgery, chemotherapy or
radiation), but the optimal timing of this application
remains controversial. The possibility of a false positive
inflammatory response must be borne in mind. In thyroid
cancer, PET/CT should be restricted to the re-staging of
patients with raised serum markers (thyroxine-binding
globulin, calcitonin, carcinoembryonic antigen) who
present with negative cross-sectional imaging and
negative 131
I scans [26, 27].
In breast cancer, PET/CT is not used to stage the axilla
owing to its failure to detect micrometastatic disease. PET/CT
is, however, useful in re-staging, in the detection of nodal
disease and in the visualization of distant disease in
unsuspected sites. PET/CT scanning uncovers deposits in
the skeleton and can be helpful in the evaluation of internal
mammary and mediastinal node involvement. It also appears
useful in the evaluation of response to treatment, absence of
response on PET/CT carrying a worse prognosis. Scarring
and fibrotic masses can be distinguished from active disease
on the basis of FDG uptake.
In the curative setting, PET/CT is used for the
investigation of the nodal spread of oesophageal cancer.
Here, PET/CT is better than CT alone. A growing body of
evidence shows the utility of PET/CT in the evaluation of
response to therapy. A study by Weber et al [28]
investigated 40 patients. A PET study was performed at
baseline and 2 weeks after initiation of chemotherapy. The
first scan had a sensitivity of 93% and a specificity of 95%.
Patients who responded to therapy had a reduction in
FDG uptake by 54%, whilst in non-responders the
reduction in FDG was of the order of 15% or less. In a
similar study by Brucher et al [29], 27 patients with
oesophageal carcinoma were given chemotherapy and
radiotherapy. Patients responding to the treatment had a
reduction in FDG uptake of 72%, whereas those who did
not respond had a reduction of only 22%. Most studies of
this type now point to the utility of FDG PET in the
assessment of early response to treatment.
PET/CT to improve patient management
33The British Journal of Radiology, January 2006](https://image.slidesharecdn.com/026britishjournalofradiology-britishinstituteofradiology-2006-130913065550-phpapp02/75/British-Journal-of-Radiology-British-Institute-of-Radiology-2006-eng-37-2048.jpg)
![In melanoma patients, PET/CT is not useful for initial
staging or in early disease, but it is of value for re-staging
of more advanced disease. Melanoma metastases are
intensely FDG avid. PET/CT is also used in the re-staging
of patients with carcinoma of the cervix. Recurrent disease
can be distinguished from non-viable necrotic or fibrotic
post-therapy tissue. PET/CT has been used in a variety of
other cancer types, such as GIST tumours, mesotheliomas,
multiple myelomas and sarcomas. Pancreatic cancer,
neuroendocrine tumours and germ cell tumours and
their deposits can all exhibit intense FDG uptake. In
contrast, prostate cancer and deposits from this tumour
often exhibit poor FDG avidity; hence PET/CT with FDG
is not useful in this context.
Treatment monitoring
In part, this application has already been alluded to. It
is evident that a metabolic response can precede a change
in tumour size, and a reduction in FDG uptake can be
seen within a matter of hours in patients with lymphoma
or germ cell cancer in whom treatment is effective [30, 31].
Eventually PET/CT will be used to assess the biology of
the individual tumour and its response to treatment [32],
with novel markers aimed at imaging proliferation [33–36],
hypoxia, angiogenesis, apoptosis, etc.
PET/CT is useful to assess the efficacy of novel
therapies. This has been demonstrated with Gleevec in
the treatment of germ cell cancers, but PET/CT will have
wide applicability in a number of new settings. It will be
used as a surrogate marker for drug response, and this
might imply yet another revision of the established but still
insufficiently used RECIST criteria for tumour response to
therapy.
Eary et al [37], studied the effect of tumour hetero-
geneity, reflected in heterogeneity in FDG uptake, in
patients with sarcomas. A 30% increase in risk of death
was observed for every increase of 1 standard deviation
(SD) in tumour heterogeneity, and there was a 12%
increase in risk of death for every increase of 1 SD in the
maximum SUV. However, the concept of a metabolic
response as assessed by FDG will need to be validated in
larger studies. In breast carcinoma patients treated with
Tamoxifen, a flare response, albeit transient, has been
described [38]. When such a response occurs it tends to do
so 8–10 days after the commencement of Tamoxifen, and
is usually an indicator of subsequent patient response to
the treatment [38]. It is also recognized that patients
studied soon after radiotherapy may exhibit an increase in
FDG activity owing to an inflammatory response [39].
MacManus et al [40] have nevertheless shown the utility of
evaluation of the metabolic response by PET in patients
with NSCLC.
Radiotherapy planning
A PET/CT scanner can be used to inform radiotherapy
planning. The CT component of the instrument is identical
to a conventional spiral CT and modern PET/CT scanners
are available with 4-, 8- or 16-slice spiral CT scans. The
CT component can be used for attenuation purposes only,
in order to aid in the localization of the abnormality seen
on the PET scanner, or it can be used at high power to
record data identical to those that would be obtained using
a conventional CT. In patients with cancer, radiation
exposure should often be considered of secondary
importance, given their age, survival rates and therapeutic
aspects. It can therefore be argued that PET/CT should
become the first imaging study in a significant proportion
of patients with cancer. From the above it can be seen that
the CT information obtained from the PET/CT instrument
can also be used for the purpose of volume planning and
that the available PET information can be similarly used
to better delineate tumour margins, whilst also distinguish-
ing viable from non-viable tumour and aggressive from
less aggressive disease. Ultimately, a more rational
approach to radiotherapy planning is an achievable goal.
Data are beginning to accrue that confirm this approach
and its utility [41].
Imaging the skeleton
With PET, it is possible to obtain data from skeletal
metastases via two tracers: 18
F-labelled fluoride ion, which
is directly taken up by the skeleton, and 18
F-FDG. More
data need to be obtained before final recommendations
can be made regarding the use of these two tracers for
skeletal imaging. It is already apparent, however, that in
many cancers, FDG can demonstrate both soft tissue and
skeletal involvement; indeed, it has been advocated that
conventional bone scanning is no longer required when
staging NSCLC patients with FDG. In multiple myeloma,
FDG is superior to conventional bone scanning in the
detection of bony deposits. If scanner availability and
tracer costs were not limiting factors, 18
F-fluoride scanning
of the skeleton would come to replace the conventional
bone scan owing to the merits of PET/CT co-registration
in the context of both malignant and benign bone disease
[42–44].
Future developments
Multimodality imaging is here to stay and image fusion
will become routine. The first truly routine implementation
of image fusion involving a large number of patients has
been achieved with PET/CT. The design properties of
PET/MRI are under consideration, and progress has
already been made in this field with small animal scanners.
The next generation of PET/CT technology is likely to
make use of new radiation detectors and electronics.
Discussions are now focusing, for example, on the
reduction of whole-body imaging times to less than
15 min and the introduction of routine respiratory and
cardiac gating for improvement of lesion localization and
margin definition. Multiple slice spiral CT scans will open
the way for cardiac imaging, and interesting developments
are expected in this field, which, as with nuclear medicine
in general, is heavily dependent on the emergence of new,
clinically useful ligands. There is realistic hope that these
new ligands will lead to novel practical applications in
neurology, cardiology and oncology. As individually
tailored medicines begin to impact on healthcare, these
technologies will find special relevance in determining
patient response to these therapies. An early indicator of
lack of response may be not only beneficial but also
immensely important in economic terms. The future for
P J Ell
34 The British Journal of Radiology, January 2006](https://image.slidesharecdn.com/026britishjournalofradiology-britishinstituteofradiology-2006-130913065550-phpapp02/75/British-Journal-of-Radiology-British-Institute-of-Radiology-2006-eng-38-2048.jpg)
![PET/CT imaging as a surrogate endpoint for novel
therapeutic interventions is bright. This will imply a
rethink of traditional criteria for lesion response –
conventional RECIST criteria will need to be re-assessed
in the light of the metabolic parameter made available by
PET [45].
References
1. Ell PJ and von Schulthess GK. PET/CT: A new road map.
Eur J Nucl Med 2002;29:719–20.
2. Schoder H, Erdi YE, Larson SM, Yeund, HWD. PET/CT: a
new imaging technology in nuclear medicine. Eur J Nucl Med
Mol Imaging 2003;30:1419–37.
3. Davies RJ, Rudd JH, Weissberg PL. Molecular and
metabolic imaging of atherosclerosis. J Nucl Med
2004;45:1898–907.
4. Bomanji JB, Syed R, Brock C, Jankowska P, Dogan A, Costa
DC, et al. Challenging cases and diagnostic dilemmas: case 2.
Pitfalls of positron emission tomography for assessing
residual mediastinal mass after chemotherapy for Hodgkin’s
disease. J Clin Oncol 2002;20:3347–9.
5. Kjaer A, Lebech AM, Eigtved A, et al. Fever of unknown
origin: prospective comparison of diagnostic value of 18F-
FDG PET and 111ln-granulocyte scintigraphy. Eur J Nucl
Med Mol Imaging 2004;31:622–6.
6. Bomanji JB, Costa DC, Ell PJ. The clinical role of positron
emission tomography. The Lancet Oncology 2001;3:157–64.
7. Rees J, Hain, Johnson N, Hughes, Costa DC, Ell PJ. The role
of fluorodeoxyglucose positron emission tomography scan-
ning in the diagnosis of paraneoplastic neurological disorders.
Brain 2001;124:2223–31.
8. Le Rest C, Bomanji JB, Costa DC, Townsend CE, Visvikis D,
Ell PJ. Functional imaging of malignant paragangliomas and
carcinoid tumours. Eur J Nucl Med 2001;38:478–82.
9. Antoch G, Vogt FM, Freudenberg LS, Nazaradeh F, Goehde
SC, Barkhausen J, et al. Whole-body dual-modality PET/CT
and whole-body MRI for tumor staging in oncology. JAMA
2003;290:3199–206.
10. Burton C, Ell PJ, Linch D. The role of PET imaging in
lymphoma. Br J Haematol 2004;126:772–84.
11. Hillner BE, Tunuguntla R, Fratkin M. Clinical decisions
associated with positron emission tomography in a prospec-
tive cohort of patients with suspected or known cancer at one
United States center. J Clin Oncol 2004;22:4147–56.
12. Hutchings M, Eigtved AI, Specht L. FDG-PET in the clinical
management of Hodgkin’s lymphoma. Crit Rev Oncol/
Hematol 2004;52:19–32.
13. Hart DP, Avivi I, Thomson KJ, Peggs KS, Morris EC,
Goldstone AH, et al. Use of 18F-FDG positron emission
tomography following allogeneic transplantation to guide
adoptive immunotherapy with donor lymphocyte infusions.
Br J Haematol 2005;128:824–9.
14. Lardinois D, Weder W, Hany TF, Kamel EM, Korom S,
Seifert B, et al. Staging of non-small-cell lung cancer with
integrated positron-emission tomography and computed
tomography. N Engl J Med 2003;348:2500–7.
15. van Tinteren H, Hoekstra OS, Smit EF, van den Bergh JH,
Schreurs AJ, Stallaert RA, et al. Effectiveness of positron
emission tomography in the preoperative assessment of
patients with suspected non-small-cell lung cancer: the
PLUS multicentre randomised trial. Lancet 2002;359:1388–
93.
16. Verboom P, van Tinteren H, Hoekstra OS, Smit EF, van den
Bergh HAM, Schreurs AJM, et al, and the PLUS study
group. Cost-effectiveness of FDG-PET in staging non-small
cell lung cancer: the PLUS study. Eur J Nucl Med Mol
Imaging 2003;30:1444–9.
17. Keidar Z, Haim N, Guralnik L, et al. PET/CT using 18-FDG
in suspected lung cancer recurrence: diagnostic value and
impact on patient management. J Nucl Med 2004;45:1640–6.
18. Goren HJM, Slijfer DTh, deVries EGE. Positron emission
tomography, computerized tomography, and endoscopic
ultrasound with needle aspiration of lung cancer. ASCO
Educational Book 2005:579–86.
19. Arulampalam THA, Costa DC, Loizidou M, Visvikis D, Ell
PJ, Taylor I. Positron emission tomography in colorectal
cancer. Br J Surg 2001;88:176–89.
20. Arulampalam THA, Francis DL, Visvikis D, Taylor I, Ell PJ.
FDG-PET for the pre-operative staging of colorectal liver
metastases. Eur J Surg Oncol 2004;30:286–91.
21. Huebner RH, Park KC, Shepherd JE, Schwimmer J, Czernin
J, Phelps ME, et al. A meta-analysis of the literature for
whole-body FDG PET detection of recurrent colorectal
cancer. J Nucl Med 2000;41:1177–89.
22. Dietlein M, Weber W, Schwaiger M, Schicha H. [18F-
Fluorodeoxyglucose positron emission tomography in resta-
ging of colorectal cancer. Nuklearmedizin 2003;42:145–56.
23. Hyde NC, Prvulovich E, Newman L, Waddington WA,
Visvikis D, Ell PJ. A new approach to pre-treatment
assessment of the NO neck in oral squamous cell carcinoma:
the role of sentinel node biopsy and positron emission
tomography. Oral Oncol 2003;29:350–60.
24. Myers LL, Wax MK, Nabi H, Simpson GT, Lamonica D.
Positron emission tomography in the evaluation of the N0
neck. Laryngoscope 1998;108:232–6.
25. Hughes SJ, Prvulovich EM, Witherow H, Kalavrezos N, Ell
PJ. A comparison of FDG PET/CT and MRI versus
histology for staging of primary head and neck cancers
and detection of recurrent disease. J Nucl Med
2004;45:80.
26. Chung JK, So Y, Lee JS, Choi CW, Lim SM, Lee DS, et al.
Value of FDG PET in papillary thyroid carcinoma
with negative 131I whole-body scan. J Nucl Med
1999;40:986–92.
27. Schluter B, Bohuslavizki KH, Beyer W, Plotkin M, Buchert
R, Clausen M. Impact of FDG PET on patients with
differentiated thyroid cancer who present with elevated
thyroglobulin and negative 131I scan. J Nucl Med
2001;42:71–6.
28. Weber WA, Ott K, Becker K, Dittler HJ, Helmberger H,
Avril NE, et al. Prediction of response to preoperative
chemotherapy in adenocarcinomas of the esophago-
gastric junction by metabolic imaging. J Clin Oncol
2001;19:3058–65.
29. Brucher BL, Weber W, Bauer M, Fink U, Avril N, Stein HJ,
et al. Neoadjuvant therapy of esophageal squamous cell
carcinoma: response evaluation by positron emission tomo-
graphy. Ann Surg 2001;233:300–9.
30. Hoekstra OS, Ossenkoppele GJ, Golding R, van Lingen A,
Visser GW, Teule GJ, et al. Early treatment response in
malignant lymphoma, as determined by planar fluorine-18-
fluorodeoxyglucose scintigraphy. J Nucl Med 1993;34:1706–10.
31. Oliver T, Shamash J, Powles T, Somassundram U, Ell PJ. 20
years phase K study of single agent carboplatin in metastatic
seminoma: could it have been accelerated by 72 hour PET
scan response? ASCO, New Orleans, June 2004.
32. Brugarolas J, Clark JW, Chabner B. Using ‘‘rationally
designed drugs’’ rationally. Lancet 2003;361:1758–9.
33. Francis DL, Visvikis D, Costa DC, Croasdale I,
Arulampalam TH, Luthra SK, et al. Assessment of recurrent
colorectal cancer following 5-fluorouracil chemotherapy using
both 18FDG and 18FLT PET. Eur J Nucl Med Mol Imaging
2004;31:928.
34. Francis DL, Freeman A, Visvikis D, Costa DC, Luthra SK,
Novelli M, et al. In vivo imaging of cellular proferation in
colorectal cancer using Positron Emission Tomography. Gut
2003;52:1602–6.
PET/CT to improve patient management
35The British Journal of Radiology, January 2006](https://image.slidesharecdn.com/026britishjournalofradiology-britishinstituteofradiology-2006-130913065550-phpapp02/75/British-Journal-of-Radiology-British-Institute-of-Radiology-2006-eng-39-2048.jpg)
![35. Francis DL, Visvikis D, Costa DC, Arulampalam THA,
Townsend C, Luthra I, et al. Potential impact of [18F]39-
deoxy-39-fluorothymidine versus [18F] fluoro-2-deoxy-D-glu-
cose in Postron Emission Tomography for colorectal cancer.
Eur J Nucl Med 2003;30:988–94.
36. Shields AF, Grierson JR, Dohmen BM, et al. Imaging in vivo
proliferation with 18FLT and positron emission tomography.
Nature Med 1998;11:1334–6.
37. Eary JF, Brenner W, Vernon C, and O’Sullivan F. Tumor
heterogeneity in sarcoma patients is a significant predictor of
survival. Eur J Nucl Med Mol Imaging 2004;31 Suppl.
2:S232.
38. Dehdashti F, Flanagan FL, Mortimer JE, Katzenellenbogen
JA, Welch MJ, Siegel BA. Positron emission tomographic
assessment of ‘‘metabolic flare’’ to predict response of
metastatic breast cancer to antiestrogen therapy. Eur J Nucl
Med 1999;26:51–6.
39. Strauss LG. Fluorine-18-deoxyglucose and false-positive
results: a major problem in the diagnostics of oncological
patients. Eur J Nucl Med 1996;23:1409–15.
40. MacManus MP, Hicks RJ, Matthew JP, et al. Positron
emission tomography is superior to computed tomography
scanning for response-assessment after radical radiotherapy
or chemotherapy in patients with non-small-call lung cancer.
J Clin Oncol 2003;21:1285–92.
41. Scarfone C, Lavely WC, Cmelak AJ, Delbeke D, Martin WH,
Billheimer D, et al. Prospective feasibility trial of radiotherapy
target definition for head and neck cancer using 3-dimentional
PET and CT imaging. J Nucl Med 2004;45:543–52.
42. Schirrmeister H, Guhlmann A, Kotzerke J, Santjohanser C,
Kuhn T, Kreienberg R, et al. Early detection and accurate
description of extent of metastatic bone disease in breast
cancer with fluoride ion and positron emission tomography.
J Clin Oncol 1999;17:2381–9.
43. Cook GJ, Houston S, Rubens R, Maisey MN, Fogelman I.
Detection of bone metastases in breast cancer by 18FDG
PET: differing metabolic activity in osteoblastic and osteolytic
lesions. J Clin Oncol 1998;16:3375–9.
44. Gayed I, Vu T, Johnson M, Macapinlac H, Podoloff D.
Comparison of bone and 2-deoxy-2-[18F]fluoro-D-glucose
positron emission tomography in the evaluation of bony
metastases in lung cancer. Mol Imaging Biol 2003;5:26–31.
45. Schuetze SM, Eary JF, Griffith KA, Rubin BP, Hawkins DS,
Vernon CB, et al. FDG PET but not RECIST agrees with
histological response of soft tissue sarcoma to neoadjuvant
chemotherapy. ASCO 2005.
P J Ell
36 The British Journal of Radiology, January 2006](https://image.slidesharecdn.com/026britishjournalofradiology-britishinstituteofradiology-2006-130913065550-phpapp02/75/British-Journal-of-Radiology-British-Institute-of-Radiology-2006-eng-40-2048.jpg)
![Mesenteric panniculitis in oncologic patients: PET-CT findings
1,2,3
R ZISSIN, MD, 1,3
U METSER, MD, 4
D HAIN, MD and 1,3
E EVEN-SAPIR, MD, PhD
1
Department of Nuclear Medicine, Tel-Aviv Sourasky Medical Center, and the 2
Department of Diagnostic Imaging, Sapir
Medical Center, Kfar Saba, both affiliated to the 3
Sackler Faculty of Medicine, Tel-Aviv University, Tel-Aviv, and
4
Nuclear Medicine Institute, Shaare Zedek Medical Center, Jerusalem, Israel
Abstract. The aim of this study is to assess the role of PET/CT in differentiating between mesenteric panniculitis
(MP) and co-existing MP and mesenteric tumoural involvement. A total of 33 PET/CT examinations, of 19
oncologic patients (16 men and three women with ages ranging from 48 years to 83 years) with findings of MP
on the CT part of the study were retrospectively reviewed. The FDG uptake in mesenteric nodules was
recorded. The final diagnosis of malignant mesenteric involvement was based on clinical and imaging follow-up.
Based on the FDG uptake in mesenteric nodules, patients were categorized as group A: increased mesenteric
uptake (n58) and group B: no mesenteric uptake (n511). In seven of the eight patients in group A, a co-existing
MP and mesenteric tumour involvement was found: one patient had a recurrent cervical carcinoma and the
other six patients had lymphoma. In four of these six patients, the positive PET findings disappeared on follow-
up PET/CT with complete remission while the CT findings of the MP remained unchanged. In the other two,
the PET findings progressed along with clinical deterioration. In the last patient of group A, with rectal
carcinoma without evidence of recurrence, the mesenteric FDG uptake was a false positive uptake. In all 11
patients with CT findings of MP and negative PET, no malignant involvement of the mesentery was diagnosed.
To conclude, a negative PET has a high diagnostic accuracy in excluding tumoural mesenteric involvement
while increased uptake suggests the co-existing of mesenteric deposits, particularly in patients with lymphoma.
Mesenteric panniculitis (MP), also entitled liposclerotic
mesenteritis, mesenteric lipodystrophy, mesenteric lipoma-
tosis and lipogranuloma of the mesentery, is a benign
condition characterized by non-specific inflammation
involving the adipose tissue of the mesentery, with acute
inflammatory changes and fat necrosis being the pre-
dominant histological findings. In its chronic phase when
fibrosis is dominant, the disease is known as retractile
mesenteritis [1–4]. Sclerosing mesenteritis seems the most
appropriate diagnostic term of this entity, characterized by
a spectrum of histological findings [4]. The specific aetiology
of the disease is unknown, although various causes have been
suggested, including infection, trauma or ischaemia of the
mesentery. The disease has been related to other pathological
processes such as vasculitis, granulomatous disease, pancrea-
titis and malignancy [2]. Its prevalence in abdominal CT
examinations is approximately 0.6%, commonly appearing
as an incidental finding, mostly in middle or late adulthood
[5]. An association between MP and pre-existing malignancy
has been reported [5, 6].
The CT features of MP are well recognized and may
suggest the diagnosis, but they are non-specific and can
appear in other conditions such as mesenteric oedema,
granulomatous diseases, primary or secondary abdominal
neoplasms and lymphoma [1]. In cases of MP and known
intra-abdominal malignancies, differentiating MP from
tumoural involvement of mesenteric lymph nodes (LNs) is
of crucial importance.
18
F-Fluorodeoxyglucose (FDG)/PET imaging has been
introduced in addition to conventional cross-sectional
imaging methods in the routine practice of oncologic
patients. Recently, hybrid systems composed of PET and
CT have been introduced and its use is increasing steadily
[7]. PET and CT are performed at the same clinical setting
resulting with generation of fused PET/CT images, which
provides both functional and anatomical data. The
potential role of PET/CT in differentiating benign MP
from tumoural mesenteric involvement is the topic of the
current study. We have reviewed 19 patients with a history
of known malignancy, who had incidental MP on the CT
component of the PET/CT study, and report the PET/CT
features of MP in this oncologic population.
Material and methods
The clinical data and PET/CT findings of 19 consecutive
patients with MP incidentally diagnosed on the CT part of
the study were retrospectively reviewed. The patient group
consisted of 16 men and 3 women with ages ranging from
48 years to 83 years (mean age 62¡11 years). Five of the
19 patients underwent a PET/CT study for staging and 14
for suspected recurrence or for monitoring response to
treatment. Known malignancies included lymphoma
(n510), colorectal cancer (n55), melanoma (n52) and
lung and cervical carcinomas, one patient each. A total of
33 PET/CT examinations were performed and reviewed in
these 19 patients as 11 of them had one to three follow-up
(F/U) studies.
The patients fasted at least 4 h prior to the intravenous
(IV) injection of 370–666 MBq (10–18 mCi) FDG.
Iodinated oral contrast material was administered prior
to FDG injection. Glucose levels had been checked prior
to the injection of FDG. A PET/CT study was performed
only when blood glucose levels were bellow 8.32 mmo l21
.
Scanning from the base of the skull through the mid-thigh
Received 17 March 2005 and in final form 3 May 2005, accepted 1 June
2005.
Address correspondence to: Einat Even-Sapir, Department of Nuclear
Medicine, Tel-Aviv Sourasky Medical Center, 6 Weizman Street, Tel-
Aviv, 64239 Israel.
The British Journal of Radiology, 79 (2006), 37–43 E 2006 The British Institute of Radiology
DOI: 10.1259/bjr/29320216
37The British Journal of Radiology, January 2006](https://image.slidesharecdn.com/026britishjournalofradiology-britishinstituteofradiology-2006-130913065550-phpapp02/75/British-Journal-of-Radiology-British-Institute-of-Radiology-2006-eng-41-2048.jpg)
![was performed using the Discovery LS PET/CT system
(GE Medical Systems, Milwaukee, WI). Low-dose CT
acquisition was performed first with 140 kV, 80 mA, 0.8 s
per CT rotation, a pitch of 6 and a table speed of
22.5 mm s21
, without any specific breath-holding instruc-
tions. A PET emission scan was carried out immediately
following acquisition of the CT, without changing the
patient’s position. From 5 to 8 bed positions were
performed with an acquisition time of 5 min for each
one. CT data were used for attenuation correction. Images
were generated and interpreted on work station (Xeleris
Elgems, Haifa, Israel) equipped with fusion software that
enables the display of PET, CT and fused PET/CT images.
The CT criteria for the diagnosis of MP included a well-
defined, inhomogeneous fatty mass with higher attenua-
tion than the normal retroperitoneal fat, occasionally with
preserved perivascular fat, that contained small nodules
and surrounded by a tumoural pseudocapsule (Figure 1)
[5]. When interpreting the PET/CT, the uptake of FDG in
the mesenteric nodules was reported. Standardized uptake
value (SUV) was measured for any focal increased uptake
within the CT mesenteric abnormalities. The latter
semiquantitative parameter was automatically obtained
on the patient’s final report and was calculated as the ratio
of activity in tissue per millilitre to the activity in the
injected dose per patient body weight. The final diagnosis
of the mesenteric pathology was based on clinical and
imaging (PET/CT and/or diagnostic CT) F/U: co-existing
MP and malignancy was concluded when improvement or
disappearance of the mesenteric abnormalities were seen
on F/U imaging together with clinical evidence of a
favourable response to therapy, or when mesenteric
abnormalities progression was seen on F/U imaging
along with clinical and imaging evidence of disease
progression. The MP was regarded as benign if the
mesenteric findings remained stable in a patient who was
clinically disease-free or if the findings remained stable on
F/U imaging while other sites of disease resolved in
response to therapy and the patient was clinically
considered in complete remission.
Results
Based on the FDG uptake within the MP, the study
patients were divided into two groups: group A consisting
of eight patients with MP and focal increased FDG uptake
within mesenteric nodules and group B consisting of 11
patients with MP without increased FDG uptake.
Group A: FDG uptake within MP
FDG uptake was demonstrated within CT mesenteric
abnormalities, indistinguishable from a benign MP, in
eight patients. The clinical and imaging findings of these
patients are summarized in Table 1. A conclusion of
malignant mesenteric involvement was made in seven of
these patients, one with a metastatic cervical cancer and
six with non-Hodgkin’s lymphoma (NHL): In four
lymphoma patients both the increased FDG uptake and
the nodules themselves resolved following chemotherapy,
while other CT findings of MP remained unchanged on
F/U PET/CT (Figure 2). In the other two, clinical F/U and
repeat PET/CT were consistent with tumour progression
(Figure 3). In the case of metastatic cervical carcinoma
new mesenteric PET findings appeared within known MP,
seen previously on two PET/CT studies, along with clinical
evidence of tumour recurrence. In coexisting MP and
mesenteric tumoural involvement, the MP changes, seen
on the CT part of the examination, which were not
associated with increased FDG uptake, remained
unchanged on F/U PET/CT studies.
In the remaining patient with rectal cancer and focal
mesenteric FDG uptake (SUV – 3.5) the positive PET was
regarded as a false positive study as there was no clinical
or imaging evidence of active tumour, together with
stability of the MP findings on F/U diagnostic CT studies
during a long disease-free period of 28 months.
Group B: MP without increased FDG uptake
In 11 patients no FDG uptake was seen within typical
features of MP. The mesenteric soft-tissue nodes ranged
between immeasurable, numerous small nodules, to
discrete nodes measuring up to 0.9 cm in the short axis
and 1.9 cm in the long axis (Figure 4). In all these patients
the mesenteric abnormalities seen on the CT part of the
study were stable on imaging F/U of a mean of 10.5
months (range: 5–30 months) and we therefore believe that
the mesenteric findings were benign.
Discussion
MP is a non-neoplastic inflammatory process of
unknown aetiology, affecting the small bowel mesentery.
It was rarely diagnosed before the era of ultrasound and
CT, but currently it is not uncommonly encountered, often
as an incidental imaging finding. Male predominance, as
was found in our group, has been previously reported [1–3]
though a slight female predominance has been reported
in ?a single publication [5]. Most cases of MP are
Figure 1. CT findings of mesenteric panniculitis (MP). Non-
enhanced abdominal CT at the mid-abdomen shows a well-
defined, inhomogeneous fatty lesion, with higher attenuation
than the normal retroperitoneal fat, confined by a highly-
attenuated stripe representing a tumoural pseudocapsule (thick
arrows), with an engorged mesenteric vessel and scattered dis-
crete nodules of soft-tissue density, some of which are engulfed
by a hypodense fatty halo (thin arrow).
R Zissin, U Metser, D Hain and E Even-Sapir
38 The British Journal of Radiology, January 2006](https://image.slidesharecdn.com/026britishjournalofradiology-britishinstituteofradiology-2006-130913065550-phpapp02/75/British-Journal-of-Radiology-British-Institute-of-Radiology-2006-eng-42-2048.jpg)

![asymptomatic and are incidentally detected on abdominal
CT performed for unrelated conditions [5]. On CT, MP
appears as a mass of increased-attenuation mesenteric fat
containing small soft-tissue nodes, with a maximal
transverse diameter directed toward the left abdomen
consistent with the orientation of the jejunal mesentery.
The infiltrated fat typically engulfs the mesenteric vessels
and displaces adjacent bowel loops without invading them
[1, 2, 5]. Hypodense, cystic-like areas and calcifications due
to fat necrosis are infrequently seen within this mass [1].
Increased fatty attenuation and small mesenteric nodules,
also termed ‘‘misty mesentery’’ may, however, be seen in
any pathological process infiltrating the mesentery, such as
inflammation, oedema, haemorrhage or metastases [8].
Two CT findings are considered more specific for the
diagnosis of MP as they have not been reported in other
mesenteric diseases: the presence of tumoural pseudocap-
sule (found in up to 60% of MP cases) and the ‘‘fat ring’’
sign of hypodense fatty halo surrounding mesenteric
nodules and vessels (seen in up to 75% of cases) [1, 2,
4]. Daskalogianki et al have reported the co-existence of
MP and various neoplastic diseases, especially lymphoma
and gastrointestinal and urogenital adenocarcinomas, in
up to 69% of patients with MP [5]. 10 of the 19 study
patients with CT findings of MP had lymphoma as the
underlying malignancy. Co-existing MP with malignant
mesenteric involvement was found in six of the lymphoma
patient (60%), representing 85.7% of the 7 study patients
with malignant mesenteric involvement. In oncologic
patients, therefore, the small soft-tissue mesenteric nodules
typically seen within the infiltrated mesenteric fat of MP
may be misdiagnosed as metastatic implants. On the other
hand, metastatic deposits within a pre-existing MP can
also be present, as was described in a single case report on
a patient with uterine papillary serous adenocarcinoma in
whom multiple nodular metastases were detected on CT
within typical MP findings [9].
The results of our study emphasise the potential role of
PET/CT in differentiating benign MP and MP with
mesenteric tumoural involvement. Fused PET/CT images
provide both metabolic and anatomic information with a
high accuracy. On CT, lymph node pathology is based on
size criteria alone. Enlarged lymph nodes may be reactive
while normal-sized nodes may contain early metastatic
deposits, which can be reliably detected by the functional
(PET) part of the study.
The majority of our patients, including those with a
malignant mesenteric involvement, had only subtle CT
findings and the differentiation between benign and
malignant causes could not be made with confidence
based on the CT alone. Our results suggest a potential role
for integrated PET/CT in the assessment of MP detected
on CT in oncologic patients. PET/CT study can be used to
correctly exclude mesenteric tumoural involvement when
no FDG uptake is seen within typical CT features of MP.
Alternatively, in a patient with an oncologic history, the
demonstration of FDG uptake, even in small-sized nodules
within characteristic CT findings of MP, is highly
suggestive of neoplastic involvement of the mesentery. In
PET/CTs of co-existing MP and mesenteric metastatic
deposits, the increased FDG uptake was detected in
nodules smaller than the benign nodules of the MP that
had no increased uptake. The increased FDG uptake of
these malignant mesenteric deposits resolved on a F/U
study following a favourable response to treatment while
the findings of the benign MP remained unchanged.
Increased FDG uptake is, however, not tumour-specific as
FDG uptake may be seen in benign inflammatory
conditions [10], as was the case in one of our patients in
whom a slightly increased FDG uptake was detected
within MP findings without evidence of malignancy on a
long-term F/U of 28 months. As the most consistent
histological finding of MP is the presence of an
inflammatory infiltrate, it may explain the uptake in that
7. F, 56 Metastatic
cervical
carcinoma
Monitoring response
to treatment.
- No baseline study
CT: increased-attenuation fat,
pseudocapsule and numerous,
slightly enlarged soft-tissue
nodules
Co-existing MP and metastases
PET: negative F/U PET/CT (11 M later): no
change
F/U PET/CT (after 5 M): disease
progression with a new
1.7 cm60.9 cm mesenteric
nodule with FDG uptake
(SUV – 5.7)
No change in other MP findings
8. F, 55 Rectal
carcinoma
Misty mesentery
on a diagnostic CT,
performed for F/U,
negative markers
CT: increased-attenuation fat,
pseudocapsule and numerous,
enlarged LNs up to
1.4 cm62.5 cm
No clinical evidence for active
disease: A false positive PET
PET: uptake (SUV – 3.5) in 3
small mesenteric nodules.
No uptake in the enlarged
nodes
- No change in the MP findings
in a previous CT study, 2 years
earlier and in a F/U diagnostic
CT after 4 M, negative markers
F/U, follow-up; M, months; LN, lymph node.
Table 1. (Cont.) Clinical, PET/CT and F/U of eight patients with CT findings of mesenteric panniculitis (MP) and increased FDG
uptake within mesenteric nodules
Patient no., sex,
age (years)
Primary
tumour
Indication for
the 1st PET/CT
PET/CT findings
(on the 1st study)
Final diagnosis and
imaging F/U
R Zissin, U Metser, D Hain and E Even-Sapir
40 The British Journal of Radiology, January 2006](https://image.slidesharecdn.com/026britishjournalofradiology-britishinstituteofradiology-2006-130913065550-phpapp02/75/British-Journal-of-Radiology-British-Institute-of-Radiology-2006-eng-44-2048.jpg)


![case [4]. We have found a single case report in the English
literature regarding the FDG/PET in a patient with sclerosing
mesenteritis; a large, speculated, soft-tissue mesenteric mass
showed peripheral increased FDG uptake, probably repre-
senting the peripheral high metabolic inflammation and
inactive central area of fibrosis [11].
The limitations of our study are the relatively small
number of patients and the lack of a pathological proof
for all lesions. However, as often happens in tumour
imaging, not all detected lesions have histological diag-
nosis and their nature is sometimes based on clinical and
imaging F/U. Validation of our findings in larger patient
groups is warranted.
To conclude, if MP is suspected on the CT part of
the PET/CT study, special attention should be paid to the
18
F-FDG-avidity of the findings. A negative PET has high
diagnostic accuracy in excluding tumoural mesenteric
involvement while increased uptake may suggest the co-
existing of metastatic deposits, particularly in patients with
lymphoma.
Acknowledgments
The authors wish to thank Mrs Limor Zuriel, MSc, for
her assistance in the preparation of the manuscript.
References
1. Horton KM, Lawler LP, Fishman EK. CT findings in
sclerosing mesenteritis (panniculitis): spectrum of disease.
Radiographics 2003;23:1561–7.
2. Sabate JM, Torrubia S, Maideu J, Franquet T, Monill JM,
Perez C. Sclerosing mesenteritis: imaging findings in 17
patients. AJR Am J Roentgenol 1999;172:625–9.
3. Parra-Davila E, McKenney MG, Sleeman D, Hartmann R,
Rao RK, McKenney K, Compton RP. Mesenteric pannicu-
litis: case report and literature review. Am J Surg
1998;64:768–71.
4. Emory TS, Monihan JM, Carr NJ, Sobin LH. Sclerosing
mesenteritis, mesenteric panniculitis and mesenteric lipody-
strophy: a single entity? Am J Surg Pathol 1997;21:392–8.
5. Daskalogiannaki M, Voloudaki A, Prassopoulos P,
Magkanas E, Stefanaki K, Apostolaki E, et al. CT evaluation
of mesenteric panniculitis: prevalence and associated diseases.
AJR Am J Roentgenol 2000;174:427–31.
6. Kipfer RE, Moertel CG, Dahlin DC. Mesenteric lypodystro-
phy. Ann Intern Med 1974;80:582–8.
7. Schoder H, Larson SM, Yeung HW. PET/CT in oncology:
integration into clinical management of lymphoma, mela-
noma, and gastrointestinal malignancies. J Nucl Med. 2004;45
Suppl. 1:72S–81S.
8. Mindelzun RE, Jeffrey RB Jr, Lane MJ, Silverman PM. The
misty mesentery on CT: differential diagnosis. AJR Am J
Roentgenol 1996;167:61–5.
9. La Fianza A, Alberici E, Di Maggio EM, Preda L, Campani
R. Multiple nodular metastases in mesenteric panniculitis by
uterine papillary serous adenocarcinoma [UPSC]: CT appear-
ance of a case. Clin Imaging 1999;23:90–3.
10. Kazama T, Faria SC, Varavithya V, Phongkitkarun S, Ito H,
Macapinlac HA. FDG PET in the evaluation of treatment for
lymphoma: clinical usefulness and pitfalls. Radiographics
2005;25:191–207.
11. Nguyen BD. F-18 FDG PET demonstration of sclerosing
mesenteritis. Clin Nucl Med 2003;28:670–1.
Figure 4. A 78-year-old man with diffuse B cell lymphoma
and co-existing mesenteric panniculitis (MP). A fused PET/CT
image shows typical findings of MP, including inhomogeneous
fatty density mass with well-defined nodules of soft-tissue den-
sity, confined by a pseudocapsule (arrows), without 18
F-FDG
uptake. The findings remain stable on a F/U PET/CT, 5 months
later, with no clinical evidence of active lymphoma.
PET-CT finding of mesenteric panniculitis
43The British Journal of Radiology, January 2006](https://image.slidesharecdn.com/026britishjournalofradiology-britishinstituteofradiology-2006-130913065550-phpapp02/75/British-Journal-of-Radiology-British-Institute-of-Radiology-2006-eng-47-2048.jpg)
![Diagnostic efficacy of SonoVueH, a second generation
contrast agent, in the assessment of extracranial carotid or
peripheral arteries using colour and spectral Doppler
ultrasound: a multicentre study
1
P S SIDHU, FRCR, 2
P L ALLAN, FRCR, 3
F CATTIN, MD, 4
D O COSGROVE, FRCR, 5
A H DAVIES, MD,
6
D D DO, MD, 7
S KARAKAGIL, MD, 8
J LANGHOLZ, MD, 9
D A LEGEMATE, MD, PhD,
10
A MARTEGANI, MD, 11
J-B LLULL, MD, 12
C PEZZOLI, PhD and 11
A SPINAZZI, MD
1
Department of Radiology, King’s College Hospital, Denmark Hill, London SE5 9RS, UK, 2
Department of Radiology,
Edinburgh Royal Infirmary, Edinburgh, Lothian, UK, 3
CHU de Besancon, Service de Radiologie B, Boulevard Fleming,
F-25030 Besancon, Belgium, 4
Department of Imaging, Royal Postgraduate Medical School, Hammersmith Hospitals
Trust, Du Cane Road, London W12 OHS, UK, 5
Department of Surgery, Imperial College School of Science, Technology
& Medicine, Charing Cross Hospital, Fulham Palace Road, London W6 8RP, UK, 6
Inselspital-Division of Angiology,
Department of Internal Medicine, University of Berne, Freiburgstarsse 10, 3010 Berne, Switzerland, 7
Department of
Surgery, Uppsala University Hospital, Akademiska sjukhuset, 75185 Uppsala, Sweden, 8
Schwerpunktpraxis fu¨r
Angiologie, Wilsnacker Strabe 14, 10559, Berlin, Germany, 9
Department of Vascular Surgery, Academic Medical Centre,
Meibergdreef 9, NL-1105 AC DE Amsterdam, The Netherlands, 10
Servizio di Radiologia, Ospedale Valduce, Via Dante
Alighieri, 11, 22100 Como, Italy, 11
Bracco Diagnostics Inc., 107 College Road East Princeton, Princeton, NJ 08540,
USA and 12
Bracco Imaging SpA, Via E. Folli 50, 20134 Milan, Italy
Abstract. The purpose of this study was to demonstrate the improvement in diagnostic quality and diagnostic
accuracy of SonoVueH microbubble contrast-enhanced ultrasound (CE-US) versus unenhanced ultrasound
imaging during the investigation of extracranial carotid or peripheral arteries. 82 patients with suspected
extracranial carotid or peripheral arterial disease received four SonoVue doses (0.3 ml, 0.6 ml, 1.2 ml and
2.4 ml) with Doppler ultrasound performed before and following each dose. Diagnostic quality of the CE-US
examinations was evaluated off-site for duration of clinically useful contrast enhancement, artefact effects and
percentage of examinations converted from non-diagnostic to diagnostic. Accuracy, sensitivity and specificity
were assessed as agreement of CE-US diagnosis evaluated by an independent panel of experts with reference
standard modality. The median duration of clinically useful signal enhancement significantly increased with
increasing SonoVue doses (p¡0.002). At the dose of 2.4 ml of SonoVue, diagnostic quality evaluated as number
of inconclusive examinations significantly improved, falling from 40.7% at baseline down to 5.1%. Furthermore,
SonoVue significantly (p,0.01) increased the accuracy, sensitivity and specificity of assessment of disease
compared with baseline ultrasound. SonoVue increases the diagnostic quality of Doppler images and improves
the accuracy of both spectral and colour Doppler examinations of extracranial carotid or peripheral arterial
disease.
Colour and spectral Doppler ultrasound examination of
the peripheral [1, 2] and extracranial carotid [3, 4] arterial
systems is a well established non-invasive method of
assessment of arterial disease. Frequently, Doppler
ultrasound replaces conventional angiography with the
associated cost savings and reduction in patient morbidity
[5–8]. However, Doppler ultrasound does not always
provide a full diagnostic assessment and there is no
alternative but to seek confirmatory evidence of arterial
disease with conventional angiography and increasingly
with helical CT angiography and MR angiography [9–12].
A number of factors preclude a full Doppler ultrasound
examination of a vessel: heavily calcified plaque causes
acoustic shadowing, a deep-seated artery returns a poor
echo-signal and vessel tortuosity precludes a satisfactory
Doppler angle for accurate velocity measurements. In
order to improve the diagnostic capability of a Doppler
ultrasound examination of the peripheral and carotid
arteries, introducing an echo-enhancing agent would be
expected to facilitate visualization of difficult arteries, thus
overcoming inherent problems associated with ultrasound,
and ultimately reducing unnecessary invasive and expen-
sive diagnostic procedures.
SonoVueH is the trademark name of a new ultrasound
contrast agent (BR1, Bracco, Italy) [13]. SonoVue is a
suspension of phospholipid stabilized sulphur hexafluoride
(SF6) microbubbles. When reconstituted with normal
saline the product is stable at room temperature for
several days, but should be used after reconstitution within
6 h as the product contains no preservative [14].
Reconstitution produces a high microbubble concentration
(up to 5 6 108
microbubbles ml21
), a favourable size (90%
of microbubbles smaller than 8.0 mm, mean diameter
2.5 mm) and strong echogenicity over the range ofReceived 6 May 2005 and accepted 9 June 2005.
The British Journal of Radiology, 79 (2006), 44–51 E 2006 The British Institute of Radiology
DOI: 10.1259/bjr/23954854
44 The British Journal of Radiology, January 2006](https://image.slidesharecdn.com/026britishjournalofradiology-britishinstituteofradiology-2006-130913065550-phpapp02/75/British-Journal-of-Radiology-British-Institute-of-Radiology-2006-eng-48-2048.jpg)
![frequencies used in medical ultrasound examinations [15].
The microbubbles produced are not trapped in the
capillary vasculature, and the use of SF6 (an innocuous
gas) renders the microbubbles more resistant to pressure
increases from the left ventricle of the heart, increas-
ing microbubble survival. SonoVue demonstrates a
maximum backscatter coefficient at about 3 MHz and
an elimination half-life of approximately 6 min. More
than 80% of the compound is exhaled via the lungs
in 11 min [16].
The efficacy of SonoVue in extracranial carotid or
peripheral arterial disease was evaluated in a multicentre
study where the quality end-points were as follows: to
ascertain the optimal dosage with regard to global quality
of images, to assess the duration of microbubble contrast
effect, to aid the interpretation of diagnostically difficult
colour and spectral Doppler ultrasound examinations and
to evaluate the potential of contrast-enhanced ultrasound
(CE-US) to change a non-diagnostic ultrasound examina-
tion into a diagnostic examination. In a subset study
population, the diagnostic accuracy, sensitivity and
specificity of SonoVue enhanced Doppler investigations
were evaluated in terms of agreement of CE-US examina-
tions in comparison with other recognized diagnostic
imaging modalities.
Material and methods
The overall study consisting of two (study A and B)
parallel multicentre studies was aimed at investigating,
with Doppler ultrasound and SonoVue, different vascular
territories: renal, abdominal, cerebral, extracranial carotid
or peripheral arteries, and the portal circulation.
We refer here to the results pertaining to extracranial
carotid or peripheral arteries. Local Medical Ethics
Committees granted approval for the study at each
hospital site according to local legal requirements and
the study was conducted in accordance with the
Declaration of Helsinki and European Good Clinical
Practice. All patients recruited gave written informed
consent.
Study population
The study population comprised 82 male and female
patients, over 18 years of age, with a suspected vascular
pathology, referred for Doppler ultrasound investigations
of carotid, iliac, femoral, popliteal or tibial arteries and for
whom the observers could not make an interpretation with
confidence at baseline unenhanced colour and spectral
Doppler ultrasound examination. The main criteria for
patient exclusion from the study were: severe congestive
heart failure (New York Heart Association Class IV);
unstable angina; severe cardiac arrhythmia; recent myo-
cardial infarction; recent organ transplant or unstable
neurological disease. Lactating women or women known
or suspected to be pregnant were excluded. Patients were
also excluded if they were critically ill, medically unstable
or were in an intensive care setting. Patients receiving
another investigational drug within 30 days prior to the
study were not recruited.
Study design
The study was a multicentre, open-label (on-site),
blinded (off-site), randomized, dose-ranging, cross-over
study to compare four different doses of SonoVue (0.3 ml,
0.6 ml, 1.2 ml, and 2.4 ml) in Doppler ultrasound
investigations of extracranial carotid (22 patients) or
peripheral arteries (60 patients). Patients were randomized
to one of four dose sequences, according to a randomiza-
tion schedule with block size 4. The SonoVue doses were
administered as an intravenous bolus injection over 20 s via
a 20 gauge cannula (Introcan-W; Braun Melsungen AG,
Germany) placed in the forearm. All centres employed the
standard ultrasound machine used for routine colour
Doppler ultrasound vascular examinations within the
department. A variety of ultrasound machines were
used, depending on the centre. Once the optimum colour
and spectral Doppler ultrasound parameters were set for
each patient at the baseline examination to extract
maximum information (with the gain turned down to
the lowest informative level), the parameters were
unaltered for the remainder of the CE-US examination.
For each patient, a vessel of interest was designated for
further investigation, based on the vessel that would most
likely drive the patient’s diagnosis. Doppler ultrasound
investigations of the designated vessel were performed at
baseline and after each injection of SonoVue, with Super-
Video Home System (S-VHS) videotape recording of
images beginning 30 s prior to injection and continuing
until the end of the microbubble contrast effect. At each
time point, the designated vessel was studied first with
either colour Doppler ultrasound or power Doppler
ultrasound (only one mode was used for each patient
depending on investigator choice), and then with spectral
Doppler imaging. All SonoVue administration and ima-
ging procedures were completed on the same day. The
interval between administrations of the different doses was
at least 10 min or until disappearance of the microbubble
contrast effect from the previous administration.
Assessments
Four independent experienced readers, paired for each
of the studies (A and B) and unaffiliated with the study
sites performed an off-site assessment of the recorded
ultrasound images. These readers were blinded to study
agent dose (whether baseline or post-dose), and patient
information, including results of other imaging procedures.
The S-VHS videotape recordings were divided into sets
consisting of four post-injection images, one for each of
the four SonoVue injection doses, plus the baseline images.
Within each image set, an assigned random code number
determined the order of presentation of patient images to
the off-site readers. The off-site readers were provided with
the identification of the vessel under investigation for each
video sequence. Following completion of these unpaired
assessments, the baseline and corresponding post-injection
images for each dose of SonoVue in each patient were
then assessed in matched pairs. For patients with an
available reference diagnostic modality (conventional
angiography, MR angiography or CT angiography)
from which a diagnosis could be ascertained (on-site), a
committee of three experienced physicians (Accuracy
Review Committee) unaffiliated with the study sites
Diagnostic efficacy of SonoVue
45The British Journal of Radiology, January 2006](https://image.slidesharecdn.com/026britishjournalofradiology-britishinstituteofradiology-2006-130913065550-phpapp02/75/British-Journal-of-Radiology-British-Institute-of-Radiology-2006-eng-49-2048.jpg)
![compared the diagnosis obtained by the off-site assess-
ments of Doppler ultrasound images with the diagnosis
obtained with the reference modality.
Diagnostic quality
Duration of clinically useful signal enhancement, defined
as the time from appearance until disappearance of a
microbubble contrast effect of sufficient intensity to be
diagnostically or clinically useful, was assessed and
documented by each off-site observer subjectively
during review of the video recordings of the individual
examinations.
Incidence and duration of artefactual microbubble
contrast effects (shadowing, blooming and saturation
effects) were assessed following each dose of SonoVue.
Artefacts were defined as follows: a shadowing effect
appeared as an obscured image and/or Doppler spectrum,
blooming appeared as the presence of colour in an area
without flow, while a saturation effect appeared as a
noisy Doppler spectrum with artificially high velocities
[17]. Duration was evaluated from the actual time of
appearance to the disappearance of shadowing and/or
blooming and/or saturation effects. Each of the artefacts
was evaluated at their maximal effect in accordance
with the following three-point scale: 05no artefactual
effect; 15artefactual effect not compromising the image
analysis; 25artefactual effect compromising the image
analysis.
Assessment of inconclusive Doppler examinations was
performed on each baseline or post-injection video clip
where off-site readers had to assess if a diagnosis was
possible or not and, in patients where it was possible,
make a diagnosis based on a pre-defined check list.
Diagnostic accuracy
Diagnostic accuracy was assessed for baseline and for
the clinically recommended dose of SonoVue only (2.4 ml).
Assessment of agreement was carried out by an
Accuracy Review Committee, based on a comparison of
the diagnosis recorded by each of the off-site blinded
readers from the Doppler ultrasound investigations with
the diagnosis from the reference imaging modality. The
following four-point scale was used: 15full agreement;
25basic agreement (differences in details but leading to
the same diagnostic conclusion); 35partial agreement
(differences in details possibly leading to a different
diagnostic conclusion); 45disagreement.
Sensitivity and specificity
For the evaluation of the diagnostic performance of
SonoVue CE-US in terms of sensitivity and specificity,
it was necessary to further define agreement with the
reference modality in terms of detection/exclusion
(presence/absence) of particular lesions in the investigated
vessels for each study patient. An independent experienced
radiologist, not previously involved in these studies, was
asked to classify the Doppler ultrasound off-site diagnoses
and the reference modality diagnoses according to the
following predetermined list of possible diagnoses for the
designated vessel of interest: (1) no abnormality;
(2) abnormality present: (a) stenosis . 50% or occlusion;
(b) atheromatous plaque; (c) arteriovenous malformation;
(d) aneurysm; (e) vessel displacement/compression due to
extrinsic space-occupying mass; (f) collaterals or collatera-
lization of normal vessels; (g) arterial wall dissection;
(h) other. Sensitivity was defined as the proportion of
patients with a matching abnormality in the vessel of
interest using Doppler ultrasound and patients with an
abnormality in the vessel of interest using the reference
standard. Specificity was defined as the proportion of
patients with no abnormality in the vessel of interest using
Doppler ultrasound and patients with no abnormality in
the vessel of interest using the reference standard.
Statistical methods
Demography
Demographics and other baseline characteristics were
summarized using descriptive statistics.
Efficacy analysis
An analysis of variance (ANOVA) using ranked
durations of clinically useful signal enhancement was
performed to investigate overall differences between doses.
Summary statistics, frequency distributions and cross-
tabulations were elaborated for efficacy parameters, but no
formal statistical analyses were performed. For the
purposes of statistical summaries from the assessment by
the Accuracy Review Committee, these data were further
categorized as follows: agreement denoted full agreement
or basic agreement, and disagreement denoted partial
agreement or disagreement. Individual study results for
diagnostic accuracy were analysed using McNemar’s test
of association between baseline and post-dose in the
proportion of patients for whom agreement was recorded.
For all analyses, a two-sided p-value was used to test for
significance.
Results
Eighty-two patients (study A, n543; study B, n539),
49 male and 33 female subjects, median age of 71 years
(range 41–87 years), with suspected extracranial carotid
artery or peripheral vascular disease were recruited and
received SonoVue for the assessment of diagnostic quality
parameters. The diagnostic accuracy assessment was
performed on 59 patients where final diagnosis made
from a reference imaging modality (conventional angio-
graphy/CT angiography n558 and MR angiography n51)
was available for assessment by the Accuracy Review
Committee.
At Doppler examination 32 of 59 were found positive
and 27 of 59 were negative for the presence of pathology.
Sensitivity and specificity were calculated in the subset
of patients (n546) where the reference standard with the
pathology or no pathology in the vessel of interest was
available for assessment (n522 and 24 patients, respec-
tively, for the two studies).
P S Sidhu, P Allan, F Cattin et al
46 The British Journal of Radiology, January 2006](https://image.slidesharecdn.com/026britishjournalofradiology-britishinstituteofradiology-2006-130913065550-phpapp02/75/British-Journal-of-Radiology-British-Institute-of-Radiology-2006-eng-50-2048.jpg)

![The change in agreement rates from baseline was
statistically significant for three of the four off-site readers
(range p,0.05–0.001). Furthermore, considering the subset
of patients whose investigation was diagnostic and the
reference standard imaging modality available, agreement
between the Doppler ultrasound diagnosis and the
diagnosis from the reference imaging modality further
increased to 72.3% after microbubble contrast adminis-
tration (Figure 3).
Diagnostic performance, in terms of sensitivity and
specificity, was assessed in the subset of patients (n546)
with an abnormality or no abnormality in the vessel of
interest on the available reference gold standard examina-
tions. In study A, in the eight patients with an abnormality
in the carotid/peripheral vessel of interest on the reference
standard modality, the sensitivity increased from 13% pre-
contrast to 75% at the 2.4 ml dose for reader 1 and from
50% to 75% for reader 2 (Table 3).
In the 16 patients with no abnormality on the reference
modality, specificity increased from a pre-contrast value of
0% to 85 % at 2.4 ml for reader 1 and from 31% to 75%
for reader 2. In study B, in the nine patients with an
abnormality on the reference modality, the sensitivity
increased from 89% pre-contrast to 100% at the 2.4 ml
dose for reader 3 and increased from 22% to 67% for
reader 4. In the 13 patients with no abnormality on the
reference modality, specificity increased from a pre-
contrast value of 23% to 46% at 2.4 ml for reader 3 and
from 8% to 85% for reader 4.
Discussion
Failure to obtain a diagnostic colour Doppler ultra-
sound examination of the extracranial carotid and
peripheral arteries is typically a consequence of patient
factors. Rather than abandon the colour Doppler ultra-
sound examination instituting another examination, with
the implications of higher cost, the introduction of a
microbubble contrast agent would enable the examiner to
attempt to establish a conclusive diagnosis and reduce the
amount of time necessary to perform a peripheral arterial
examination. In the present study, a significant dose effect
was observed for the duration of clinically useful signal
enhancement for all four off-site readers; the average
median duration of useful enhancement was of 3.91 min
for the 2.4 ml dose. Due to a conservative approach in the
study design, the incidence and duration of artefactual
microbubble contrast effects also tended to increase with
increasing dose. These artefacts can normally be limited by
reducing the effective sensitivity of the system, by
decreasing the colour or power and spectral Doppler
ultrasound gains. Indeed, in order to maximize Doppler
quality, gain settings for both colour or power and spectral
Doppler ultrasound should be continuously adjusted as
enhancement returns to baseline. However, in this study
the protocol required that the level of the gain for both
colour or power and spectral Doppler be set before the
first injection of microbubble contrast and could not be
modified after that. With gain adjustment, the duration of
artefacts would have been greatly reduced if not
completely eliminated and, as a result, the duration of
clinically useful signal enhancement would have been
increased. Moreover, now there is a tendency to use
infusions rather than bolus injection of microbubble
contrast during the investigation of vascular disease.
This has been demonstrated to further improve the
duration of useful enhancement and reduce artefactual
effects in the extracranial carotid and peripheral arteries
[18], in transcranial Doppler ultrasound [19] and in the
portal vein [20, 21].
Administration of microbubble contrast resulted in an
increase in agreement between colour Doppler ultrasound
diagnosis and diagnosis from a reference imaging mod-
ality. This is of importance where full reliance can be
placed on the results of a colour Doppler ultrasound
examination in order to bypass angiography prior to any
surgical procedure, particularly in carotid end-arterectomy
surgery [5] where there is a small but significant morbidity
attached to diagnostic angiography [22]. The effect of
introducing a microbubble contrast agent, the ‘‘Doppler
rescue’’ effect, has been successful in the imaging of the
renal arteries [23], the hepatic artery in the liver transplant
patient [24, 25] and the portal vein [20, 26, 27]. In the
assessment of renal artery disease, using a galactose based
microbubble contrast agent (LevovistTM
; Schering AG,
Berlin, Germany), visualization of the renal arteries
improved from 65.7% to 78.3% (p,0.01) following the
administration of microbubble contrast [23]. The use of
SonoVue in the present study improved the ability of all
the off-site readers, presented with a minimum amount of
information, to make a confident interpretation of the
underlying vascular disorder on the CE-US examination.
On the baseline ultrasound examinations, a correct
diagnosis confirmed by the standard of reference was
achieved in 29.7% of studies, improving to 67.6% with the
2.4 ml dose of SonoVue. Moreover, if accuracy is
evaluated in the subset of patient population with
diagnostic examinations, a further increase in the percen-
tage of agreement with reference gold standard is observed
after SonoVue (72.3%) compared with unenhanced
examinations. There was an overall improvement in
sensitivity and specificity for all the off-site readers. The
ability shown by SonoVue to improve the diagnostic
information from a recorded ultrasound examination,
having knowledge of the vessel of interest only, is
remarkable since in the clinical practice the nature of
any ultrasound examination is one of examiner-patient
interaction, where the physician is allowed to develop an
overall concept of the diagnosis. This would suggest that
the use of a microbubble contrast agent as part of an on-
site ultrasound assessment would improve the diagnostic
ability to an even greater degree than what appeared under
the investigational conditions of the present study.
One limitation of the current study is the level of
sophistication of the ultrasound machines used. When this
multicentre study was commenced, each centre was
equipped with a ‘‘top-of-the-range’’ ultrasound machine,
but during the course of the study introduction on the
market of newer machines with digital capability, more
Table 2. Diagnostic accuracy. Percentage agreement between
diagnosis from Doppler ultrasound investigations (both unen-
hanced and SonoVue microbubble contrast-enhanced) and diag-
nosis from the reference standard in the entire population
Unenhanced SonoVue 2.4 ml
Agreement with gold standard 30.7% 68.9%
P S Sidhu, P Allan, F Cattin et al
48 The British Journal of Radiology, January 2006](https://image.slidesharecdn.com/026britishjournalofradiology-britishinstituteofradiology-2006-130913065550-phpapp02/75/British-Journal-of-Radiology-British-Institute-of-Radiology-2006-eng-52-2048.jpg)


![Lymphoepithelioma-like carcinoma of salivary glands:
treatment results and failure patterns
1
C-Y HSIUNG, MD, 2
C-C HUANG, MD, 1
C-J WANG, MD, 1
E-Y HUANG, MD and 2
H-Y HUANG, MD
Departments of 1
Radiation Oncology and 2
Pathology, Chang Gung Memorial Hospital-Kaohsiung, Taiwan, R.O.C.
Abstract. The purpose of this study was to evaluate the treatment results and failure patterns of
lymphoepithelioma-like carcinoma (LELC) of salivary glands. From June 1987 to May 2001, nine patients
with LELC of salivary glands were treated at our hospital. One patient was excluded due to the loss of clinical
follow-up after surgery. For the remaining eight patients, the primary tumour sites were parotid glands (4
patients), submandibular glands (3), and the minor salivary glands in right cheek (1), respectively. Seven
patients underwent surgical treatment and post-operative radiotherapy, while the other one patient was treated
with surgery only. The total radiation dose to the salivary tumour bed ranged from 39.6 Gy to 67.6 Gy (mean
dose: 58.3 Gy and median dose: 59 Gy). The treatment results and failure patterns were analysed. The survival
time ranged from 21.4 months to 145.2 months (mean: 69.1 months, median: 54.5 months). At the end of
follow-up, six patients were still alive and two died. One patient died of distant metastases 21.5 months after
the surgical treatment of LELC. The other case died of intercurrent disease (pontine haemorrhage) 53 months
after surgery. No patient had local or regional failure after the treatments. Distant failure was noted in two
patients. The patients with LELC of salivary glands were shown to have favourable prognoses. No local or
regional failure was noted. However, distant failure developed in two patients. The risk of distant metastasis
should be carefully monitored, especially for those patients with more advanced neck node involvement.
Lymphoepithelioma [1] consisted of poorly differen-
tiated cells with large nuclei and nucleoli within the
lymphoid stroma. Lymphoepithelioma occurs mainly in
the nasopharynx [2, 3]. Also, lymphoepithelioma-like
carcinoma (LELC) has been found in salivary glands [4–
6]. Because LELC is a rare histological type of cancer of
salivary glands [7, 8], the clinical data concerning LELC of
salivary glands is inadequate compared with other
common histological types. Also, the clinical course and
prognosis of this disease after the treatments have not been
thoroughly studied in the medical literature. As a result, a
retrospective study based on our patient database was
undertaken to analyse the treatment results and failure
patterns of LELC of salivary glands.
Patients and methods
From June 1987 to May 2001, nine patients with LELC of
salivary glands were treated at our hospital. One patient was
excluded due to the loss of clinical follow-up. The remaining
eight patients are followed up regularly after the treatments
and included in the current study. The general characteristics
of these patients were shown in Table 1. Three out of eight
patients were male and five were female. The primary tumour
sites were parotid glands (4 patients), submandibular glands
(3), and the minor salivary glands in right cheek (1),
respectively. These patients with LELC were staged according
to TNM classification of the American Joint Committee on
Cancer [9] (Table 1).
The treatment data of these patients are presented in
Table 2. All these eight patients underwent the excision of
primary salivary gland tumours. The dissection of enlarged
neck lymph nodes was also performed for the five patients
(patients 3, 4, 5, 6, and 8 in Table 2) with neck node
metastases noted by physical examination or CT scans. After
surgery, seven cases received post-operative radiotherapy with
a 60
Co machine or 6–10 MV linear accelerator. Six (patients 1,
3, 4, 5, 6, and 8 in Table 2) out of these seven patients were
irradiated with two bilateral portals covering the salivary
tumour bed and upper neck and an anterior–posterior portal
covering the bilateral lower neck. The remaining one patient
(patient 2 in Table 2) received small-field radiotherapy
covering only salivary tumour bed without elective nodal
irradiation to bilateral low neck. In the seven patients treated
with post-operative radiotherapy, the total radiation dose to
the salivary tumour bed ranged from 39.6 Gy to 67.6 Gy
(mean dose: 58.3 Gy and median dose: 59 Gy). The dose to
spinal cord was no more than 45 Gy. For the six patients
receiving elective nodal irradiation to bilateral low neck, the
low-neck dose ranged from 34.2 Gy to 45 Gy (Table 2).
After the treatments, all the patients were followed
regularly at the clinics. The treatment results and failure
patterns were retrospectively reviewed. The survival time
was measured from the date of the first surgical treatment
to the date of last follow-up or death. The survival curves
were calculated by the Kaplan-Meier product-limit method
[10]. Local failure was defined as tumour recurrence in the
salivary tumour bed. Regional failure was defined as
tumour recurrence in the head and neck outside the
salivary tumour bed.
Results
The histology of LELC of one patient is shown in
Figure 1. The treatment results and failure patterns are
summarized in Table 3. The survival time ranged from
Received 5 January 2005 and accepted 7 June 2005.
Address correspondence to: Hsuan-Ying Huang, Department of
Pathology, Chang Gung Memorial Hospital-Kaohsiung, 123, Ta-Pei
Road, Niao Sung Hsian, Kaohsiung Hsien, Taiwan, R.O.C.
The British Journal of Radiology, 79 (2006), 52–55 E 2006 The British Institute of Radiology
DOI: 10.1259/bjr/17905092
52 The British Journal of Radiology, January 2006](https://image.slidesharecdn.com/026britishjournalofradiology-britishinstituteofradiology-2006-130913065550-phpapp02/75/British-Journal-of-Radiology-British-Institute-of-Radiology-2006-eng-56-2048.jpg)
![21.4 months to 145.2 months (mean: 69.1 months, median:
54.5 months). The survival curve of these patients is shown
in Figure 2. At the last follow-up, six patients were still
alive and two had died. One patient died of distant
metastases 21.5 months after the surgical treatment of
LELC (patient 6 in Table 3). The other case died of
intercurrent disease (pontine haemorrhage) 53 months
after surgery (patient 1 in Table 3). No patient had local
or regional failure after the treatments. However, distant
metastases were noted in two patients (patients 6 and 8 in
Table 3). The interval between surgery and distant failure
was 6.3 months and 6.5 months for patient 6 and 8,
respectively. After the occurrence of distant metastases,
these two patients received chemotherapy with CDDP and
5-FU. At last follow-up, five patients were alive without
cancer, one was alive with distant metastases, another one
had died of distant metastases, and the remaining one had
died of intercurrent disease (Table 3).
During radiotherapy, oral mucositis and skin reaction
over radiation field were experienced in all the seven
patients irradiated. The major long-term complications
after the treatments were xerostomia (8 patients), neck
fibrosis (6 patients), and facial palsy (3 patients). The
complication of facial palsy was due to tumour encase-
ment of facial nerve and the surgical treatment.
Discussion
Lymphoepithelioma in nasopharynx is known as a
radiosensitive tumour and radiotherapy is the standard
treatment for nasopharyngeal lymphoepithelioma [2, 3].
Non-nasopharyngeal lymphoepithelioma of the head and
neck is also reported to be radiosensitive with high rates of
locoregional tumour control [5]. In the study of salivary
gland carcinoma by Teo et al [6], seven patients had LELC
from the parotid glands and only two of them experienced
locoregional relapses; one had isolated regional relapse
outside the post-operative radiation field 6 years after
treatments and the other had in-field failure in the parotid
tumour bed 3.5 years after total parotidectomy and post-
operative radiation (50 Gy). In the current study, seven of
these eight patients with LELC of salivary glands received
surgery and post-operative radiotherapy and the other one
was treated with surgery only. No local or regional failure
was noted. From the results of this study and the above
literature [5, 6], surgery and post-operative radiotherapy
may be the appropriate treatment combination with
satisfactory locoregional control for patients with LELC
Table 1. The general characteristics of the eight patients with lymphoepithelioma-like carcinoma (LELC) of salivary glands
Age (years) Sex Primary site Stage [9]
Patient 1 42 Male Right submandibular gland T3 N0 M0
Patient 2 50 Female Minor salivary gland in right buccal area T1 N0 M0
Patient 3 40 Male Left submandibular gland T2 N2b M0
Patient 4 39 Female Right parotid gland T4 N1 M0
Patient 5 43 Female Right parotid gland T3 N2b M0
Patient 6 40 Male Left submandibular gland T3 N2b M0
Patient 7 42 Female Right parotid gland T2 N0 M0
Patient 8 46 Female Left parotid gland T3 N2b M0
Table 2. The treatment data of the eight patients with lymphoepithelioma-like carcinoma (LELC) of salivary glands
Treatments Radiation dose (Gy)
Salivary tumour bed Bilateral low neck
Patient 1 Operation & radiotherapy 67.6 45
Patient 2 Operation & radiotherapy 65.2 0
Patient 3 Operation & radiotherapy 57.6 45
Patient 4 Operation & radiotherapy 39.6 39.6
Patient 5 Operation & radiotherapy 64.8 45
Patient 6 Operation & radiotherapy 59 45
Patient 7 Operation alone
Patient 8 Operation & radiotherapy 54.2 34.2
Figure 1. The histology of lymphoepithelioma-like carcinoma
(LELC) of one patient is shown here. Microscopically, diffuse
lymphoid infiltration is noted around the atrophic acini of sali-
vary gland and occasionally forms lymphoid follicles. Islands
of neoplastic epithelial cells bearing pleomorphic, vesicular
nuclei and indistinct cell border are present within the lym-
phoid tissue.
Lymphoepithelioma-like carcinoma of salivary glands
53The British Journal of Radiology, January 2006](https://image.slidesharecdn.com/026britishjournalofradiology-britishinstituteofradiology-2006-130913065550-phpapp02/75/British-Journal-of-Radiology-British-Institute-of-Radiology-2006-eng-57-2048.jpg)
![of salivary glands. In the future, further study with more
patients is needed to find the appropriate radiation field
and radiation dose for LELC of salivary glands.
Distant metastases to lung, bone, and liver were noted
in two patients (patient 6 and 8, Table 3). The duration
from the date of operation to distant metastases was
6.4 months and 6.6 months for patients 6 and 8,
respectively. Among these eight patients, there were four
patients with N0 or N1 stage (Table 1), and none of them
experienced distant metastases. The other four patients
were all staged as N2b and two of them had distant
metastases after the treatments. From this finding, the
neck node status might be associated with the risk of
distant metastases. In the study of non-nasopharyngeal
lymphoepithelioma of the head and neck [5], the main
cause of treatment failure was distant metastasis, which
occurred more frequently in patients with lymph node
involvement. As a result, the risk of distant metastasis
should not be overlooked for those patients with more
advanced neck node involvement.
Conclusion
In the current study, patients with LELC of salivary
glands were shown to have favourable prognoses. No local
or regional failure occurred in these patients. However,
distant failure developed in two patients. The risk of
distant metastasis should be carefully monitored, especially
for those patients with more advanced neck node
involvement.
Acknowledgments
The authors thank Yu-Ling Wu, M.S. for the kind
assistance with manuscript preparation.
References
1. Schmincke A. Uber lymphoepitheliale Geschevulste. Beitr
Pathol Anat 1921;68:161.
2. Perez CA. Nasopharynx. In: Perez CA, Brady LW, editors.
Principles and practice of radiation oncology. 2nd edn.
Philadelphia, PA: JB Lippincott; 1992:617–43.
3. Moss WT. The nasopharynx. In: Cox JD, editor. Moss’
radiation oncology: rationale, technique, results. 7th edn. St.
Louis, MO: Mosby, 1994:149–68.
4. Cleary KR, Batsakis JG. Undifferentiated carcinoma with
lymphoid stroma of the major salivary glands. Ann Otol
Rhinol Laryngol 1990;99:236–8.
5. Dubey P, Ha CS, Ang KK, El-Naggar AK, Knapp C, Byers
RM, et al. Nonnasopharyngeal lymphoepithelioma of the
head and neck. Cancer 1998;82:1556–62.
Table 3. The treatment results and failure patterns of the eight patients with lymphoepithelioma-like carcinoma (LELC) of salivary
glands
Survival months Distant metastases Status at last follow-up
Patient 1 53 No Died of intercurrent disease
Patient 2 116.5 No Alive without cancer
Patient 3 56 No Alive without cancer
Patient 4 21.4 No Alive without cancer
Patient 5 103.6 No Alive without cancer
Patient 6 21.5 Lung, bone & liver Died of distant metastases
Patient 7 145.2 No Alive without cancer
Patient 8 35.4 Lung, bone & liver Alive with distant metastases
Figure 2. The survival curve of the
eight patients with lymphoepithe-
lioma-like carcinoma (LELC) of sali-
vary glands.
C-Y Hsuing, C-C Huang, C-J Wang et al
54 The British Journal of Radiology, January 2006](https://image.slidesharecdn.com/026britishjournalofradiology-britishinstituteofradiology-2006-130913065550-phpapp02/75/British-Journal-of-Radiology-British-Institute-of-Radiology-2006-eng-58-2048.jpg)

![Comparison of patient doses in 256-slice CT and 16-slice CT
scanners
1,2
S MORI, MS, RT, MPR, 1
M ENDO, PhD, MPH, 1
K NISHIZAWA, PhD, MPH, 2
K MURASE, PhD, MPH,
2
H FUJIWARA, PhD and 3
S TANADA, MD
1
Department of Medical Physics, National Institute of Radiological Sciences, Chiba 263-8555, Japan, 2
School of Allied
Health Sciences, Faculty of Medicine, Osaka University, Osaka 565-0871, Japan and 3
Department of Medical Imaging,
National Institute of Radiological Sciences, Chiba 263-8555, Japan
Abstract. The 256-slice CT-scanner has been developed at the National Institute of Radiological Sciences.
Nominal beam width was 128 mm in the longitudinal direction. When scanning continuously at the same
position to obtain four-dimensional (4D) images, the effective dose is increased in proportion to the scan time.
Our purpose in this work was to measure the dose for the 256-slice CT, to compare it with that of the 16-slice
CT-scanner, and to make a preliminary assessment of dose for dynamic 3D imaging (volumetric cine imaging).
Our group reported previously that the phantom length and integration range for dosimetry needed to be at
least 300 mm to represent more than 90% of the line integral dose with the beam width between 20 mm and
138 mm. In order to obtain good estimates of the dose, we measured the line-integral dose over a 300 mm range
in PMMA (polymethylmethacrylate) phantoms of 160 mm or 320 mm diameter and 300 mm length. Doses for
both CT systems were compared for a clinical protocol. The results showed that the 256-slice CT generates a
smaller dose than the 16-slice CT in all examinations. For volumetric cine imaging, we found an acceptable scan
time would be 6 s to 11 s, depending on examinations, if dose must be limited to the same values as routine
examinations with a conventional multidetector CT. Finally, we discussed the studies necessary to make full use
of volumetric cine imaging.
In 2001 the introduction of a 16-slice CT-scanner raised
some new topics in CT technology development. 16-slice
CT allows applications of three-dimensional (3D) images
in clinical fields such as diagnosis, surgical simulation,
planning of radiation therapy and monitoring of inter-
ventional therapy. However, it is still difficult to take
dynamic 3D images of moving organs such as the heart or
lung to enlarge the application fields. In order to take
these images, we have developed a prototype 256-slice CT
at NIRS (National Institute of Radiological Sciences)
which employs continuous rotations of a cone-beam [1].
Clinical applications of CT techniques have continued
to increase the dose to patients during recent decades, as
CT examinations have come to provide higher quality
X-ray imaging with substantial benefits in clinical
diagnosis [2]. Notwithstanding the potential benefits to
the healthcare of patients using CT, the fundamental
concern in radiological protection is the optimization of
radiation exposure.
The maximum nominal beam width of the 256-slice CT
is 128 mm and is four times larger than the third-
generation 16-slice CT-scanner (Toshiba Aquilion;
Toshiba Medical Systems, Japan). A wider beam width
is more efficient for imaging in a wider coverage. However,
doses to patients with 256-slice CT are of considerable
concern if it is to be used for obtaining dynamic 3D
images (volumetric cine images). When scanning continu-
ously at the same position, the effective dose is increased in
proportion to the scan time and a wider coverage brings
larger doses to patients. Therefore, it is very important to
assess the dose of the 256-slice CT before volumetric cine
imaging for patients.
This work was carried out to compare doses, including
scattered radiation, of the 256-slice CT and 16-slice CT
and to make a preliminary assessment of dose for
volumetric cine imaging.
Materials and methods
Acquisition systems of 256-slice CT and 16-slice CT
scanners
The prototype 256-slice CT-scanner uses a wide-area 2D
detector designed on the basis of the present CT
technology and is mounted on the gantry frame of a
state-of-the-art CT-scanner (Figure 1) [3]. The number of
elements is 912 channels6256 segments; element size is
approximately 1 mm61 mm, corresponding to a 0.5 mm
(transverse)60.5 mm (longitudinal) beam width at the
centre of rotation. Gantry rotation time is 1.0 s. Data
sampling rate is 900 views/s, and the dynamic range of the
A/D converter is 16 bits. As shown in Appendix 1, the
reconstructed regions are cylinders of 240 mm diameter
and 102.4 mm length for the head scan and 320 mm
diameter and 93.9 mm length for the body scan. The
detector element consists of a scintillator and photodiode,
which are the same as for the scintillator of multidetector
CT (MDCT) (Toshiba Aquilion). Three wedge designs
(large, small, and flat) on the 256-slice CT are intended to
extend the conventional wedge designs of the third-
generation 16-slice CT-scanner (Toshiba Aquilion) in the
Received 6 August 2004 and in revised form 8 April 2005, accepted 13
June 2005.
Address correspondence to: Shinichiro Mori, 4-9-1 Anagawa, Inage-
ku, Chiba-shi, Chiba, 263-8555, Japan.
The British Journal of Radiology, 79 (2006), 56–61 E 2006 The British Institute of Radiology
DOI: 10.1259/bjr/39775216
56 The British Journal of Radiology, January 2006](https://image.slidesharecdn.com/026britishjournalofradiology-britishinstituteofradiology-2006-130913065550-phpapp02/75/British-Journal-of-Radiology-British-Institute-of-Radiology-2006-eng-60-2048.jpg)
![longitudinal direction. The large and small wedges are
shaped to compensate for the variable path length of the
patient across the scan field of view (FOV). The small
wedge is used for an object under 240 mm FOV, and the
large wedge is used for over 240 mm FOV (e.g. chest and
abdomen). The flat wedge is thicker at the centre than the
other wedges.
A Feldkamp-Davis-Kress (FDK) algorithm [4] is used
for reconstruction. All further data processing and
interpretation are done with a high-speed image processor
with field programmable gate-array based-(FPGA) archi-
tecture. It takes less than 1 s to reconstruct volume data of
a 51265126256 matrix.
The 16-slice CT detector consists of 40 segments, which
can be electronically grouped to provide different image
slice configurations. The longitudinal FOV is 32 mm at the
maximum. Other major components are the same as those
of the 256-slice CT. In addition to the axial scan, the
helical scan mode can be selected to cover volumes beyond
the detector width.
Phantoms
The length of the IEC-recommended dosimetry phan-
tom [5] is at least 140 mm. This conventional phantom
contains holes just large enough to accept the pencil-
shaped ionization chamber. For dose measurement in
cone-beam CT, the length of the phantom should be
longer, because of the wider scatter distribution.
According to our previous results [6], the phantom
length and integration range for dosimetry needed to be
at least 300 mm to represent more than 90% of line
integral dose with the beam width between 20 mm and
138 mm. Therefore, in the present study we used 300 mm
long phantoms of PMMA (polymethylmethacrylate).
The diameters of the phantoms are 160 mm for head
and 320 mm for body examination. These phantoms
were provided by joining unit cylinders 150 mm long.
The details of the phantoms were described by Mori
et al [6].
Detectors
A pencil-shaped ionization chamber (CT-30; Oyogiken,
Japan) of active length 300 mm was connected to a
dosemeter (AE-132; Oyogiken, Japan) and used to
measure dose. The dosemeter was calibrated
(National Institute of Advanced Industrial Science and
Technology, Japan) for the appropriate radiation qualities.
Clinical scan conditions
We compared the doses of the 256-slice CT and the
16-slice CT for clinical scan conditions. These conditions
were mainly derived from those recommended by the
manufacture for the 16-slice CT. The X-ray tube current
was set such that the effective mAs should be the same
for both CTs, as given by (current)6(rotation time)/
(helical pitch) for the 16-slice CT and by
(current)6(rotation time) for the 256-slice CT. For the
256-slice CT, slice collimation was 224 mm60.5 mm for
the head, 128 mm61.0 mm for the pelvis, and
256 mm60.5 mm for other sites. For the 16-slice CT,
the slice collimation was set to 16 mm61.0 mm for pelvis
and 16 mm60.5 mm for other sites, helical pitch was 0.69
for the head, and 0.94 for other sites, because the scan
conditions were chosen to obtain the same spatial
resolution as for the 256-slice CT.
The whole scan ranges were 93.9 mm for chest,
187.8 mm for abdomen, and 281.7 mm for pelvis.
These scan ranges, except chest examination, were
beyond the detector width of the 256-slice CT in
the longitudinal direction, therefore they were set as
multiples of 93.9 mm, the maximum longitudinal FOV
of the 256-slice CT (Appendix 1). For the head
examination, because the recommended value for the
16-slice CT was shorter than the maximum FOV of
256-slice CT, the FOV was adjusted to narrow the
collimator width for the 256-slice CT. The clinical
scan conditions thus obtained are summarized in
Table 1.
(a) (b)
Figure 1. (a) Front view of 256-slice CT-scanner. (b) A wide-area 2D detector is designed on the basis of the present CT technology
and mounted on the gantry frame of the state-of-the-art CT-scanner.
Comparison of patient dose in multislice CT
57The British Journal of Radiology, January 2006](https://image.slidesharecdn.com/026britishjournalofradiology-britishinstituteofradiology-2006-130913065550-phpapp02/75/British-Journal-of-Radiology-British-Institute-of-Radiology-2006-eng-61-2048.jpg)
![Dose measurements
The dose for both CT systems was measured with the
300 mm long pencil-shaped ionization chamber and
300 mm long phantoms (160 mm and 320 mm diameter)
in one rotation scan. The measurement range in the
longitudinal direction was 300 mm (z5¡150 mm). The
phantom was placed on the patient table and its centre was
aligned at the isocentre. The ionization chamber was
inserted into either the central or one of the peripheral
cavities of the phantom (other cavities were filled with
PMMA rods). The exposure (expressed as Roentgens) was
obtained with the ionization chamber dosemeter and
converted to the values of absorbed dose to air measured
in PMMA with the f-factor 0.898 cGy R21
.
Dose assessment
The dose was assessed using the dose profile integral
(DPI) over 300 mm (z5¡150 mm) (Appendix 2), which
was given by the output of the pencil ionization chamber
of 300 mm length [6].
The weighted average of DPI at the centre and
peripheries of the phantoms is given by
DPIw~
1
3
DPIcz
2
3
DPIp ð1Þ
if we assume a linear decrease (or increase) of DPI in the
radial direction, where DPIc is the DPI at the centre and
DPIp the average DPI on the peripheries.
Clinical image quality
We imaged four healthy male volunteers (mean age 30.0
years¡7.6 (standard deviation) (SD); age range 23–53
years) using the 256-slice CT. The study was approved by
the Institutional Review Board, and written informed
consent was obtained from all subjects before starting. A
non-enhanced examination with a step-and-shoot approval
was carried out as follows: (i) head, (ii) chest,
(iii) abdomen, and (iv) pelvis for one subject at each
anatomical site. The subjects held their breath at end-
inhale for the chest examination and end-exhale for the
abdomen and pelvis examinations during scanning. Scan
conditions were the same as the clinical conditions
(Table 1) except the scan ranges, which were 102.4 mm
for head (one scan), 375.6 mm for chest (four contiguous
scans), 93.9 mm for abdomen and pelvis (one scan). The
matrix size was 51265126111251265126205, and the
convolution kernel was the standard head kernel (FC43)
for the head examination and the standard body kernel
(FC10) for the others.
Image quality was evaluated by three board-certified
radiologists who had more than 10 years experience in
clinical diagnosis. They compared quality of the images
taken with the prototype scanner to their quality standard
formed by experience. It took about 1.5 h to read the
images obtained in multiple planes in all four cases.
Results
For both CTs, DPIc, DPIp, and DPIw in an axial scan
are summarized in Table 2. These values are
normalized to 100 mAs. For the 256-slice CT, DPIw is
1966 mGy?mm/100 mAs for the head phantom and
1109 mGy?mm/100 mAs for the body phantom. For the
16-slice CT, DPIw is 181.6 mGy?mm/100 mAs with 8 mm
Table 1. Scan conditions for 256-slice CT and 16-slice CT-scanners
Examination Scanner Voltage
(kV)
Current
(mA)
Rotation
time (s)
Scan
time (s)
Beam collimation
(mm6mm)
FOV
(mm)
Scan range
(mm)
Scan mode Helical pitch
Head 256-slice CT 120 326 1.0 1.0 22460.5 240 90.0 Axial N/A
16-slice CT 300 0.75 17.0 1660.5 Helical 0.69
Chest 256-slice CT 120 160 1.0 1.0 25660.5 320 93.9 Axial N/A
16-slice CT 300 0.5 8.3 1660.5 Helical 0.94
Abdomen 256-slice CT 120 213 1.0 1s62 25660.5 320 187.8 Axial N/A
16-slice CT 400 0.5 14.5 1660.5 Helical 0.94
Pelvis 256-slice CT 120 213 1.0 1s63 12861.0 320 281.7 Axial N/A
16-slice CT 400 0.5 11.4 1661.0 Helical 0.94
FOV, field of view.
Table 2. Dose profile integral (DPI) for the 256-slice CT and 16-slice CT
CT scanner Phantom Beam width (mm) DPIc (mGy mm/100 mAs) DPIp (mGy mm/100 mAs) DPIw (mGy mm/100 mAs)
256-slice CT Head 112 1829 2034 1966
Body 128 781 1273 1109
16-slice CT Head 8 174.2 185.3 181.6
Body 8 67.7 98.7 88.4
Body 16 117.6 175.0 155.9
Table 3. Dose profile integral weighted average (DPIw) for
clinical protocols for 256-slice CT and 16-slice CT
Examination DPIw (mGy?mm) DPIw percentage
(%)
256-slice CT 16-slice CT
Head 6410 12127 52.9
Chest 1775 2462 72.1
Abdomen 4725 5773 81.9
Pelvis 7088 7981 88.8
S Mori, M Endo, K Nishizawa et al
58 The British Journal of Radiology, January 2006](https://image.slidesharecdn.com/026britishjournalofradiology-britishinstituteofradiology-2006-130913065550-phpapp02/75/British-Journal-of-Radiology-British-Institute-of-Radiology-2006-eng-62-2048.jpg)
![beam width for the head phantom, 88.4 mGy?mm/
100 mAs with 8 mm beam width and 155.9 mGy?mm/
100 mAs with 16 mm beam width for the body phantom.
In Table 3 DPIw values are calculated for the clinical
protocols. Values for the 256-slice CT are smaller than
those for the 16-slice CT in all examinations. We note that
especially in the head examination, the DPIw for the
256-slice CT is approximately 47% smaller than that for
the 16-slice CT.
With regard to the clinical image quality, Figure 2
shows normal anatomical images from the 256-slice CT.
Auditory ossicles are observed clearly in the sagittal
section with the same image quality as the state-of-the-art
CT-scanner (Figure 2a). For the chest examination, 3D
visualization of the lung from four contiguous axial scans
is shown in Figure 2b. For the abdomen examination, the
coronal image has an image quality as good as that of
conventional CT (Figure 2c). For the pelvis examination,
three contiguous coronal images are shown in Figure 2d.
These images also show the same image quality as
conventional CT.
Discussion
In the present study, we compared doses in the 256-slice
CT and the 16-slice CT for clinical conditions. The results
showed that the dose for the 256-slice CT was smaller
than that of the 16-slice CT in all examinations (Table 3).
The percentages of DPIw for the 256-slice CT to that for
the 16-slice CT were 52.9%, 72.1%, 81.9% and 88.8% in the
examinations of head, chest, abdomen and pelvis,
respectively.
The dose for the 256-slice CT was less than that of the
16-slice CT in all examinations for the following reason. In
a MDCT-scanner the actual beam width is set as the
nominal beam width (slice thickness6slice number) plus a
certain margin, where the margin is added to cover
penumbra and mechanical errors. X-ray photons incident
on a marginal portion do not contribute to image
formation, but they do contribute to increased dose. If
the nominal beam width becomes large, the contribution
of this portion becomes smaller. Thus, the 256-slice CT
with larger beam width provides smaller DPIw values than
the 16-slice CT. For the 16-slice CT the pelvis examination
with 16 mm nominal beam width is more effective than the
others with 8 mm beam width. In general, helical scans
with pitch less than one caused overlap regions. Therefore
in the present study, we set the effective mAs value to be
the same to obtain the same signal-to-noise ratio in both
CT systems.
Notwithstanding the dose for the 256-slice CT being
smaller than that of the 16-slice CT, the 256-slice CT
provides sufficient image quality for diagnosis (Figure 2)
[7]. In these clinical conditions, the 256-slice CT achieved a
0.5–0.8 mm isotropic resolution and large volumes of data
were taken in a one-rotation scan [8]. Therefore coronal
(a) (c)
(d)(b)
Figure 2. Clinical images. (a) The 0.5 mm isotropic normal anatomy images of auditory ossicles in sagittal section. (b) 3D visualiza-
tion of the chest with four contiguous scans. (c) Normal anatomy images of abdomen (0.63 mm reconstruction increment).
(d) Coronal image (0.63 mm reconstruction increment) of pelvis with three contiguous scans.
Comparison of patient dose in multislice CT
59The British Journal of Radiology, January 2006](https://image.slidesharecdn.com/026britishjournalofradiology-britishinstituteofradiology-2006-130913065550-phpapp02/75/British-Journal-of-Radiology-British-Institute-of-Radiology-2006-eng-63-2048.jpg)
![and sagittal images were obtained at sufficient spatial
resolution without secondary reconstruction.
Regarding the diagnostic reference level, the effective
dose [9] for the MDCT was approximately 15 mSv for
routine chest examinations and 30 mSv for routine abdo-
men or pelvis examinations [10]. If these values are taken
as upper limits and X-ray conditions are the same as those
in Table 1, the acceptable scan time in volumetric cine
imaging might be estimated in the following way. From
Appendix 2, the estimated effective dose for a 1 s scan was
2.21 mSv, 2.60 mSv and 3.29 mSv for chest, abdomen and
pelvis, respectively. Therefore, the acceptable scan time
should be 6 s (5 15 [mSv]/2.21 [mSv]), 11 s (530 [mSv]/
2.60 [mSv]) and 9 s (5 30 [mSv]/3.20 [mSv]) for chest,
abdomen, and pelvis, respectively. As these scan times may
not be sufficient for a dynamic study in some cases, further
efforts are necessary to develop dose reduction methods
such as automatic dose control [11–13], as well as to justify
increasing the dose in dynamic studies consistent with risk-
benefit. Resolution of these issues will allow full use of
volumetric cine images which will significantly increase the
amount of diagnostic information available to radiologists.
In particular, we expect new applications such as
computed tomographic angiography (CTA) of coronary
arteries or perfusion studies of the whole brain.
Appendix 1. Field of view for the 256-slice CT
In the 256-slice CT, the reconstructed images with
the Feldkamp algorithm is the region that is passed
through during scanning by the tetra-angular pyramid
whose apex and base are the X-ray source and the 2D
detector, respectively (Figure A1). The reconstructed
region is a double conical shape within a maximum
FOV (Rmax) in the transverse plane that is determined by
the detector size in the transverse direction.
Reconstruction is not made in the entire Rmax except at
the midplane and depends on a reconstructed FOV (R). In
the case of the 256 mm60.5 mm (5 N6T) beam
collimation, the length of the reconstruction region (H)
is 102.4 mm for R5 240 mm and 93.9 mm for R5
320 mm. As seen in this example, the reconstructed
region is generally smaller than the nominal beam width
in cone beam CT.
Appendix 2. Effective dose estimation
CT dose index (CTDI), dose–length product (DLP), and
effective dose (E) are usually used for CT dosimetry [2],
and they are derived from DPI described in the present
report.
CTDI is given as follows.
CTDI~
1
NT
ðl=2
{l=2
d(z)dz ½mGyŠ
where N is the number of slices, T (mm) is the nominal
slice thickness, and d(z) is the dose profile for an axial
scan, l indicates the integration range. The International
Electrotechnical Comission (IEC) recommended an inte-
gration range of 100 mm. However we used the integration
range of 300 mm for the reason described.
DPI is given with these notations as follows.
DPI~
ðl=2
{l=2
d(z)dz ½mGy mmŠ
From Equations (A1) and (A2),
CTDI~
1
NT
DPI
Weighted CTDI (CTDIw) is defined with CTDIs measured
at the centre and peripheries of the phantoms as follows.
CTDIw~
1
3
CTDICz
2
3
CTDIP ½mGyŠ
CTDIc and CTDIp represent the CTDI measured at the
centre and the average CTDIs measured on the periphery
of the phantom, respectively. CTDIw is given by DPIw as
follows.
CTDIw~
1
NT
DPIw ½mGyŠ
Dose–length product (DLP) for a complete examination
is given as:
DLP~CTDIw|L ½mGy cmŠ
where L (cm) is the scan range in the longitudinal
direction.
Estimation of effective dose (E) may be derived from
values of DLP for an examination using appropriately
normalized coefficients:
E~EDLP
. DLP ½mSvŠ
Figure A1. Reconstruction geometry of cone-beam CT. An
X-ray source and a 2D detector rotate around the z-axis. The
volume that can be reconstructed with the Feldkamp algorithm
is shown by the shaded region and is a double conical region
within a cylinder of radius Rmax, which is determined by the
detector size in the x-direction and shows the maximum field
of view in the transverse plane. R and H show diameter and
height, respectively, of a cylindrical reconstructed volume as it
varied with an object. N6T show the nominal beam width
where N is the number of slice and T is the slice collimation.
Table A1. Calculated weighted CT dose index (CTDIw), dose–
length product (DLP) and effective dose E for the 256-slice CT
DPIw
(mGy?mm)
CTDIw (mGy) DLP
(mGy?cm)
E (mSv)
Chest 1775 13.87 130.2 2.21
Abdomen 2363 18.46 173.3 2.60
Pelvis 2363 18.46 173.3 3.29
(A5)
(A6)
(A7)
(A1)
(A2)
(A3)
(A4)
S Mori, M Endo, K Nishizawa et al
60 The British Journal of Radiology, January 2006](https://image.slidesharecdn.com/026britishjournalofradiology-britishinstituteofradiology-2006-130913065550-phpapp02/75/British-Journal-of-Radiology-British-Institute-of-Radiology-2006-eng-64-2048.jpg)
![EDLP is the region-specific normalized effective dose
(mSv mGy21
mm21
) [9].
From these equations CTDIw, DLP and E can be
calculated from measured DPIw. Table A1 gives calculated
DPIw, CTDIw, DLP and E with one second scan of the
256-slice CT in the clinical conditions for chest, abdomen
and pelvis examinations, respectively.
References
1. Endo M, Mori S, Tsunoo T, Kandatsu S, Tanada S, Aradate H,
et al. Development and performance evaluation of the first model
of 256-slice CT-scanner. IEEE Trans Nucl Sci 2003;50:1667–71.
2. International Commission on Radiological Protection.
Managing patient dose in computed tomography. ICRP
Publication 87. Annals of the ICRP 30 (4), Pergamon Press,
Oxford, 2000.
3. Saito Y, Aradate H, Igarashi K, Ide H. ‘‘Large area 2-
dimensional detector for real-time 3-dimensional CT (256-
slice CT),’’ Proc SPIE 2001;4320:775–82.
4. Feldkamp LA, Davis LC, Kress JW. Practical cone-beam
algorithm. J Opt Soc Am 1984;A 1:612–9.
5. International Electrotechnical Commission. Evaluation and
routine testing in medical imaging departments constancy
tests – X-ray equipment for computed tomography.
Publication IEC 1994:1223-2-6.
6. Mori S, Endo M, Nishizawa K, Tsunoo T, Aoyama T, Fujiwara
H, et al. Enlarged longitudinal dose profiles in cone-beam CT
and the need for modified dosimetry. Med Phys 2005;32:1061–9.
7. Mori S, Endo M, Obata T, Murase K, Fujiwara H, Kandatsu
S, et al. Clinical potentials of the prototype 256-detector roe
CT-scanner. Acad Radiol 2005;22:149–55.
8. Mori S, Endo M, Tsunoo T, Kandatsu S, Tanada S, Aradate
H, et al. Physical performance evaluation of a 256-slice CT-
scanner for 4-dimensional imaging. Med Phys 2004;31:1348–
56.
9. European Guidelines. Quality Criteria for Computed
Tomography. EUR 16262, CEC Luxembourg, 1997.
10. Aoki C, Nishizawa K, Tonari A, Hachiya J. Effective dosing
for multi-detector CT scanning. Jpn J Med Imaging
2001;20:101–9.
11. Nagel HS, Galanski M, Hidajat N, Maier W, Schmidt T.
Radiation exposure in computed tomography-fundamentals,
influencing parameters, dose assessment, optimization,
scanner data, terminology. Hamburg: CTB Publications,
2001.
12. Thomas LT, Neil BB, Tin-Su P, Jerry R, Steven JW, Jianying Li,
et al. A dose reduction X-ray beam positioning system for
high-speed multislice CT scanners. Med Phys 2000;27:
2659–68.
13. Kachelrieß M, Kalender WA. Dose reduction by generalized
3D adaptive filtering for conventional and spiral single-,
multirow and conebeam CT. Radiology 1999;213:283–4.
Comparison of patient dose in multislice CT
61The British Journal of Radiology, January 2006](https://image.slidesharecdn.com/026britishjournalofradiology-britishinstituteofradiology-2006-130913065550-phpapp02/75/British-Journal-of-Radiology-British-Institute-of-Radiology-2006-eng-65-2048.jpg)
![Assessment of tube current modulation in pelvic CT
G R IBALL, MSc, DipIPEM, D S BRETTLE, PhD and A C MOORE, MSc, DipIPEM
Department of Medical Physics & Engineering, Leeds Teaching Hospitals NHS Trust, Leeds General Infirmary, Leeds
LS1 3EX, UK
Abstract. An anatomically shaped polymethylmethacrylate (PMMA) phantom was used to assess the effect of
the Siemens CARE Dose mA modulation system on pelvic CT scans. The effect of the system on absorbed dose
to air, image percentage noise and the signal to noise ratio of clinically relevant details was assessed. The signal
to noise ratio was calculated using Polytetrafluoroethylene (PTFE) and distilled water inserts; PTFE was used
to represent bony structure and distilled water was used to represent soft tissue abscess. Pelvis protocols
identified from local hospitals and the UK CT Dose Survey (2002), were assessed and compared with those
provided by Siemens Medical (UK). These protocols were tested on a Siemens Sensation 4 CT scanner, both
with and without CARE Dose. Results were obtained which showed that dose savings were possible with no
significant increase in image noise. Dose reductions were 8% in the lateral positions in the phantom and 42% in
the centre, top and bottom. The calculated ‘‘CTDIvol’’ was 32% lower with CARE Dose than without CARE
Dose. This is slightly greater than the 25% change in the effective mAs values that was found. This implies that
the reduction in the effective mAs values is a reasonable predictor of the total reduction in absorbed dose to air,
whilst slightly underestimating the actual change. The results also showed a non-significant trend towards
decreased signal to noise ratios for clinically relevant CT numbers when CARE Dose was activated. This
suggests that tube current modulation may detrimentally affect signal detection due to changes in image noise.
CT examinations account for a large proportion of the
collective dose from medical X-ray examinations in the
UK. In 2000 this was reported as being 40% [1] but may
now be even higher due to an increase in the range and
volume of routine examinations and the uptake of CT
fluoroscopy and cardiac CT scanning. There is a require-
ment for all X-ray examinations to be optimized such that
the patient dose is ‘‘As Low As Reasonably Practicable’’
(ALARP) [2]. However, it is often difficult to implement
procedures which significantly lower the radiation dose
without decreasing the image quality to a non-diagnostic
level. One recent technological advance from CT manu-
facturers in terms of dose reduction has been to introduce
tube current modulation systems for CT scanning. The
approach taken by Siemens Medical Systems (Erlangen,
Germany) is a system called CARE Dose which claims to
reduce patient doses whilst having no significant adverse
effects on the image quality. This system has been
described extensively in the literature [3–5].
The human body varies in composition both along its
length and in the transverse plane at any given point along
the body. This produces variations in X-ray attenuation
due to both the external dimensions of the body and its
internal composition. In CT scanning, as the X-ray tube
and detectors rotate around the body, the attenuation can
change by two orders of magnitude [4]. These differences
in attenuation are most significant in the regions of the
shoulder and pelvis, where large thicknesses of bone are
found in the lateral projections, but a much smaller
thickness of bone is present in the anterior–posterior
projections. It is these examinations which provide the
greatest challenges, in terms of the dose–image quality
balance. As a result, using a constant tube current (mA)
for each scan angle within a given rotation may result in
either photon starvation artefacts on the high attenuation
projections or overdosing in the lower attenuation
projections.
In the CARE Dose system, during each rotation of the
tube and detector assembly around the patient, a small
number of the central detector channels provide attenua-
tion information, which is dependent upon the patient
cross section and scan angle, to the X-ray generating
system [3]. The information provided by these detector
channels is used to determine to what extent the mA can be
modulated, with respect to an initial tube current setting,
without adversely affecting the image quality. As a result
the tube current is modulated dynamically with a delay of
one rotation relative to the attenuation measurement.
The first patient based assessment by Greess et al [6]
showed that, when CARE Dose is used, a dose reduction
of approximately 25% (in terms of total mAs reduction) is
possible in pelvic scanning ‘‘with no significant decrease’’
in subjective assessments of image quality. Similar
percentage dose reductions have been demonstrated in
other clinical work [7] and these showed good agreement
with phantom based data [2, 5]. Most of the published
work has used image noise and/or subjective image
assessment to quantify image quality. A small number
of papers [8, 9] have used standard deviations from regions
of interest (ROIs) to yield a more objective assessment of
image noise.
Claims that the image quality was not affected by the
CARE Dose system were queried by local users. Having
used CARE Dose for a period of time, they perceived that
the quality of the images for pelvis scans was subjectively
worse when CARE Dose was used and this raised
concerns that it may have a detrimental effect on the
accuracy of diagnosis. This is despite the manufacturer’s
recommendation that CARE Dose is used for all
clinical situations other than for extremely large patients.
This discrepancy between the reported claims and
Received 18 October 2005 and in final form 24 May 2005, accepted 31
May 2005.
The British Journal of Radiology, 79 (2006), 62–70 E 2006 The British Institute of Radiology
DOI: 10.1259/bjr/50019934
62 The British Journal of Radiology, January 2006](https://image.slidesharecdn.com/026britishjournalofradiology-britishinstituteofradiology-2006-130913065550-phpapp02/75/British-Journal-of-Radiology-British-Institute-of-Radiology-2006-eng-66-2048.jpg)
![local experience prompted this investigation into the
relationships between patient dose, image percentage
noise and the signal to noise ratio (SNR) as an indicator
of diagnostic detectability. The objective was to clarify
whether the CARE Dose system can yield significant dose
reduction for no loss of image quality in pelvic scanning.
Materials and methods
A series of measurements were made using an
anatomically shaped polymethylmethacrylate (PMMA)
phantom which has been described in the literature [3]
as a ‘‘hip’’ phantom. A schematic diagram of the phantom
is shown in Figure 1. The thickness of the phantom is
14.5 cm in the z-axis. The hip phantom does not contain
any bony structure and therefore the similarity of the
phantom to the pelvic region is geometric only. As such it
may be expected that the magnitude of the tube current
modulation in clinical practice may be different from that
found for this phantom.
Protocol selection
Routine protocols for soft tissue assessment of the pelvis
on Siemens 4 slice CT scanners (Somatom Volume Zoom
and Somatom Sensation 4) were obtained from three local
hospitals, the UK CT Dose survey 2002 and from Siemens
Medical (UK) (Bracknell, UK). These protocols fell into
two main groups, those that used a pitch of 1.00 and those
that used a pitch of 1.25. There was some variation in the
mA/mAs setting that was used, but all of the protocols
used 120 kV and a rotation time of 0.5 s. In light of these
findings all measurements were performed at the standard
exposure factors given in Table 1. Reconstruction kernel
B40s was used.
Effective mAs is defined as the tube mAs per rotation
divided by the helical pitch, where the pitch is the ratio of
the table feed per rotation and the total X-ray beam width
[10]. The effective mAs value of 165 was chosen as this was
representative of most of the protocols that were obtained.
Pitch settings of 1.00, 1.13 and 1.25 were used, both with
and without CARE Dose. All the measurements were
performed using the same PMMA hip phantom on the
same scanner, a Siemens Sensation 4.
Measurements were made which investigated how four
different parameters changed with the application of
CARE Dose. The four parameters that were investigated
were (i) absorbed dose to air, measured in the phantom,
(ii) image percentage noise, (iii) CT number for water and
polytetrafluoroethylene (PTFE), and (iv) the SNR for both
of these materials. These parameters were investigated for
each pitch setting, both with and without CARE Dose.
Water was chosen to represent low density abscess and
PTFE to represent bony structure.
Consistency tests
Prior to the testing, all of the test equipment was placed
in the scanning room for at least 4 h in order for the
temperature of the phantom and test equipment to
stabilize with the room temperature. At the start of each
visit the scanner was air-calibrated using the software on
the scanner. A short series of consistency tests were
performed immediately after the air-calibration which, on
all subsequent visits, enabled us to verify that the
performance of the scanner had not changed from the
previous visit.
On each occasion the hip phantom was positioned
15 cm from the end of the couch on top of the mattress in
order to maintain consistent scattering conditions. The
phantom was aligned using the laser lights on the scanner
and with a spirit level. The set up is shown in Figure 2.
A Scan Projection Radiograph (Topogram) of the
phantom was acquired and a helical acquisition was
planned from this image. The scan length for the helical
acquisition was the whole length of the phantom
Figure 1. A schematic diagram of the hip phantom. Solid
cylinders within the phantom (1) represent the five ion chamber
positions, dashed circles within the phantom (2) represent the
five polymethylmethacrylate (PMMA) CT number and noise
measurement positions; the dashed circle outside the phantom
(3) represents the air CT number measurement position.
Table 1. Standard exposure factors for all scans
Tube voltage (kV) Effective mAs Rotation time (s) Beam collimation (mm) Image slice thickness (mm) SFOV (mm)
120 165 0.5 462.5 5 380
SFOV, field of view.
Figure 2. The phantom as positioned for the dose and noise
measurements.
Assessment of tube current modulation
63The British Journal of Radiology, January 2006](https://image.slidesharecdn.com/026britishjournalofradiology-britishinstituteofradiology-2006-130913065550-phpapp02/75/British-Journal-of-Radiology-British-Institute-of-Radiology-2006-eng-67-2048.jpg)
![(145 mm), which gave a total scan time of 8.2 s, using a
pitch of 1.25. All of the consistency tests were performed
with CARE Dose on.
The first test was a measurement of the absorbed dose to
air. A scan was performed at the standard exposure factors
at a pitch of 1.25 with a calibrated 3 cm3
pencil ionization
chamber (Capintec Inc., Ramsey, NJ), having an active
length of 100 mm, in the central position. The chamber
was connected to a Keithley 35050A Dosimeter (Keithley
Instruments Inc., Cleveland, OH). The absorbed dose to
air was recorded and the mean PMMA CT number and
standard deviation (p) were measured adjacent to each of
the five possible chamber positions (see Figure 1), on the
CT slice closest to the centre of the phantom, using the
region of interest (ROI) tool on the scanner. The size of
the ROI that was used was kept constant throughout all of
the measurements. The mean CT number of air was also
measured at a standard position outside the phantom
using a ROI of the same size.
This scan and measurement procedure was then
repeated with the ion chamber in the right lateral
measurement position. On each occasion the ambient air
temperature and pressure were measured, in addition to
the phantom temperature, so that an air density correction
could be applied to the dose measurements.
The ion chamber was then removed from the phantom
and a PTFE rod was inserted into the central measurement
position. The scan was repeated and the mean CT number
and p of the PTFE rod were recorded in addition to the
measurements described above. Again this was repeated
with the PTFE rod in the right lateral position.
Absorbed dose to air and noise measurements
Absorbed dose to air measurements were made for each
of the five chamber positions both with and without
CARE Dose at each of the three pitch settings. For each
scan the measured dose and total mAs were recorded. On
the central slice the mean PMMA CT number and p were
recorded at each measurement position and the mean air
CT number was also recorded. For each measurement
position the image percentage noise was calculated using
Equation (1) [11]:
Image Percentage Noise~
pPMMA Ã 100
CTPMMA{CTAir
ð1Þ
where: p is the standard deviation and CT is the mean CT
number (Hounsfield Unit) of the indicated material.
The absorbed dose to air was corrected for ambient
temperature and pressure and the ion chamber calibration
factor was applied. The volume averaged CT dose index
(CTDIvol) was then calculated for the scans with and
without CARE Dose, using Equation (2) [11]. This was
performed for each pitch setting:
CTDIvol~ 1=3 Ã CTDIcentrez2=3 Ã CTDIperiphery
À Á
=pitchð2Þ
where: CTDIcentre is the CTDI measured in the centre of
the phantom and CTDIperiphery is the average of the four
CTDI values which were measured in the periphery of the
phantom. Pitch is the ratio of the table feed per rotation
and the total X-ray beam width.
CTDIvol is actually defined for a cylindrical phantom
and as such it is not strictly applicable to the hip phantom
that was used in this study. However, the CTDIvol method
is an accepted way of accounting for the distribution of
dose within a phantom. Since, in this case, it is the
comparison between the CTDIvol values for two different
scanning situations, rather than the absolute value that
was of most importance, the CTDIvol was used simply as
an indicator of the relative change in absorbed dose to air.
As such, the term ‘‘CTDIvol’’ is used for all calculations
that relate to the hip phantom.
The effect of the CARE Dose system on the percentage
dose reduction was also evaluated over a range of initial
effective mAs settings (50–200 mAs).
Signal measurements
Two sets of signal to noise measurements were made,
for the water and PTFE inserts.
For the water measurements thin rubber sheaths were
inserted into each of the five holes in the phantom and
distilled water was inserted into each of the sheaths and
the ends were secured with plastic clips. The sheaths were
similar in diameter to the holes in the phantom which
made it possible to almost completely fill the holes with
water. The set up of the phantom for the water
measurements is shown in Figure 3.
For the PTFE measurements each individual rod was
manufactured in house from a single PTFE rod
(Barkston Plastics Ltd, Leeds, UK). All five rods were
manufactured from the same batch of PTFE to ensure that
there was no difference in composition between the
individual rods.
For each set of measurements the phantom was scanned
five times at each pitch setting with and without CARE
Dose. For each scan the mean CT number and p of the
water/PTFE and PMMA were recorded at each measure-
ment position on the central slice in addition to the mean
CT number of air at the standard position.
Measurements were also repeated 10 times on one scan
of the PTFE rods in order to establish the repeatability of
the measurements.
Figure 3. The phantom as set up for the water signal to noise
ratio (SNR) measurements.
G R Iball, D S Brettle and A C Moore
64 The British Journal of Radiology, January 2006](https://image.slidesharecdn.com/026britishjournalofradiology-britishinstituteofradiology-2006-130913065550-phpapp02/75/British-Journal-of-Radiology-British-Institute-of-Radiology-2006-eng-68-2048.jpg)


![significance using the Kruskal–Wallis test. The mean and
standard deviations of the CT numbers and SNRs and the
resulting p-values are shown on Table 3. These results
show that there were no significant differences, at the 95%
level, in CT number or SNR between the scans with and
without CARE Dose despite the SNRs generally being
decreased when CARE Dose was used.
Discussion
Significant reductions in absorbed dose to air were
found in all five positions in the phantom for the scans
with CARE Dose relative to the constant tube current
situation (Figure 4). The largest reductions, up to 42%,
were found in the top, bottom and central positions as
these positions lie on the lowest attenuation paths through
the phantom and therefore experience the largest tube
current modulation and reduction in absorbed dose to air.
The dose reductions in the lateral positions, around 8%,
are much smaller in magnitude as the attenuation is at its
highest in these positions which means the tube current
will be at its maximum value. These dose reductions were
smaller than those shown by Kalender et al [5] who found
a 45% ‘‘average’’ dose reduction via direct dose measure-
ment. Kalender used a scan time of 1 s (compared with a
0.5 s scan time in our work) which allowed for a larger
modulation amplitude and therefore a greater dose
reduction than in this study. We also found that the
reduction in the effective mAs values were lower than
those found by Kalender et al, at approximately 25%
compared with 40%. However, Kalender’s work showed
an associated increase in image noise of approximately
10%, which was not found in the first part of this study.
Kalender’s work was performed with a prototype version
of the CARE Dose system which may also explain some of
the differences between those initial results and the results
of this study. Kalender et al [5] measured an average dose
reduction of 45% in the hip phantom with a 3 cm3
ionization chamber similar to that used in this study. This
45% reduction in dose, however, was a straightforward
average of the five measurement points rather than a
volume average (‘‘CTDIvol’’) which was calculated here. A
straightforward average of our results yields a dose
reduction of 30%.
The reduction in ‘‘CTDIvol’’ of approximately 32% was
in good agreement with the relative dose reduction found
by Gies et al [4], who found dose reductions of
approximately 38%, for computer simulations using the
hip phantom. The large reduction in absorbed dose to air
in the central position is of importance as most of the
more radiosensitive organs lie centrally. These results
imply that the reduction in an individual organ dose (with
an associated change in the effective dose) may be larger
than the reduction in the values of ‘‘CTDIvol’’ shown
here. These results have implications for calculating
effective doses in CT as the current Monte Carlo data
sets that are used do not reflect the distribution of dose
within the patient when a tube current modulation system
is used. The large dose reduction in the centre of the
phantom also has significant implications for pelvic scans
of pregnant patients. If CARE Dose was used for these
patients the risk to the fetus may be significantly reduced
relative to scans performed with a constant tube current.
Tack et al [10] showed that when using CARE Dose, the
percentage dose reduction was independent of the initial
effective mAs setting. They used six different mAs settings
between 20 mAs and 100 mAs for chest and abdomen CT
scans. Our results (Figure 6) show that the percentage dose
reduction is approximately constant at a value of around
40% for initial effective mAs values up to 165 mAs. Above
this value the percentage dose reduction increases, to
approximately 50% at 200 mAs. This occurred as the mAs
setting approached the maximum tube current rating for
the tube. The Manufacturers recommend that for extre-
mely large patients, where the mAs setting may be close to
the tube limit, CARE Dose is not used. No measurements
were made to determine whether or not the tube output
varied linearly with mAs so we cannot exclude poor
output linearity with mAs as a possible cause of the results
shown in Figure 6.
The image percentage noise level was not significantly
affected by the application of CARE Dose, as shown in
Figure 7, for the initial set of noise measurements. The
reduction in dose of approximately 8% in the left and right
positions occurs as a result of the integration of the
reduction in tube current over all scan angles as there is no
reduction in the tube current setting in the lateral
projections. Given that there has been a general reduction
in dose across the phantom there should have been an
associated increase in the image percentage noise. No such
increase in image percentage noise was found. Combining
these results and those for the dose measurements shows
that the reductions in absorbed dose to air that were
calculated are net dose savings, i.e. they come with no
significant noise penalty. Previous work [3, 5–7] showed
that dose reductions of 23–45% were possible in the pelvis
region with no significant difference in subjective assess-
ments of image quality.
The slight decrease in the image percentage noise with
pitch setting, for both CARE Dose on and off is thought
to be due to the combined effect of setting a constant
effective mAs value and the magnitude of the over-scan
which is necessary in helical scanning.
For the additional scans with the water inserts there was
an increase in the noise level of approximately 10% for the
scans with CARE Dose on relative to the scans with
CARE Dose off. This was not found to be significant at
the 95% level (p50.099). This 10% increase in noise agrees
Table 3. Calculated mean, standard deviation and p-values for CT number and SNR for water and PTFE
Mean CT number (SD)
for CARE Dose off
Mean CT number (SD)
for CARE Dose on
Mean SNR (SD) for
CARE Dose off
Mean SNR (SD) for
CARE Dose on
p-value
(CT number)
p-value
(SNR)
PTFE 962.4 (4.6) 961.2 (4.5) 44.3 (8.8) 44.9 (8.8) 0.393 0.764
Water 7.0 (3.6) 6.5 (3.3) 7.6 (1.7) 7.0 (1.6) 0.421 0.197
SD, standard deviation, SNR, signal to noise ratio, PTFE, polytetrafluoroethylene.
G R Iball, D S Brettle and A C Moore
68 The British Journal of Radiology, January 2006](https://image.slidesharecdn.com/026britishjournalofradiology-britishinstituteofradiology-2006-130913065550-phpapp02/75/British-Journal-of-Radiology-British-Institute-of-Radiology-2006-eng-72-2048.jpg)
![well Kalender’s work [5]. A similar change in noise was
not found for the scans of the PTFE inserts (p50.727). As
the PTFE provides much greater X-ray attenuation than
water there is less scope for modulation of the tube current
when the PTFE inserts are scanned. As a result the slightly
larger reduction in the reported tube current that was
found when the water inserts were scanned results in a
larger percentage change in noise relative to the scans with
CARE Dose off.
Figures 9 and 10 show that there were differences
between the SNRs calculated for the scans with CARE
Dose on and off. These figures also show that the SNR
varied with position within the phantom. The highest
values of image percentage noise and the lowest values of
SNR were found in the central position which is as
expected from photon path length and reconstruction
theories. For PTFE the SNRs for the scans with CARE
Dose on showed no distinct trend relative to the SNRs for
the scans without CARE Dose. This is in contrast to the
situation for water where the SNRs for the scans with
CARE Dose on were lower than those for the scans with
CARE Dose off for 80% of the total number of scans. This
shows that there is a trend towards decreased SNR for
water when CARE Dose is used.
The larger set of SNR measurements showed a
difference in the SNRs of approximately 10% for water
whilst there was no difference for the PTFE measure-
ments. This is attributable to the similar percentage change
in the noise which was found (Table 2). Statistical analysis
showed that there was no statistically significant difference
in the SNRs for PTFE and water between the situations
with and without CARE Dose (p50.197 for water,
p50.764 for PTFE). Table 3 shows that, at the 95%
level, there was also no significant change in the CT
numbers for water and PTFE for the scans with and
without CARE Dose. Since the SNR depends on both the
signal and noise, neither of which showed a significant
change at the 95% level, there was no associated significant
change in the calculated SNRs for both water and PTFE.
This does not provide an explanation for the users’
subjective opinions that the images acquired with CARE
Dose, for imaging pelvic abscess, were unsatisfactory.
When the SNR values for water are error corrected
(mean value minus uncertainty), the average SNR for the
scans with CARE Dose is only just above the detectability
threshold of 5 as defined by Rose [12]. Water has an
inherently low SNR relative to the PMMA background,
but this is further reduced by 10% when CARE Dose is
activated. The worse case SNR (i.e. the lowest value of
SNR taking into account the calculated uncertainties) was
below the threshold value of 5 for 25% of the measure-
ments with CARE Dose off and for 40% of the
measurements with CARE Dose on. Although these
differences may not be statistically significant they may
be detectable by the person viewing the image and are
therefore important differences.
The X-ray attenuation path in clinical scanning is non-
homogeneous and the human pelvis may have an even
more asymmetric attenuation pattern than this phantom.
This may introduce a larger modulation in the tube
current which would affect the noise and serve to further
worsen the SNR situation. This may therefore reduce the
confidence with which the viewer of the image can detect
tissues which have subtle differences in SNRs. This
combination of the decrease in the water SNR and the
non-homogeneous attenuation path may therefore explain
why subjectively the images that were acquired with
CARE Dose had been reported as unsatisfactory for pelvic
abscess imaging.
There were large uncertainties in the results of this
study. However, the reductions in the SNRs that were
found were repeatable over a large number of scans and
are therefore considered to be a true representation of the
performance of the system. The main explanation for the
large uncertainties was that the ROIs that were used for
the water and PTFE measurements were small – these
were limited by the size of the inserts which were, in turn,
limited by the construction of the phantom. If measure-
ments were made too close to the edge of the insert then
the mean CT number would have been skewed by the
presence of any air around the insert or by the background
material itself. It was not possible to make any changes to
the phantom design. If it had been possible to use larger
inserts (and therefore larger ROIs) it may have been
possible to obtain results which were less error dominated.
We would recommend that any future studies should
consider using larger inserts and ROIs to improve the
noise statistics and to ensure homogeneity in the
measurements taken within the signal areas. However, it
should be noted that at 12 mm in diameter the size of the
water inserts were representative of abscesses which are
found in the pelvis.
Some differences were found between the results for the
left and right lateral positions in the phantom, in terms of
absorbed dose to air, noise and SNR for both inserts.
Further tests showed that the central alignment laser was
inaccurate by approximately 3 mm which resulted in a
relative difference between the left and right
measurement positions of around 6 mm and that the
differences were not due to the performance of the CARE
Dose system.
Conclusions
The CARE Dose system on Siemens 4 slice CT scanners
results in significant dose savings for scans of the pelvic
region. This yielded a reduction of approximately 32% in
the value of ‘‘CTDIvol’’ which agreed well with the 25%
reduction in the displayed effective mAs. This implies that
the reduction in the effective mAs value can be used as an
approximate indicator of the true dose reduction. This
reduction is a real, net dose saving as there was no
statistically significant increase in the noise.
There appears to be a trend towards decreased SNRs
for both water and PTFE when CARE Dose was used
although no significant differences were found at the 95%
level. These changes in SNR were mostly due to changes
in the image percentage noise values. The largest
decreases in SNR were found for water and were as
large as 14%. Since the water inserts were representative of
low-density abscess this suggests that the use of CARE
Dose may decrease the visibility of low-density
structures relative to the background. Therefore using
CARE Dose in situations where subtle differences in low
CT number tissue pathology are of interest may not be
advisable.
Assessment of tube current modulation
69The British Journal of Radiology, January 2006](https://image.slidesharecdn.com/026britishjournalofradiology-britishinstituteofradiology-2006-130913065550-phpapp02/75/British-Journal-of-Radiology-British-Institute-of-Radiology-2006-eng-73-2048.jpg)

![Short communication
Radiosurgical palliation of aggressive murine SCCVII
squamous cell carcinomas using synchrotron-generated X-ray
microbeams
1
M MIURA, PhD, 2
H BLATTMANN, PhD, 3
E BRA¨ UER-KRISCH, BEng, 3
A BRAVIN, PhD,
1
A L HANSON, PhD, 1
M M NAWROCKY, BA, 1
P L MICCA, BS, 1,4
D N SLATKIN, MD and
4
J A LAISSUE, MD
1
Medical Department, Brookhaven National Laboratory, Upton, NY 11973-5000, USA, 2
Niederwiesstrasse 13C,
Untersiggenthal, Switzerland, 3
European Synchrotron Radiation Facility, 6 Rue Jules Horowitz, BP 220, Grenoble,
France and 4
Pathologisches Institut der Universita¨t Bern, Murtenstrasse 31, Bern, Switzerland
Abstract. Microbeam radiosurgery (MBRS), also referred to as microbeam radiation therapy (MRT), was tested
at the European Synchrotron Radiation Facility (ESRF). The left tibiofibular thigh of a mouse bearing a
subcutaneously (sc) implanted mouse model (SCCVII) of aggressive human squamous-cell carcinoma was
irradiated in two orthogonal exposures with or without a 16 mm aluminium filter through a multislit collimator
(MSC) by arrays of nearly parallel microbeams spaced 200 mm on centre (oc). The peak skin-entrance dose
from each exposure was 442 Gy, 625 Gy, or 884 Gy from 35 mm wide beams or 442 Gy from 70 mm wide
beams. The 442/35, 625/35, 884/35 and 442/70 MBRSs yielded 25 day, 29 day, 37 day and 35 day median
survival times (MST) (post-irradiation), respectively, exceeding the 20 day MST from 35 Gy-irradiation of
SCCVIIs with a seamless 100 kVp X-ray beam.
A century ago, radiotoxic doses of X-rays delivered
through a flexible grid of 1 mm thick strands of iron
woven 3.5 mm on centre and a thin, continuous underlay
of leather (a low-Z filter), pressed hard against the skin to
blanch it, were able to palliate deep malignancies safely;
iron-shielded epidermal cells healed the resultant punctate
skin burns within 2 weeks [1]. After half a century, such
millimetre-scale grid therapy (GT) was generally super-
seded by skin-sparing megavoltage radiotherapy, although
at least one centre is currently pursuing a version of GT
clinically [2].
It was, however, the radiobiological studies in mice,
which used a deuteron microbeam to simulate cosmic
radiation in space [3] that led to microbeam radiosurgery
(MBRS) investigations, GT’s micrometre-scale analogue.
The MBRS studies have continued since ,1990 using
,200–800 Gy doses of ,30–200 keV X-rays delivered
almost instantaneously through an array of multiple nearly
parallel microslices of tissues [4–13]. Putatively, MBRS
irreparably damages microsegments of neoplastic but not
of normal endothelium; surviving clonogenic tumour cells
may be insufficiently perfused and too sparse to re-grow.
Imminently lethal intracerebral rat 9L gliosarcomas
have been palliated with 25 mm wide microbeams, 100 mm
on centre (oc). About 4 months later when untreated
controls had long been euthanized for tumour overgrowth,
50%, 18%, or 36% of rats remained alive after crossfired
625 Gy, crossfired 312 Gy, or unidirectional 625 Gy skin-
entrance doses, respectively [7].
Despite its weak immunogenicity [14] and robust
radioresistance [15], the deadly aggressive squamous-cell
carcinoma (SCCVII) can be ablated either by immu-
notherapy [16] or by X-irradiation using a radiosensitizer
[17]. However, the outcome of an experimental therapy for
the murine SCCVII carcinoma is generally informative in
terms of growth delay rather than ablation [18, 19].
Accordingly, we compared SCCVII growth delays and
their normal-tissue radiotoxicities following different
MBRS strategies to enable future ranking of various
proposed clinical MBRS treatment plans.
Material and methods
Radiation source
MBRS was performed at the ID17 beamline of the
European Synchrotron Radiation Facility (ESRF), a
6 GeV electron storage ring with an operating current of
180–200 mA. Beamline ID17 is equipped with a 1.6 T
wiggler, which produces a beam of X-rays [20, 21] with a
median energy of 38.1 keV. The beam is filtered with
1.5 m each of C and Al followed by 1.0 mm Cu. This
filtration hardened the spectrum to 93 keV at maximum
intensity, suitable for MBRS. The beam emerged from the
beam pipe through a beryllium window to air in the
Received 7 January 2005 and in revised form 2 June 2005, accepted 16
June 2005.
This manuscript has been sponsored by Brookhaven Science
Associates, LLC under Contract No. DE-AC02-98CH10886 with
the United States Department of Energy. The US Government
retains, and the publisher, by accepting the article for publication,
acknowledges, a world-wide license to publish or reproduce the
published form of this manuscript, or allow others to do so, for the
US Government purposes. Funding was provided by the DOE Office
of Biological and Environmental Research, the Institute of Pathology
of the University of Bern, and the European Synchrotron Radiation
Facility.
The British Journal of Radiology, 79 (2006), 71–75 E 2006 The British Institute of Radiology
DOI: 10.1259/bjr/50464795
71The British Journal of Radiology, January 2006](https://image.slidesharecdn.com/026britishjournalofradiology-britishinstituteofradiology-2006-130913065550-phpapp02/75/British-Journal-of-Radiology-British-Institute-of-Radiology-2006-eng-75-2048.jpg)
![radiation-shielded ID17 irradiation hutch, where it was
collimated to 18 mm60.5 mm.
Collimator and irradiations
The microbeams were created with a variable width
tungsten multislit collimator (MSC) (Tecomet, Woburn,
MA) before impinging on the animal [13]. For MBRS, the
anaesthetized mouse was placed prone, lengthwise, on the
15 cm61.5 cm surface of a 15 cm66.5 cm61.5 cm
PlexiglasH block, each foreleg and the left, tumour-bearing
hind leg gently taped to the sides of the block (Figure 1).
The first exposure (of the entire tumour-bearing left
tibiofibular thigh) was nearly anteroposterior, with the
mouse saddle rotated 5˚ clockwise (from the horizontal 0˚
reference direction of the oncoming beam) about a vertical
axis (as seen by an observer looking downward toward the
mouse, Figure 2) to avoid irradiating the left foreleg; the
second (orthogonal) exposure was implemented after the
block was rotated 95˚ clockwise from the 0˚ reference
direction about the same vertical axis. Although each of
the two 16 mm broad, 15 mm high anatomical (skin-
entrance) targets had its estimated vertical and horizontal
midplane at the estimated level of the centre of the tumour,
the actual upper horizontal limit of each target was parallel to
and 1 mm below the long edge of the block’s upper surface.
The right hind leg had been taped slightly backward to avoid
exposure to microbeams during the second exposure. For
each irradiation, a computer-guided platform moved the
mouse directly upward (at several cm s21
) past the
microbeam array emerging from the MSC. The shutter-
activated exposure time was selected to conform to the slowly
decaying ring current and the pre-programmed upward
acceleration and speed of the platform.
Animal tumour model
SCCVII murine squamous cell carcinoma cells (Prof.
J Martin Brown, Stanford University) were cultured in
D-MEM enriched with 10% fetal bovine serum, 1%
penicillin/streptomycin, and 1% L-glutamine. Only pas-
sages 1–3 were used to initiate tumours. Cells (26105
in
0.05 ml of medium) were then implanted subcutaneously
(sc) into the left thighs of 20–25 g female C3H mice
(Taconic Farms, Germantown, NY or Charles River
Laboratories, Wilmington, MA). Alternatively, freshly
removed ,1 mm3
fragments of mouse tumours that had
been initiated sc on the dorsal thorax with 56105
cells in
0.1 ml of medium [22] were minced in saline, then
implanted sc in the left thighs through a 16-gauge
trocar. All MBRS-irradiated tumours and 16 of the 40
untreated control tumours grew from cell suspensions. Our
preliminary studies had shown that growth rates using cell
suspensions were the same as those using tumour
fragments; the former are preferred because the suspended
cells do not seem to form satellite tumours along the trocar
track when implanted. Mice bearing ,80–100 mg tumours
(as estimated from volume x2
y/2, where x , y) were
anaesthetized (0.01 ml per gram of body weight (gbw) of
an aqueous 6 mg ml21
sodium pentobarbital solution) by
intraperitoneal injection, (,60 mg gbw21
) for MBRS.
Mice were irradiated 10 days after tumours were implanted.
Median survival times (MST) are defined as the time interval
between the day the treated groups were irradiated, which is
equivalent to 10 days after tumour implantation, and the day
they were euthanized unless otherwise stated.
Therapy studies
Single-exposure irradiations were used throughout.
Tumour dimensions were measured 2–3 times per week
and mice were euthanized either when estimated tumour
volumes exceeded 500 mm3
or when skin ulceration or
severe oedema (foot diameter . 5 mm) was observed.
Mice were weighed whenever the tumours were measured,
except during the first week after irradiation, when they
were weighed daily.
100 kVp seamless X-rays
In three groups of anaesthetized mice placed prone on
a horizontal surface, tumours were X-irradiated at
2.10 Gy min21
vertically downward, delivering 25 Gy or
Figure 1. Photograph of anaesthetized female C3H mouse
bearing a leg squamous-cell carcinoma (SCCVII) carcinoma
taped to PlexiglasH block, readied for microbeam radiosurgery
(MBRS) at the European Synchrotron Radiation Facility
(ESRF).
Figure 2. A PlexiglasH polymethylmethacrylate block (thick
black outline) served as a ‘‘saddle’’ for the mouse, viewed as it
would be by an observer directly above it. The mouse was
anaesthetized and placed prone on the block for its first
tumour irradiation. In this figure, the outline of the mouse is
represented by an ellipse. Two black dots represent its eyes. To
avoid irradiating its left foreleg, the 150 mm long axis of the
block was rotated 5˚ (about a vertical axis through the centre
of the block) clockwise from the reference 0˚ microbeam direc-
tion. The microbeam array, symbolized by thin arrows, was
propagated in a thin, wide, slightly divergent fan-beam, sub-
stantially in a horizontal plane, represented here as the plane
of this page. The second irradiation was implemented after the
block was rotated 95˚ clockwise from the 0˚ reference direction
about the same vertical axis.
M Miura, H Blattmann, E Bra¨uer-Krisch et al
72 The British Journal of Radiology, January 2006](https://image.slidesharecdn.com/026britishjournalofradiology-britishinstituteofradiology-2006-130913065550-phpapp02/75/British-Journal-of-Radiology-British-Institute-of-Radiology-2006-eng-76-2048.jpg)
![35 Gy. A Philips RT-100 generator was operated at
100 kVp and 8 mA with a 0.4 mm thick Cu filter, a 10 cm
focus-to-skin distance, and a 2.5 cm collimator aperture in
contact with the thigh. Radiation dosimetry was carried
out using an air-equivalent thimble ionization chamber,
adhering to the 1996 IPEB code of practice for 10–
300 kVp, Cu-filtered X-rays [23].
Irradiation groups
The rapidly growing SCCVII cancers were treated in a
clinically analogous way, i.e. after the tumours became
palpable, which took 7 days after implantation (volumes
¢50 mm3
). They were then sorted into groups bearing
tumours of comparable size and were irradiated 3 days
later, 1 day after they arrived at the ESRF.
Microbeam widths were either 35 mm or 70 mm and the
on centre (oc) distances for each of the treatment groups
were 200 mm. Groups 1, 2 and 3 were irradiated at skin-
entrance doses of 442 Gy, 625 Gy, and 884 Gy, respec-
tively, using 35 mm microbeam widths in each direction.
Group 4 was similarly irradiated to Group 3 (884 Gy) but
with a 16 mm aluminium filter upstream from the
collimator. Group 5 was irradiated at a skin-entrance
dose of 442 Gy with 70 mm microbeam widths in each
direction and Group 6 was similarly irradiated but with
the 16 mm aluminium filter. The control group comprised
40 untreated SCCVII tumour-bearing mice from five
separate experiments.
Results
100 kVp seamless X-irradiation at 25 Gy and 35 Gy
yielded MSTs of 14 days and 20 days, but long-term
survivals were only 0/10 and 1/9, respectively (Figure 3a).
Untreated controls had a MST of only 6 days or a median
post-implantation survival time of 16 days.
MBRS survival data are shown in Figure 3b. Figure 4
shows average growth rates of various irradiated and
control SCCVIIs. In Groups 1 and 2, euthanasia was
usually for tumour overgrowth (volume ¢500 mm3
); in
Groups 3–6, it was mainly for foot/leg damage (severe
oedema; diameter of the foot .5 mm) (Table 1). Figures 3
and 4 do not distinguish those reasons for euthanasia.
Euthanasia necessitated by skin radiotoxicity probably
prevented much longer survivals of the third of 884/35 and
442/70 MBRS mice that showed no residual tumour at
necropsy.
MBRS yielded long-term survival rates (up to 153 days)
of 0/12 in Groups 1 and 2, 1/10 in Group 3, and 0/10 in
Groups 4, 5, and 6. Group 3 (884/35 without aluminium)
showed the highest median survival time, and only 1/10
was euthanized for tumour overgrowth; but 8/10 were
euthanized for foot/leg damage and only 1 of those 8
Figure 3. Kaplan-Meier graphs of C3H mice bearing aggressive squamous-cell carcinoma (SCCVII) leg carcinomas irradiated with
various radiation modalities. The on-centre distances for microbeam radiosurgery (MBRS)-irradiations were 200 mm. Mice euthanized
due to foot/leg damage were not distinguished from those euthanized due to tumour overgrowth: (a) Survival graphs of mice bearing
SCCVII carcinomas treated with seamless 25 Gy or 35 Gy skin-entrance doses of X-rays in comparison with unirradiated controls.
(b) Survival graphs of similar mice in MBRS groups (1–6) with skin entrance doses of 442 Gy, 625 Gy, and 884 Gy at 35 mm and
442 at 70 mm beam width. ‘‘Al’’ designates a 16 mm-thick aluminium filter placed upstream from the collimator.
Figure 4. Average relative tumour volumes of the various
microbeam radiosurgery (MBRS)-irradiated and control mice.
The lower tumour volumes noted in groups 3 to 6 relate to the
fact that those tumours had regressed to relatively small or
undetectable volumes when most of the mice had to be eutha-
nized due to severe radiodermatitis of the inner thigh.
Short communication: MBRS for murine SCCVII carcinomas
73The British Journal of Radiology, January 2006](https://image.slidesharecdn.com/026britishjournalofradiology-britishinstituteofradiology-2006-130913065550-phpapp02/75/British-Journal-of-Radiology-British-Institute-of-Radiology-2006-eng-77-2048.jpg)
![showed no tumour at necropsy (Table 1). In contrast, in
Group 5 (442/70 without aluminium), 9/10 mice were
euthanized due to severe foot/leg damage, of which 4/9
euthanized mice (two each on days 27 and 31) showed no
residual tumour at necropsy. On those same days (27 and
31) in Group 3, seven and four mice, respectively, had no
tumours, indicating that the lower incidence of tumours in
Group 5 compared with Group 3 was due to the earlier
time of euthanasia.
Some non-parametric Wilcoxon Two-Sample analyses
to rank palliation rates, using a morbidity/mortality index
technique [24] on days 9 and 23, before foot/leg damage
became apparent, are shown in Table 2. Without regard to
radiodermatitis, Group 3 (884 Gy) followed by Group 5
(442/70, showed the most effective tumour palliation,
which was expected from the survival graphs (Figure 3b)
and because they received the highest tumour ionization
energies.
Discussion
Figures 3 and 4, and Table 1, demonstrate that MBRS
delayed tumour growth more than did seamless 100 kVp
X-rays and that the former effect is dose-dependent.
However, in the higher dose groups, the plotted growth
rates after day 40 are based on only a few animals, as
many mice had to be euthanized due to radiodermatitis.
The MSTs of each MBRS-treated group were longer than
were the 14 day and 20 day MSTs observed for the
seamless 25 Gy or 35 Gy groups, respectively.
Normal tissue damage occurred more quickly in mice
irradiated with the broader microbeams imparting less
energy per beam (442/70) than in the group with the
narrower microbeam imparting greater energy per beam
(884/35). The radiation field of the SCCVII carcinoma
on the mouse leg encompassed the entire thigh, but not
the foot (Figure 1). Radiodermatitis was most marked in
the inner thigh and oedema was most severe in the left
hind foot below the irradiation field. We attribute the
latter to ablation of overirradiated lymphatics
proximal to the foot. At the higher radiation doses, such
damage limited survival time more than did tumour
overgrowth.
The radiodermatitis of the inner thigh was explained
with microdosimetry simulations using the MCNPX code
[25]. The simulations were performed assuming a water
phantom of the left mouse thigh, shaped as an
inverted, truncated cone (16 mm high with a 13 mm
diameter top and a 3 mm diameter bottom) in which a
0.4 mm diameter sphere of water, the phantom tumour,
was embedded. Computations showed that doses between
the microbeams (‘‘valley doses’’) in the epidermis adjoining
the PlexiglasH would have been ,25% less without
contributions from back-scattered X-rays. Even at
1.5 mm from the PlexiglasH, the dose would have been
reduced ,15% if the PlexiglasH was not present.
Conclusions
Palliation of the exceptionally radioresistant murine
SCCVII carcinoma was better from MBRS than from
seamless 35 Gy irradiation with no more risk to normal
tissue in the radiation field. Normal-tissue damage in the
higher-dose MBRS groups, especially to the left foot
Table 1. Number of ablated tumours, median survival times and explanations for euthanasia in mice treated with microbeam radio-
surgery (MBRS) tracked up to 153 days after irradiation compared with those treated with seamless X-rays and with
untreated controls
Group Dose/beam width
(MBRS)
Number
of mice
153-d tumour
control
Post-irradiation
median survival
time (days)
Euthanized (tumour
overgrowth)
Euthanized
(foot/leg damage)
Euthanized
(foot/leg damage)
mice with tumours
1 442 Gy/35 mm 12 0 25 11 1 1
2 625 Gy/35 mm 12 0 29 9 3 2
3 884 Gy/35 mm 10 1 41 1 8 7
4 884 Gy/35 mm +
aluminium filter
10 0 33 3 7 5
5 442 Gy/70 mm 10 0 38 1 9 5
6 442 Gy/70 mm +
aluminium filter
10 0 31 1 9 6
Unirradiated control 40 0 6 40 0 –
25 Gy seamless 10 0 14 10 0 0
35 Gy seamless 9 1 20 8 0 0
Table 2. p-values from the non-parametric Wilcoxon Two-Sample Test on tumour volumes using morbidity/mortality indices [24] on
days 9 and 23 after irradiationa
Group Days after irradiation 625/35 (2) 884/35 (3) 884/35+Al (4) 442/70 (5) 442/70+Al (6)
442/35 (1) 9 0.011 0.001 0.003 0.036
442/35 (1) 23 0.001 0.001 0.017 0.001 0.004
625/35 (2) 23 0.017
a
Differences between one group (numbered in parentheses) in the top row and another numbered in the left column were deemed
significant if p ¡ 0.05, in which case that column shows the group with the better tumour palliation. No other pairs of groups showed
an advantage in palliation that was significant at the p ¡ 0.05 level.
M Miura, H Blattmann, E Bra¨uer-Krisch et al
74 The British Journal of Radiology, January 2006](https://image.slidesharecdn.com/026britishjournalofradiology-britishinstituteofradiology-2006-130913065550-phpapp02/75/British-Journal-of-Radiology-British-Institute-of-Radiology-2006-eng-78-2048.jpg)
![below the radiation field, could be deemed clinically
irrelevant as most of that damage was anatomically remote
from the cancer in structures that would have been spared
high doses under clinical circumstances. Left foot oedema
probably resulted from radiation-induced strictures of
proximal blood vessels and lymphatics. Thus our compu-
tations suggest that MBRS of such SCCVII tumours using
similar skin-entrance doses without the irradiated skin in
contact with the PlexiglasH may enable a greater propor-
tion of mice to survive long-term.
Acknowledgments
The authors thank Mr Seymour Brittman of Brittman
Son, East Northport, New York, for constructing the
ventilated hardwood cases to enclose mouse cages for
intercontinental air transportation. We also thank Mr
Larry McMillan of Swiss International Airlines and his
coworkers for facilitating our air travel with mice at the
JFK Airport.
References
1. Ko¨hler A. Zur Ro¨ntgentiefentherapie mit Massendosen.
Mu¨nchener medizinische Wochenschrift 1909;56:2314–6.
2. Zwicker RD, Meigooni A, Mohiuddin M. Therapeutic
advantage of grid irradiation for large single fractions. Int
J Radiat Oncol Biol Phys 2004;58:1309–15.
3. Curtis HJ. The microbeam as a tool in radiobiology. Adv Biol
Med Phys 1963;175:207–24.
4. Slatkin DN, Spanne P, Dilmanian FA, Sandborg M.
Microbeam radiation therapy. Med Phys 1992;19:1395–400.
5. Slatkin DN, Dilmanian FA, Nawrocky MM, Spanne P,
Gebbers J-O, Archer DW, et al. Design of a multislit,
variable-width collimator for microplanar beam radiotherapy.
Rev Sci Instr 1995;66:1346–7.
6. Slatkin DN, Spanne P, Dilmanian FA, Gebbers J-O, Laissue
JA. Subacute neuropathological effects of microplanar beams
of x-rays from a synchrotron wiggler. Proc Natl Acad Sci
USA 1995;92:8783–7.
7. Laissue JA, Geiser G, Spanne PO, Dilmanian FA, Gebbers
J-O, Geiser M, et al. Neuropathology of ablation of rat
gliosarcomas and contiguous brain tissues using a micro-
planar beam of synchrotron-wiggler-generated X rays. Int J
Cancer 1998;78:654–60.
8. Dilmanian FA, Morris GM, Zhong N, Bacarian T, Hainfeld
JF, Kalef-Ezra J, et al. Murine EMT-6 carcinoma: high
therapeutic efficacy of microbeam radiation therapy. Radiat
Res 2003;159:632–41.
9. Schweizer PM, Spanne P, Di Michiel M, Jauch U,
Blattmann H, Laissue JA. Tissue lesions caused by micro-
planar beams of synchrotron-generated X-rays in Drosophila
melanogaster. Int J Radiat Biol 2000;76:567–74.
10. Laissue JA, Lyubimova N, Wagner H-P, Archer DW, Slatkin
DN, Di Michiel M, et al. Microbeam radiation therapy, in
medical applications of penetrating radiation. In: Bradford
Barber H, Roehrig H, editors. Proceedings of SPIE
1999;3770:38–45.
11. Laissue JA, Blattmann H, Di Michiel M, Slatkin DN,
Lyubimova N, Guzman R, et al. The weanling piglet
cerebellum: a surrogate for tolerance to MRT (microbeam
radiation therapy) in pediatric neuro-oncology. In: Bradford
Barber H, Roehrig H, Doty FP, Schirato RC, Morton EJ,
editors. Penetrating radiation systems and applications III.
Proceedings of SPIE 2001;4508:65–73.
12. Blattmann H, Burkard W, Djonov V, Di Michiel M, Brauer
E, Stepanek J, et al. Microbeam irradiation of the chorio-
allantoic membrane (CAM) of chicken embryo. Strahlenther
Onkol 2002;178:118.
13. Bra¨uer-Krisch E, Bravin A, Zhang L, Siegbahn E, Stepanek
J, Blattmann H, et al. Characterization of a tungsten/gas
multislit collimator [TMSC] for microbeam radiation therapy
at the European Synchrotron Radiation Facility. Rev Sci
Instr 2005;76:0643031–7.
14. Kanazawa H, Rapacchietta D, Kallman RF. Schedule-
dependent therapeutic gain from the combination of fractio-
nated irradiation and cis-diamminedichloroplatinum(II) in
C3H/Km mouse model systems. Cancer Res 1988;48:3158–64.
15. Suit H, Allam A, Allalunis-Turner J, Brock W, Girinsky T,
Hill S, et al. Is tumor cell radiation resistance correlated with
metastatic ability? Cancer Res 1994;54:1736–41.
16. Mandpe AH, Tsung K, Norton JA. Cure of an established
nonimmunogenic tumor, SCC VII, with a novel interleukin
12-based immunotherapy regimen in C3H mice. Arch
Otolaryngol Head Neck Surg 2003;129:786–92.
17. Nakajima S, Fujii T, Murakami N, Aburano T, Sakata I, Nakae
Y, et al. Therapeutic and imaging capacity of tumor-localizing
radiosensitive Mn-porphyrin KADT-F10 for SCCVII tumors
in C3H/He mice. Cancer Lett 2002;181:173–8.
18. Ning S, Yu N, Brown DM, Kanekal S, Knox SJ.
Radiosensitization by intratumoral administration of cisplatin
in a sustained-release drug delivery system. Radiother Oncol
1999;50:215–23.
19. Katori K, Baba Y, Imagawa Y, Nishimura G, Kagesato,
Takagi E, et al. Reduction of in vivo tumor growth by MMI-
166, a selective matrix metalloproteinase inhibitor, through
inhibition of tumor angiogenesis in squamous cell carcinoma
cell lines of head and neck. Cancer Lett 2002;178:151–9.
20. Thomlinson W, Berkvens P, Berruyer G, Bertrand B,
Blattmann H, Bra¨uer-Krisch E, et al. Research at the
European Synchrotron Radiation Facility medical beamline.
Cell Mol Biol 2000;46:1053–63.
21. Bra¨uer-Krisch E, Bravin A, Lerch M, Rosenfeld A,
Stepanek J, Di Michiel M, et al. MOSFET dosimetry for
microbeam radiation therapy at the European Synchrotron
Radiation Facility. Med Phys 2003;30:583–9.
22. Fu KK, Rayner PA, Lam KN. Modification of the effects of
continuous low dose rate irradiation by concurrent
chemotherapy infusion. Int J Radiat Oncol Biol Phys
1984;10:1473–8.
23. Klevenhagen SC, Aukett RJ, Harrison RM, Moretti C,
Nahum AE, Rosser KE. The IPEMB code of practice for the
determination of absorbed dose for x-rays below 300 kV
generating potentials (0.035 mm Al-4 mm Cu HVL;
10-300 kV generating potential). Phys Med Biol
1996;41:2605–25.
24. Coderre JA, Slatkin DN, Micca PL, Ciallella JR. Boron
neutron capture therapy of a murine melanoma with p-
boronphenylalanine: dose-response analysis using a morbidity
index. Radiat Res 1991;128:177–85.
25. Los Alamos National Laboratory Report LA-UR-03-5916;
August, 2003.
Short communication: MBRS for murine SCCVII carcinomas
75The British Journal of Radiology, January 2006](https://image.slidesharecdn.com/026britishjournalofradiology-britishinstituteofradiology-2006-130913065550-phpapp02/75/British-Journal-of-Radiology-British-Institute-of-Radiology-2006-eng-79-2048.jpg)
![Case report
Solitary pulmonary nodule with growth and contrast
enhancement at CT: inflammatory pseudotumour as an
unusual benign cause
1
S DIEDERICH, Prof. Dr. med., 2
D THEEGARTEN, Priv. Doz. Dr. med., 3
G STAMATIS, Prof. Dr. med. and
4
R LU¨ THEN, Priv. Doz. Dr. med.
1
Department of Diagnostic and Interventional Radiology, Marien Hospital, Academic Teaching Hospital, Rochusstr. 2,
D-40479 Du¨sseldorf, 2
Institute of Pathology, BG-Kliniken Bergmannsheil, Ruhr University Bochum, 3
Department of Thoracic
Surgery and Endoscopy, Ruhrland Hospital Essen and 4
Department of Medicine, Marien Hospital Du¨sseldorf, Germany
Abstract. Small (¡10 mm) pulmonary nodules are frequently detected at modern chest CT. As most of these
nodules are benign, non-invasive classification is required – usually based on assessment of growth and
perfusion. Absence of growth and no evidence of perfusion, as demonstrated by lack of enhancement at
contrast-enhanced CT or MRI, strongly suggest a benign nodule. On the other hand, growth with a doubling of
the nodule’s volume between 20 days and 400 days or enhancement suggest a malignant nature of the lesion. We
present an example of a nodule with strong contrast enhancement and a doubling time of approximately 260
days, which histologically represented a benign inflammatory pseudotumour.
Case report
A 56-year-old asymptomatic male underwent chest
radiography in two views as part of a general health
survey. This revealed a small non-calcified nodule
projected over his right mid lung field not demonstrated
on a chest radiograph obtained 3 years previously. CT of
the chest (collimation 5 mm) confirmed a non-calcified
nodule in the lateral segment of the right middle lobe
adjacent to a subsegmental artery and bronchus with a
diameter of approximately 9 mm. No other abnormality
was demonstrated, in particular no hilar or mediastinal
lymphadenopathy was observed.
The patient presented to our hospital for a second
opinion 3 months later. Evaluation of size and contrast-
enhancement was performed obtaining limited spiral CT
data sets with a collimation of 1 mm (Somatom Plus 4;
Siemens, Erlangen, Germany) before and 1 min, 2 min,
3 min and 4 min after administration of 1.4 cm3
kg21
body weight iomeprerol (Imeron 300H
; Altana Pharma,
Konstanz, Germany) with an injection rate of 2 cm3
s21
.
Images were displayed at lung and mediastinal windows
(Figure 1a, b, c). Nodule density was measured in regions
of interest representing 70% of the nodule’s cross section
at anatomically identical levels. Density was 27 Hounsfield
Units (HU) before contrast injection and increased to
80 HU, 95 HU, 63 HU and 62 HU after 1 min, 2 min,
3 min, and 4 min. Thus, maximum enhancement after
2 min was 68 HU. The diameter of the nodule was again
measured to be 9 mm (Figure 1a).
It has been shown that lack of contrast-enhancement
almost excludes malignancy with a negative predictive
value of 96%, whereas demonstration of contrast-enhance-
ment allows no differentiation between benign and
malignant nodules [1]. Thus, the patient was informed
that malignancy could not be excluded and biopsy was
recommended. Due to the central location of the relatively
small nodule adjacent to a subsegmental artery, it was felt
that percutanous biopsy was not appropriate and surgical
biopsy was suggested. The patient, however, did not agree
to immediate biopsy. Therefore, follow-up thin section CT
with 1 mm slice thickness was performed at 6 months and
10 months. There was questionable growth at 6 months
and definite growth at 10 months (Figure 2). The nodule’s
volume was calculated from measurements digitally on the
monitor of a workstation in the axial plane and also by
counting the number of contiguous 1 mm slices for
estimation of the diameter in craniocaudad direction. As
the nodule appeared almost ideally spherical at the
baseline measurement (9 mm) and at 10 month follow-
up (12 mm) its volume was calculated (V54/3 p r3
) as
381 mm3
(baseline measurement) and 904 mm3
(10
months) resulting in a doubling time of 8.6 months.
Again surgical biopsy was recommended and now the
patient agreed.
As the nature of the nodule could not be established
prior to surgery it was decided to proceed to minimally
invasive thoracotomy. During surgery a tumour measuring
18 mm624 mm adjacent to the medial segmental
bronchus of the middle lobe was palpated rendering
wedge resection impossible. Due to the small volume of
the middle lobe, primary middle lobectomy was performed
including resection of regional lymph nodes. Final
histological assessment of the well-circumscribed lesion
(Figure 3) including immunostaining for CD-1a, CD-3,
CD-20, CD-68, and EMA showed a mixed inflammatory
infiltrate and connective tissue typically for a benign
inflammatory pseudotumour (Figure 4a). Diagnosis of a
malignant tumour could not be confirmed. Several vessels
were demonstrated within the nodule (Figure 4b). The
Received 24 February 2005 and in revised form 18 April 2005, accepted
29 April 2005.
The British Journal of Radiology, 79 (2006), 76–78 E 2006 The British Institute of Radiology
DOI: 10.1259/bjr/97645635
76 The British Journal of Radiology, January 2006](https://image.slidesharecdn.com/026britishjournalofradiology-britishinstituteofradiology-2006-130913065550-phpapp02/75/British-Journal-of-Radiology-British-Institute-of-Radiology-2006-eng-80-2048.jpg)
![post-operative course was unremarkable and the patient
was discharged from hospital after 8 days.
Discussion
Pulmonary nodules are common findings at chest radio-
graphy and even more at chest CT. With the introduction
of spiral CT, and particularly multirow-detector spiral CT,
an increasing number of small nodules (¡10 mm) is
detected. The ratio of benign and malignant nodules
strongly depends on nodule size. In nodules .10 mm the
proportion of malignant nodules is high requiring biopsy
in many cases [2]. In nodules ¡10 mm more than 90% of
nodules are benign [3]. Therefore, biopsy is not routinely
performed in these lesions and non-invasive diagnostic
tests are required to differentiate between benign and
malignant nodules.
The two techniques used routinely are analysis of nodule
growth and perfusion. It has been shown that most
malignant tumours exhibit doubling times between 20 days
and 400 days, whereas faster or slower doubling times
suggest benign lesions [4, 5].
Also, assessment of tumour perfusion is helpful in
predicting a nodule’s nature. As malignant tumours
.1 mm require neoangiogenesis for further growth, all
malignant tumours visible at chest CT should exhibit
enhancement at contrast-enhanced CT or MRI [1].
It has been shown that absence of contrast enhancement
strongly predicts the benign nature of a nodule (e.g.
granuloma); on the other hand, not all enhancing nodules
are malignant due to enhancing benign lesions such as
inflammatory nodules or intrapulmonary lymph nodes
[1, 6, 7].
(a) (b) (c)
Figure 1. Dynamic thin-section CT scan before ((a) lung window, (b) mediastinal window) and 2 min after ((c) mediastinal window)
contrast enhancement: The nodule shows an enhancement of 68 Hounsfield units.
Figure 2. Follow-up thin-section CT scan after 10 months
revealing growth of the nodule to 12 mm.
Figure 3. Histological slide showing the nodule with focal
sclerosis (Haematoxylin and eosin, magnification62).
Case report: Pulmonary nodule with contrast enhancement and growth at CT
77The British Journal of Radiology, January 2006](https://image.slidesharecdn.com/026britishjournalofradiology-britishinstituteofradiology-2006-130913065550-phpapp02/75/British-Journal-of-Radiology-British-Institute-of-Radiology-2006-eng-81-2048.jpg)
![Our case is another example of a benign nodule with
strong enhancement that also exhibited growth with a
volume doubling time suspicious for malignancy.
Inflammatory pseudotumour (other diagnostic terms:
fibroxanthoma, xanthogranuloma, xanthofibroma, histio-
cytoma) is a rare entity histologically composed of a
mixture of inflammatory cells, including plasma cells,
lymphocytes, macrophages, a few eosinophils, fibroblasts
and connective tissue. In cases with dominance of plasma
cells, the term plasma cell granuloma is used. The lesions
are typically solitary, round and well circumscribed. The
diameter varies from 0.8 cm to 36 cm. Pulmonary
inflammatory pseudotumours clinically present in 60% of
patients with symptoms such as cough, dyspnoea and
haemoptysis; 40% are asymptomatic. The lesion presents
in patients ranging from 1 year to 77 years, but
approximately 60% are under the age of 40 years [8, 9].
Radiologically, most inflammatory pseudotumours pre-
sent as well-defined nodules or masses measuring between
1 cm and 10 cm. The large difference in the maximum size
reported in the literature probably depends on the mode of
detection as well as the presence or absence of symptoms.
Inflammatory pseudotumours are slightly more common
in the lower lobes. If followed radiographically, growth
has been documented. Contrast studies usually demon-
strate significant enhancement of the lesions. Cavitation or
calcification is rare. Infiltration of adjacent organs may be
observed and misinterpreted as evidence of malignancy
[9, 10]. In symptomatic patients surgical resection is the
therapy of choice.
In conclusion, inflammatory pseudotumour has to be
included in the differential diagnosis of enhancing
pulmonary nodules with growth particularly in children
and young adults. As there is no specific imaging feature,
biopsy is required for the diagnosis.
References
1. Swensen SJ, Viggiano RW, Midthun DE, et al. Lung nodule
enhancement at CT: multicenter study. Radiology
2000;214:73–80.
2. Tan BB, Flaherty KR, Kazerooni EA, Iannettoni MD. The
solitary pulmonary nodule. Chest 2003;123:89S–96S.
3. Kim YH, Lee KS, Primack SL, et al. Small pulmonary
nodules on CT accompanying surgically resectable lung cancer:
likelihood of malignancy. J Thorac Imaging 2002;17:40–6.
4. Yankelevitz DF, Henschke CI. Does 2-year stability imply
that pulmonary nodules are benign? AJR Am J Roentgenol
1997;168:325–8.
5. Yankelevitz DF, Gupta R, Zhao B, Henschke CI. Small
pulmonary nodules: evaluation with repeat CT – preliminary
experience. Radiology 1999;212:561–6.
6. Bankoff MS, McEniff NJ, Bhadelia RA, Garcia-Moliner M,
Daly BDT. Prevalence of pathologically proven intrapulmon-
ary lymph nodes and their appearance on CT. AJR Am J
Roentgenol 1996;167:629–30.
7. Matsuki M, Noma S, Kuroda Y, Oida K, Shindo T, Kobashi
Y. Thin-section CT features of intrapulmonary lymph nodes.
J Comput Assist Tomogr 2001;25:753–6.
8. Colby TV, Koss MN, Travis WD. Inflammatory pseudotu-
mor. In: Tumors of the lower respiratory tract. Atlas of
tumor pathology (3rd edn), Fascicle 13. Washington, DC:
Armed Forces Institute of Pathology, 1995:327–38.
9. Agrons GA, Rosado de Christensen ML, Kirejczyk WM,
Conran RM, Stocker JT. Pulmonary inflammatory pseudo-
tumor: radiologic features. Radiology 1998;206:511–8.
10. McCall IW, Woo-ming M. The radiological appearances
of plasma cell granuloma of the lung. Clin Radiol
1978;29:145–50.
(a) (b)
Figure 4. Histological slides demonstrating a mixed inflammatory infiltrate with lymphocytes and plasma cells ((a) Haematoxylin and
eosin, magnification6200) and involvement of medium-sized vessels with occlusion ((b) CD34 staining, ABC method, magnifica-
tion6100).
S Diederich, D Theegarten, G Stamatis and R Lu¨then
78 The British Journal of Radiology, January 2006](https://image.slidesharecdn.com/026britishjournalofradiology-britishinstituteofradiology-2006-130913065550-phpapp02/75/British-Journal-of-Radiology-British-Institute-of-Radiology-2006-eng-82-2048.jpg)
![Case report
Non-haemorrhagic subdural collection complicating rupture of
a middle cranial fossa arachnoid cyst
C OFFIAH, BSc, FRCS, FRCR, W ST CLAIR FORBES, MA, DMRD, FRCR and J THORNE, FRCS
Departments of Neuroradiology, Hope Hospital, Salford Royal Hospitals NHS Trust, Stott Lane, Salford, Manchester M6
8HD and Royal Manchester Children’s Hospital, Central Manchester and Manchester Children’s University Hospitals
NHS Trust, Manchester, UK
Abstract. Arachnoid cysts are a common incidental finding on routine brain imaging and, for the most part,
their presence is uneventful. Occasionally they may be associated with haemorrhage into the subdural
compartment. Rarer still is simple rupture of the contents of the arachnoid cyst into the extra-axial space. MRI
can help distinguish between these two rare occurrences – an important distinction to make as this may assist in
directing the treating clinician toward the most appropriate management plan.
Arachnoid cysts are a well-recognized benign intracra-
nial lesion occuring most commonly in the middle cranial
fossa. Although most are small and asymptomatic,
they may be associated with a complicated course most
typically causing mass effect or hydrocephalus.
Spontaneous and post-traumatic intracystic and subdural
haemorrhage has also been reported. We describe a case of
the very rare complication of symptomatic rupture of a
middle cranial fossa cyst into the subdural compartment
without haemorrhage. Despite extensive literature review,
there has been no previous description of this.
Case report
An 8-year-old boy presented with a history of
intermittent headaches, vomiting and double vision over
a period of several weeks, the onset of which was related
to a fall playing football when he struck his head on
concrete. No loss of consciousness occurred at the time
of the injury. On examination, his Glasgow coma scale
(GCS) was 15 and there was no focal neurology, cranial
nerve deficit or papilloedema. CT performed on
admission demonstrated a low-attenuation right-sided
subdural collection – isodense to cerebrospinal fluid
(CSF) – causing moderate mass effect, compression of
the ipsilateral ventricle and effacement of the cortical sulci.
No focal intraparenchymal abnormality was present. A
left middle cranial fossa arachnoid cyst was also noted
(Figure 1). The patient underwent burr-hole drainage of
the right subdural collection and at surgery fluid consistent
with CSF was seen to escape under pressure.
He was discharged a few days later following improve-
ment but re-admitted shortly after that with recurrence of
his symptoms and a notable right-sided scalp swelling. A
repeat CT scan (not shown) demonstrated re-accumulation
with a slight increase in size of the right subdural
collection, which remained low-attenuation. The left
arachnoid cyst remained unchanged and evidence of a
small right Sylvian fissure arachnoid cyst persisted.
Right-sided extracranial soft-tissue swelling was also
demonstrated. Ultimately, a subdural-peritoneal shunt
was placed on the right and his subsequent recovery was
unremarkable. Prior to his discharge, a CT scan was
performed which showed only a thin residual right-sided
subdural collection with some associated subdural air, but
no residual mass effect. The left-sided arachnoid cyst was
noted as previously. The small right-sided arachnoid cyst
has become more readily appreciated with resolution of
the ipsilateral subdural fluid (Figure 2).
Since his discharge, a MR scan of the brain has been
performed (7 months since the index admission). The
subdural collection has completely resolved. The right-
sided middle cranial fossa arachnoid cyst has increased
significantly in size since the preceding CT examination
obtained during the admission some 6 months previously.
The left-sided arachnoid cyst has remained unchanged in
size (Figure 3).
The patient remains clinically well and the subdural-
peritoneal shunt in situ.
Discussion
Arachnoid cysts derive from the meninx primitive,
embryologically, which is the primitive membrane ensheath-
ing the developing central nervous system (CNS). As
subarachnoid CSF accumulates, this meninx cavitates and
resorbs under normal circumstances leaving only the
subarachnoid space and the arachnoid membrane. During
this process, the arachnoid membrane may split with
secretion of fluid by the arachnoid cells into the resulting
cleft ultimately yielding a cyst – the so called arachnoid
cyst – which is truly intra-arachnoid anatomically [1–3].
Both intracystic haemorrhage and rupture of middle
cranial fossa arachnoid cysts into the subdural space
resulting in acute or chronic subdural haematoma – either
spontaneous or post-traumatic – have been well docu-
mented in the medical literature [1–14]. Bleeding occurs
due to tearing of an unsupported bridging vein or veins
that are stretched by the cyst and susceptible to rupture by
Received 3 August 2004 and in revised form 9 January 2005, accepted 6
May 2005.
The British Journal of Radiology, 79 (2006), 79–82 E 2006 The British Institute of Radiology
DOI: 10.1259/bjr/94682952
79The British Journal of Radiology, January 2006](https://image.slidesharecdn.com/026britishjournalofradiology-britishinstituteofradiology-2006-130913065550-phpapp02/75/British-Journal-of-Radiology-British-Institute-of-Radiology-2006-eng-83-2048.jpg)
![a rise in intracystic pressure [5, 7, 15]. What has not been
highlighted in the radiological literature is the occurrence
of arachnoid cyst rupture into the subdural compartment
resulting in progressive symptoms of raised intracranial
pressure, despite the lack of haemorrhage. Appreciation of
this complication does appear to have implications in
relation to the management of these patients and is a
valuable differential to highlight to the referring clinician.
This is because there potentially remains a communication
between the arachnoid cyst and the subdural compartment
following rupture so that, despite burr hole drainage of the
collection, there remains predisposition to re-accumulation
of cyst fluid in the subdural compartment and therefore
the increased probability of drain insertion being required
as an immediate definitive treatment. An important
imaging manoeuvre to assist in this differentiation would
be early MRI as the signal characteristics of the subdural
collection would aid distinction between acute or subacute
haemorrhage, as opposed to rupture of arachnoid cyst
contents into the subdural compartment. In the case of the
latter, the signal characteristics of the subdural fluid would
present as isointense to cyst contents (and to CSF).
It would appear that very minor trauma, if any, is
required for arachnoid cyst rupture to occur [6]. In our
case study the head injury that preceded the onset of
symptoms was not associated with any loss of conscious-
ness at the time suggesting that the insult was indeed a
minor one. Rupture has been reported to occur in cases
following the Valsalva manoeuvre during various activities
such as swimming [4, 5]. There have been sporadic reports
in the medical literature regarding spontaneous disappear-
ance of middle cranial fossa arachnoid cysts following
rupture or haemorrhage into the subdural space with
eventual resorption [4, 5]. Various mechanisms have been
proposed for such resolution [4–6]. However, in our case
report the cyst was seen to increase in size consistent with
re-accumulation after the subdural collection had been
treated and had begun to resolve. Presumably, diversion of
the subdural accumulation with shunt placement reduced
the intracranial pressure enough for the arachnoid cyst to
re-accumulate. The re-accumulation of the right-sided
arachnoid cyst in this case may also have been aided by
the widely conjectured ‘‘flap-valve’’ effect that may result
after a tear in the inner cyst wall following rupture that
allows passage of CSF from subarachnoid space into the
cyst, but closure of the tear in the outer membrane that
allowed cyst contents to egress from the cyst into the
subdural compartment [4, 5, 9].
Forty-eight percent of arachnoid cysts occur in the
middle cranial fossa. Only 20% occur in the posterior fossa
[10–15]. It is reported that only middle cranial fossa cysts
rupture [15] and this is supported by a review by Rogers
et al that demonstrated six cases of subdural haematomas,
which were all associated with middle cranial fossa
arachnoid cysts [9]. In our experience arachnoid cysts
are frequently bilateral; the presence of a middle cranial
fossa arachnoid cyst and a contralateral subdural fluid
collection should therefore raise the possibility of rupture
(a) (b)
Figure 1. (a) Unenhanced CT brain demonstrating a right subdural effusion causing mass effect and (b) a left middle cranial fossa
arachnoid cyst. The right Sylvian fissure demonstrates notable prominence of low (cerebrospinal fluid) density consistent with an
underlying right-sided middle cranial fossa arachnoid cyst.
C Offiah, W St Clair Forbes and J Thorne
80 The British Journal of Radiology, January 2006](https://image.slidesharecdn.com/026britishjournalofradiology-britishinstituteofradiology-2006-130913065550-phpapp02/75/British-Journal-of-Radiology-British-Institute-of-Radiology-2006-eng-84-2048.jpg)


![Correspondence
(The Editors do not hold themselves responsible for opinions expressed by correspondents)
Social factors in improving radiological
perception
The Editor—Sir,
Manning, Gale and Krupinski are absolutely correct when
they state ‘‘good displays and tools are clearly necessary
……but what we need to understand is how the
Radiologist interacts with the displayed information
during the reading process in order to determine how
we can further improve decision making’’ [1]. They identify
many of the perceptual, cognitive and ergonomic factors.
Social factors also need to be addressed. There is
considerable opportunity for improved knowledge sharing
among radiologists. Performance can be improved by
knowing where in particular to look and what exactly to
look for in different clinical scenarios. While subspeciali-
zation is important in improving perception, targeted
instruction and top up training can improve the perfor-
mance of all [2]. We need to have much more extensive
prompt feedback of our discrepancies and errors. The
prevalence of eye strain among radiologists has been reported
[3] as has the medicolegal implications of reporting at a
significantly faster rate than average [4]. There is no magic
solution that will produce a perfect imaging perceptual
process. However, the social dimension of reporting needs to
be included to optimize our performance.
Yours etc.,
R FITZGERALD
Consultant Radiologist
Radiology Department
New Cross
Wolverhampton
WV10 0QP
UK
(Received 12 August 2005 and accepted 23 August 2005)
References
1. Manning DJ, Gale A, Krupinski EA. Commentary: Perception
research in medical imaging. Br J Radiol 2005;78:683–5.
2. FitzGerald R. Radiological error: analysis, standard setting,
targeted instruction and teamworking. Eur Radiol 2005;15:1760–7.
3. Vertinsky T, Forster B. Prevalence of eye strain among
radiologists. Influence of viewing variables on symptoms. AJR
Am J Roentgenol 2005;184:681–6.
4. Berlin L. Liability of interpreting too many radiographs. AJR
Am J Roentgenol 2000;175:17–22.
The Grandfather of volume scanning
The Editor—Sir,
I would like to express my concern after some comments
made at the memorial lectures held at the Royal Society on
25 May 2005.
Sir Godfrey Hounsfield was well aware of the possibility
of what at EMI was called volume scanning. He
appreciated the difference between single slice and multiple
slice data acquisition. At EMI, the former idea was based
on movement of the patient through the scanner while the
continuous (slip-ring) gantry rotated using a continuous
power X-ray source. The latter technique was to have
involved the collection of data from set of contiguous
slices at the same time, a technique originally described in
Sir Godfrey’s first CT patent.
It was to achieve volume scanning that the TOPAZ
geometry was invented. The patent makes clear the
continuous rotation nature of the scanner. This system
was conceived in the mid 1970s with discussion for
implementation with the commercial Division later the
same decade. This system used solid-state detectors and an
X-ray tube with a directly oil cooled anode. A photograph
of the prototype, built by the Research team in the
Central Research Laboratories of EMI, was shown on
the 25 May 2005. It is clear that this geometry was the
first to make possible the matching of continuous
rotation with a continuous power X-ray source. The
apparent falter in the development of CT in the 1980s can
be traced to other causes and not to a lack of technical
innovation.
The nature of the TOPAZ configuration also uniquely
enabled focused layers to be obtained from the scanno-
gram or pilot scan data (Zonogram).
In the mid 1980s a 1 s, 1 mm slice thickness, version of
the system, based on Sir Godfrey’s ideas, was successfully
built and fully tested. From the scanner volume clinical
scans were obtained from which 3D images were
reconstructed.
The implication that there were any constraints placed
on the future of CT by Sir Godfrey is therefore wholly
inaccurate. If not the father of volume scanning, Sir
Godfrey Hounsfield must indeed be considered to be the
grandfather.
Yours etc.,
A BASKERVYLE STRONG
Engineering Manager EMI Medical Ltd (retired)
Broombank
267 Penistone Road
Kirkburton
Huddersfield
HD8 0PF
(Received 16 August 2005 and accepted 22 August 2005)
DOI: 10.1259/bjr/18395574
(Received 16 August 2005 and accepted 22 August 2005)
DOI: 10.1259/bjr/15532036
We hope the article in this issue by E Beckmann (p. 5)
and this letter will rectify any omission—Editor.
The British Journal of Radiology, 79 (2006), 83 E 2006 The British Institute of Radiology
83The British Journal of Radiology, January 2006](https://image.slidesharecdn.com/026britishjournalofradiology-britishinstituteofradiology-2006-130913065550-phpapp02/75/British-Journal-of-Radiology-British-Institute-of-Radiology-2006-eng-87-2048.jpg)

![Discussion
The diagnosis of acromegaly was clinically and bio-
chemically unequivocal in this case. Subsequently, we
performed contrast enhanced MRI (CEMRI) of the sella
for evaluation of the patient’s acromegaly. A T1 weighted
image of the sella revealed a large sellar, suprasellar mass
compressing the optic chiasm and causing expansion of the
sella. The mass showed enhancement in post-contrast
imaging suggestive of a pituitary macroadenoma, thus
confirming the clinical diagnosis of acromegaly. Marked,
diffuse expansion of the skull base was also noted
enhancing on contrast administration (Figure 2).
The patient sought medical advice primarily for her
marked skull expansion seen in the occipital region, which
had increased gradually over the last 6 years. Plain
radiography of the skull showed gross expansion of the
skull base and occiput with areas of sclerosis and ground
glass density. Enlarged maxillary and frontal sinuses were
also seen. A CT performed for detailing of the foraminal
compression in the skull base showed the typical ground-
glass appearance of fibrous dysplasia (Figure 3).
Narrowing of the bilateral optic canal and orbital apices
were also seen. A subsequent skeletal survey revealed that
the involvement was indeed multifocal with expansile
lesions seen in the ribs, left humerus and radius (Figure 4).
All of these features pointed to a pathology in addition to
acromegaly due to a GH secreting pituitary adenoma.
Based on the radiological appearance of the ground glass
density and their characteristic distribution, a differential
diagnosis of coexisting fibrous dysplasia was made. As
both of these conditions are associated in only one genetic
abnormality, a final diagnosis of McCune-Albright
syndrome – polyostotic fibrous dysplasia with acromegaly
due to pituitary macroadenoma – was made.
The McCune-Albright syndrome (MCAS) is a sporadic
disorder characterized by polyostotic fibrous dysplasia,
cutaneous pigmentation and endocrine hyperfunction. The
presence of any two of the three lesions (skin, bone and
endocrine glands) is sufficient for the diagnosis of MCAS
[1]. The genetic basis of MCAS is now reasonably
understood and is due to the post-zygotic activating
mutations of arginine 201 in the guanine-nucleotide-
binding protein (G protein) alpha-subunit (Gsalpha),
leading to a mosaic distribution of cells bearing
constitutively active adenylate cyclase [2]. The resultant
disorder depends on when the mutation occurs; during
embryonic development or post-natal life. The earlier it
takes place, the more cells are affected. Somatic mutations
in a small cell mass result in MCAS; whereas in a larger
cell mass, mutation results in polyostotic fibrous dysplasia
[3]. The distribution of affected cells follows embryological
lines of ectodermal migration, which explains the uni-
lateral and focal expression of MCAS in bones as well as
in endocrine tissue.
Various endocrinopathies reported in MCAS include
precocious puberty, thyrotoxicosis, Cushing’s syndrome,
acromegaly, hyperprolactinaemia and hypophosphataemic
rickets [4, 5]. The association of polyostotic fibrous
dysplasia and acromegaly, although rare, is a well
described entity [5]. In MCAS, gigantism/acromegaly
usually present at an earlier age (less than 30 years)
than in classical acromegaly [6–8]. A pituitary adenoma
may be found less often than in classical acromegaly [5, 8].
Figure 3. Axial CT image (bone-window) showing ground-
glass expansion of skull base with narrowed basal foramina,
bilateral optic canal and orbital apices.
Figure 4. Radiographs of the left humerus and radius show
classical lesions of fibrous dysplasia.
Case of the month: A deformed skull
85The British Journal of Radiology, January 2006](https://image.slidesharecdn.com/026britishjournalofradiology-britishinstituteofradiology-2006-130913065550-phpapp02/75/British-Journal-of-Radiology-British-Institute-of-Radiology-2006-eng-89-2048.jpg)
![Moreover, the macroadenomas in MCAS are smaller than
those in classical acromegaly [5, 8].
The association of acromegaly and fibrous dysplasia
may pose a diagnostic challenge to the clinician and the
radiologist. The majority of patients with MCAS are short
in stature because of precocious puberty, recurrent
fractures and hypophosphataemic rickets, whereas those
with associated GH excess/acromegaly usually reach a
normal height [5, 9]. Also, since fibrous dysplasia has a
predilection for skull base involvement, the facial dys-
morphism may mask the usual features of acromegaly
causing delay in diagnosis.
CT and MRI play a pivotal role in the evaluation of
these patients. MRI is better than CT in assessment of
sella in the presence of bony skull base thickening due to
fibrous dysplasia. The distinction between pituitary gland
and abnormal fibrous bone tissue at skull base is better
made on MRI. The combination of pre- and post-contrast
images is useful in this regard. However, CT of skull
base plays a useful role in some cases for detailing
neural foraminal compression, especially if surgery is being
contemplated [10].
Craniofacial fibrous dysplasia may mimic hyperostotic
meningioma (meningioma en plaque) or even osteoma,
especially in a monostotic lesion [9]. Association of
acromegaly and meningioma has also been described [12, 13].
MCAS with acromegaly and skull base fibrous dysplasia
is also a therapeutic challenge as transpituitary surgery is
often not possible in the presence of fibrous dysplasia of
skull base whereas radiation therapy can induce bone
sarcomatous transformation [14]. Some authors have
suggested a transfrontal route to approach the pituitary
adenoma [15]. In a series by Akintoye et al, the authors
described a distinct clinical phenotype of MCAS due to
GH excess which is characterized by inappropriately
normal stature, thyroid releasing hormone (TRH) respon-
siveness, prolactin cosecretion, small or absent pituitary
tumours, a consistent but inadequate response to treat-
ment with cabergoline and an intermediate response to
long acting octreotide [5]. In our patient too, the medical
treatment was chosen because surgery was not possible
due to the fibrous dysplasia of the skull base and
radiotherapy would increase the risk of sarcomatous
transformation. The patient received octreotide LAR
40 mg (intramuscular) monthly. The plasma growth
hormone levels (post-oral glucose) decreased from an
initial 60 ng ml21
to 23 ng ml21
1 month after first
injection.
In conclusion, the association of acromegaly with
MCAS may pose a diagnostic and therapeutic challenge.
MRI is vital in the evaluation of such patients for the
delineation of the pituitary adenoma separate from the
skull base abnormality. CT is a useful adjunct pre-
operatively to delineate the foraminal compression.
References
1. Schwindinger WF, Levine MA. McCune-Albright Syndrome.
Trend Endocrinol Metab 1993;7:238–42.
2. Lumbroso S, Paris F, Sultan C; European Collaborative
Study. Activating Gsalpha mutations: analysis of 113 patients
with signs of McCune-Albright syndrome--a European
Collaborative Study. J Clin Endocrinol Metab
2004;89:2107–13.
3. Feldman F. Tuberous sclerosis, neurofibromatosis, and
fibrous dysplasia. In: Resnick D, editor. Diagnosis of bone
and joint disease. 4th edn. Philadelphia, PA: WB Saunder’s
Company 2002:4792–843.
4. Weinstein LS, Shenker A, Gejman PV, Merino MJ, Friedman
E, Spiegel AM. Activating mutations of the stimulatory G
protein in the McCune Albright Syndrome. N Engl J Med
1991;325:1688–95.
5. Akintoye SO, Chebli C, Booher S, Feuillan P, Kushner H,
Leroith D, et al. Characterization of gsp-mediated growth
hormone excess in the context of McCune-Albright syn-
drome. J Clin Endocrinol Metab 2002;87:5104–12.
6. Chanson P, Dib A, Visot A, Derome PJ. McCune-Albright
syndrome and acromegaly: clinical studies and responses to
treatment in five cases. Eur J Endocrinol 1994;131:229–34.
7. Lipson A, Hsu T. McCune Albright syndrome associated
with acromegaly: report of a case and review of literature.
Johns Hopkins Med J 1981;149:10–4.
8. Premawardhana LDKE, Vora JP, Mills R, Scanlon MF.
Acromegaly and its treatment in the McCune-Albright
syndrome. Clin Endocrinol (Oxf) 1992;36:605–8.
9. Leet AI, Chebli C, Kushner H, Chen CC, Kelly MH,
Brillante BA, et al. Fracture incidence in polyostotic fibrous
dysplasia and the McCune-Albright syndrome. J Bone Miner
Res 2004;19:571–7.
10. Kim KS, Rogers LF, Goldblatt D. CT features of
hyperostosing meningioma en plaque. AJR Am
J Roentgenol 1987;149:1017–23.
11. Daly BD, Chow CC, Cockram CS. Unusual manifestations of
craniofacial fibrous dysplasia: clinical, endocrinological and
computed tomographic features. Postgrad Med J 1994;70:10–6.
12. Cannavo S, Curto L, Fazio R, Paterniti S, Blandino A, Marafioti
T, et al. Coexistence of growth hormone-secreting pituitary
adenoma and intracranial meningioma: a case report and review
of the literature. J Endocrinol Invest 1993;16:703–8.
13. Bunick EM, Mills LC, Rose LI. Association of acromegaly
and meningiomas. JAMA 1975;240:1267–8.
14. Immenkamp M. Malignant change in fibrous dysplasia
(author’s transl). Z Orthop IhreGrenzgeb 1975;113:331–43.
15. Bhansali A, Sharma BS, Sreenivasulu P, Singh P, Vashisth
RK, Dash RJ. Acromegaly with fibrous dysplasia: McCune-
Albright Syndrome -- clinical studies in 3 cases and brief
review of literature. Endocr J 2003;50:793–9.
B Guglani, C J Das, A Seith et al
86 The British Journal of Radiology, January 2006](https://image.slidesharecdn.com/026britishjournalofradiology-britishinstituteofradiology-2006-130913065550-phpapp02/75/British-Journal-of-Radiology-British-Institute-of-Radiology-2006-eng-90-2048.jpg)


![Patients’ perception of tests in the assessment of faecal
incontinence
1
M DEUTEKOM, PhD, 2
M P TERRA, MD, 1
M G W DIJKGRAAF, PhD, 2
A C DOBBEN, MSc, 2
J STOKER, MD,
PhD, 3
G E BOECKXSTAENS, MD, PhD and 1
P M M BOSSUYT, PhD
1
Department of Clinical Epidemiology and Biostatistics, 2
Department of Radiology and
3
Department of Gastroenterology from the Academic Medical Center, Amsterdam, The
Netherlands
ABSTRACT. The objective of this study was to evaluate patient perception of endoanal
MRI compared with defecography and anorectal functional testing in the workup of
patients with faecal incontinence. Consenting consecutive patients underwent a
standard testing protocol consisting of endoanal MRI, defecography and anorectal
function combination. Patient experience was evaluated with a self-administered
questionnaire, addressing anxiety, embarrassment, pain and discomfort, each
measured on a 1 (none) to 5 (extreme) point-scale. Patients were also asked to rank the
three tests from least to most inconvenient. Statistical analysis was performed with
parametric tests. Data from 211 patients (23 men; mean age 59 years (SD¡12)) were
available. MRI had the lowest average score for embarrassment and discomfort (1.6)
and defecography the highest (1.9 and 2.0, respectively) (p,0.0001, tested with general
linear model for related samples). The average pain score was lowest for MRI (1.4) and
highest for the anorectal function combination (1.7) (p,0.0001). Level of anxiety was
highest for MRI (1.6 versus 1.4; p50.03). MRI was scored as least inconvenient by 69% of
patients. Endoanal MRI was scored as least inconvenient. However, the differences in
patient burden between the three diagnostic tests were small and absolute values were
low for all tests. Patient perception will not be a key feature in determining an optimal
diagnostic strategy in faecal incontinence.
Received 26 May 2005
Revised 15 June 2005
Accepted 22 June 2005
DOI: 10.1259/bjr/63269033
’ 2006 The British Institute of
Radiology
Faecal incontinence is defined as recurrent uncon-
trolled passage of faecal material at an inappropriate
time or in an inappropriate place more than twice a
month [1]. The reported prevalence values range from
1.4% in the general population [2] to 46% in institutio-
nalized elderly [3, 4]. It is possible that the real
prevalence is even higher than reported as faecal
incontinence is associated with high social stigma and
people do not easily seek help for this disorder out of
embarrassment [5, 6]. Childbearing injuries (sphincter
and/or pudendal nerve damage) and prior anorectal
surgery (sphincter trauma) are the main causes of faecal
incontinence [7, 8].
Diagnostic tools are used to determine the exact cause of
the faecal incontinence complaints and aim to guide future
therapy. In the evaluation of faecal incontinence clinicians
can use a large variety of diagnostic tools, including
anorectal function tests and anorectal imaging techniques
after medical history and physical examination.
Treatment guidance appears to be problematic as there
exists debate in the value of diagnostic tests with respect
to treatment outcomes [9]. It has been shown that the
existence of sphincter atrophy has a negative predictive
value on the success of sphincter repair [10]. About
10 years ago, endoluminal MRI of the rectum and the
anus was introduced [11]. It appeared that, although
endoanal MRI was comparable with endoanal ultra-
sound for identifying defects of the sphincter, only
endoanal MRI could reveal thinning of the external
sphincter reflecting muscle atrophy [12].
Its ability to identify sphincter defects as well as external
sphincter atrophy makes endoanal MRI a likely candidate
for a diagnostic strategy to guide treatment decisions in
patients with faecal incontinence. Yet an optimal diagnos-
tic strategy should also try to minimize patient burden, as
extensive testing may be taxing to patients.
It has been shown in a review that anxiety-related
reactions occur in approximately 4% to 30% of patients
undergoing MRI, ranging from apprehension to severe
reactions that interfere with the performance of the test
[13]. These findings were from studies using non-
invasive MRI techniques. It could be hypothesized that
the use of an endoluminal coil could be even more
bothersome for patients, but there exist no data to either
refute or confirm this hypothesis.
We designed a study to evaluate and compare the
patient burden of diagnostic tests used in the work-up of
patients with faecal incontinence as part of a clinical
cohort study aiming to identify prognostic factors for
treatment success by physiotherapy.
We studied the perceived burden of endoanal MRI,
defecography and an anorectal function test combination
consisting of anorectal manometry, pudendal nerve
This research was supported by grant 945-01-013 of the
Netherlands Organization for Health Research and Development.
The British Journal of Radiology, 79 (2006), 94–100
94 The British Journal of Radiology, February 2006](https://image.slidesharecdn.com/026britishjournalofradiology-britishinstituteofradiology-2006-130913065550-phpapp02/75/British-Journal-of-Radiology-British-Institute-of-Radiology-2006-eng-99-2048.jpg)
![terminal motor latency, rectal capacity measurement, anal
and rectal sensitivity measurement and endoanal
ultrasound.
Materials and methods
The clinical cohort study had started in December
2001. By February 2004, 240 consenting consecutive
patients with faecal incontinence visiting one of 16
participating medical centres (Dutch) were included in
the cohort study. The medical ethics committees of all
participating hospitals approved the study.
Patients were identified by surgeons, gastroenterolo-
gists and a gynaecologist participating in the large
diagnostic cohort study. Patients were referred to these
physicians by general practitioners or by physicians who
were not participating in the cohort study. After
receiving signed informed consent from patients, data
concerning medical history were collected by physicians.
All participating physicians used the same structured
forms for medical history. Patients were questioned
about the duration of their faecal incontinence com-
plaints. The severity of faecal incontinence was assessed
by means of an incontinence scale developed by Vaizey
[14]. This scale contains items about the type (gas, fluid,
solid) and frequency of incontinence and additional
items addressing social invalidation, the need to wear a
pad or plug, the use of constipating medication and the
presence of urge incontinence. The total score on the
Vaizey scale ranges from 0 (complete continence) to 24
(complete incontinence).
Inclusion criteria for the cohort study were the
existence of faecal incontinence complaints for 6 months
or more, a Vaizey incontinence score of at least 12, and
failure of conservative treatment, based on diet recom-
mendations and/or antidiarrhetics. Excluded were
patients aged below 18 years, patients diagnosed less
than 2 years ago with an anorectal tumour and patients
with a previous ileoanal or coloanal anastomosis. As the
clinical cohort study investigated the treatment effect of
physiotherapy, patients with chronic diarrhoea (always
fluid stools, three or more times a day), overflow
incontinence, proctitis, soiling (leakage of faecal material
out of the anus after normal defecation leading to
perineal eczema) and rectal prolapse were also excluded
from participation.
Some patient categories were excluded from one or
more tests. Defecography was not performed in females
younger than 45 years without sterilization, except on
indication based on clinical symptoms (e.g. lower
abdominal pain and/or false urge to defecate) and
clinical findings (e.g. symptoms of prolapse) because of
the cumulative radiation doses of somatic and genetic
effects. Before the MRI examination, patients were
questioned about claustrophobia and had to complete a
questionnaire comprising exclusion criteria for a MRI
examination, such as a pacemaker, claustrophobia and
other contraindications. Patients with a pacemaker were
excluded from the MRI examination, a pacemaker being
an absolute contraindication for MRI.
Only the data of patients who experienced all three test
sessions were analysed in this study.
Diagnostic tests
Patients underwent three diagnostic sessions: one with
endoanal MRI, a second with defecography and a third
with a combination of anorectal function tests consisting
of anorectal manometry, pudendal nerve terminal motor
latency, rectal capacity measurement, anal and rectal
sensitivity measurement, and endoanal ultrasound. None
of the patients received sedation for any of the tests. The
decision to evaluate the burden of the latter anorectal
function test combination was made because these tests
are usually performed in a single testing session and we
expected that patients would find it difficult to differ-
entiate the tests. Logistical considerations prevented us
from randomizing the order of the tests.
All diagnostic tests were performed according to a
standard procedure that had been established during joint
meetings of the research group members of all participat-
ing hospitals. Not all centres were equipped to perform all
tests, therefore not all patients could be tested at a single
site. Prior to testing, all patients received standard written
information concerning the tests.
MRI
Endoanal MRI visualizes the muscles of the pelvic
floor. Endoanal imaging was performed with 1 T or 1.5 T
MR (General Electric Horizon Echospeed; General
Electric, Milwaukee, IL; Philips Gyroscan ACS-NT;
Philips Medical Systems, Best, The Netherlands) clinical
closed bore units and a dedicated endoanal coil with a
diameter of 18 mm. All patients were asked to fast 4 h
prior to the MR examinations to minimize artefacts from
bowel peristalsis. In all hospitals except one, the patients
were injected intramuscularly with an antiperistaltic
drug to reduce bowel motion before the start of imaging.
No intravenous contrast medium was used. The endoa-
nal coil was covered with a condom and, after lubrica-
tion, inserted into the anal canal with the patient in a left
lateral position. After positioning of the endoanal coil,
the patients were turned to the supine position and
moved into the magnet. The patient was instructed not to
squeeze to prevent artefacts of movement. The scan
period took on average 20 min. As this test was
performed as part of a larger study, patients were also
studied with a phased array coil in the same session after
removal of the endoanal coil. No intravenous contrast
medium was used and no dynamic sequences were
performed with external phased array coil MRI. The
burden expressed by the patients for MRI was the
burden for the combination of endoanal and phased-
array MRI. The total duration for this combination was
around 40 min.
Defecography
Defecography allows an evaluation of the movements of
the rectum, insufficiency of the sphincter, presence or
absence of rectoceles, enteroceles and intussusceptions.
Patients were instructed to drink contrast medium diluted
in water prior to the examination. The test started with the
patient in left decubital position. Through an injection,
pistol barium paste (200–300 ml barium sulphate prepared
Patients’ perception of tests
The British Journal of Radiology, February 2006 95](https://image.slidesharecdn.com/026britishjournalofradiology-britishinstituteofradiology-2006-130913065550-phpapp02/75/British-Journal-of-Radiology-British-Institute-of-Radiology-2006-eng-100-2048.jpg)
![by the hospital pharmacy or Evacu-Paste (E-Z-EMH Inc.,
Westbury, NY)) was injected manually into the rectum. In
female patients, amidotrizoide acid 50% gel was also
injected via a syringe into the vagina. The perineum was
located with amidotrizoide acid 50% gel solution or located
by a catheter with leadmark. Subsequently, the entire X-ray
table was tilted upright 90˚and the patient was seated on a
specially developed radiolucent defecography chair.
Defecography took approximately 15 min (room time).
After the test was performed, the patient was instructed to
drink extra to eliminate the contrast.
Anorectal function test combination
All tests were performed in left lateral position with
hips flexed to 90˚. Anal manometry evaluates the
muscular contraction and relaxation of the anal sphinc-
ters by the measurement of pressures in the anal canal.
Anal manometry took place according to the solid-state
or water perfused technique, without or with sleeve. The
catheter (Konigsberg Instrument Inc., Pasadena, CA;
Medtronic, Skolvunde, Denmark; Dentsleeve Pty Ltd,
Parkside, Australia) was introduced and stabilized in the
anal sphincter complex. After positioning of the catheter,
the basal sphincter pressure, maximum squeeze pressure
and rectal anal inhibitory reflex were measured.
Pudendal nerve terminal motor latency determines the
integrity of the pudendal nerve. The finger with a glove-
mounted St Mark’s Hospital electrode (Dantec;
Skovlunde, Denmark) was inserted into the rectum.
The pudendal nerve was electrically stimulated (supra
maximum stimulus of 0.05 ms) on each side near the
ischial spine.
With rectal and anal sensitivity measurements the
threshold sensation of the rectum and anus was
determined, respectively. The stimulation electrode
(Dantec Keypoint, Skovlunde, Denmark) was mounted
on a catheter and introduced into the rectum. A constant
current was increased gradually to a maximum of
20 mA. The same procedure was performed in the anus
to determine the threshold sensation of the anus.
The capacity measurement of the rectum was per-
formed by introducing a single use urinary catheter
(female, 14 Ch) with a latex balloon tied to the end,
covered with a lubricant and connected to a 50 ml
syringe, into the rectum. The balloon catheter was
inflated with air in gradual increments of 50 ml until
the maximum tolerable volume was reached. The
minimal rectal sensation perceived (sensory threshold),
the volume associated with the initial urge to defecate
(urge sensation) and the volume at which the patient
experienced discomfort and an intense desire to defecate
(the maximal tolerated volume) were determined.
Endoanal ultrasound was performed with an ultra-
sound scanner (3535 Bruel and Kjaer, Gentfofte,
Denmark; SDD-2000 Multiview Aloka, Tokyo, Japan)
with radial endoscopic probe and a 7.5 MHz transducer.
The probe was covered with a condom and, after
application of a lubricant, introduced into the anal canal
with the patient in left lateral or prone position. The
probe was slightly withdrawn so all the different levels
of the anal sphincter complex could be visualized. The
total duration of the anorectal function test combination
was between 30 min and 55 min.
Test questionnaire
The self-administered questionnaire was handed out
by a physician before the first test was performed.
Patients were requested to take the questionnaire home
and to complete the questionnaire after their last test.
One researcher (MD) collected all completed question-
naires and contacted patients when no questionnaires
were returned. When necessary, extra questionnaires
were sent out. The questionnaire consisted of three
modules. First, a standard formatted Likert scoring
module was used with four items concerning pain,
embarrassment, discomfort, and anxiety. The first three
items have previously been used in a study of the
acceptance of CT colonoscopy by patients [15]. Based on
literature data, we added anxiety as the fourth item [13,
16, 17]. Responses were scored on a five-point scale with
1 indicating ‘‘none’’ and 5 indicating ‘‘extreme’’. By
adding the item scores, an overall burden score was
determined. Second, a comparative assessment module
was used, forcing patients to rank the different tests from
least to most inconvenient. Finally, a behavioural intent
module was used by asking patients whether or not they,
if opportune, would recommend each test to friends or
relatives. The different modules were collated into one
comprehensive questionnaire.
Statistical analyses
The general linear model for related samples was used
to compare the burden of the different tests. When a
statistical difference was found, paired t-tests were used
as post hoc tests. Subgroup analyses were performed
based on age, duration of faecal incontinence (using a
median split) and gender. Unpaired t-tests were used to
test for differences between groups of patients with
respect to sum burden scores. We also investigated with
unpaired t-tests if burden values were different depend-
ing on whether patients received their tests in a single
centre or in multiple centres. We analysed whether test
order and the time lag between date of last test and date
of completed questionnaire affected experienced burden,
using Pearson correlation coefficients.
Additional analyses were performed to study the
association between the subjective ranking of a test and
the burden variables. For each of the three tests, patients
were categorized according to position of that test in their
inconvenience ranking. We used analysis of variance to
examine differences in the amount of burden between the
different patient groups. p-values below 0.05 were con-
sidered to represent a statistically significant difference.
Results
Patient characteristics
From the 270 questionnaires distributed, 240 ques-
tionnaires were returned during the study period
(response rate: 89%). Data were missing for one or more
tests in 29 patients for various reasons: last test occurred
after completion of the questionnaire (n515), contra-
indication (n58), claustrophobia (n53) or unknown
(n53). For 211 (23 male; 188 female) patients all test
M Deutekom, M P Terra, M G W Dijkgraaf et al
96 The British Journal of Radiology, February 2006](https://image.slidesharecdn.com/026britishjournalofradiology-britishinstituteofradiology-2006-130913065550-phpapp02/75/British-Journal-of-Radiology-British-Institute-of-Radiology-2006-eng-101-2048.jpg)


![if ever tested. As patients seeking medical attention may
suffer more severely from their complaints they could
downgrade the burden of the testing in comparison with
the burden of their illness.
The observed imbalance between men and women in
our study is not due to a form of selection bias but is
inherent to the disorder of faecal incontinence [18].
We were forced to combine five tests into an anorectal
function combination, as these tests are usually per-
formed in a single testing session. When designing the
study we learned that patients found it difficult to
differentiate the tests during the testing sequence. We
anticipated that in between measurement might interfere
with the experience of the testing sequence and decided
to rely on a post hoc assessment of the overall burden of
the combination of tests. Unfortunately, this prevents us
from making separate statements on endosonography.
As endosonography and endoanal MRI produce com-
parable information, it would be interesting to compare
the burden of these two imaging modalities.
Although some have questioned the role of defeco-
graphy in the diagnostic work up of faecal incontinence,
our research group had decided to include this diag-
nostic modality within the cohort study. Some authors
have underscored the importance of the role of defeco-
graphy for accurately diagnosing intussusceptions and
anterior rectoceles [19] or for determining the aetiology
of outlet obstruction symptoms in patients with com-
bined faecal incontinence [20]. In a suggested work-up of
faecal incontinent patients by Felt [21], defecography was
one of the components of the diagnostic procedures. MR-
defecography is primarily employed in patients with
prolapse or constipation, while the role of MR-defeco-
graphy in incontinent patients is unclear. For this reason
MR-defecography was not part of this diagnostic cohort
study evaluating current practice.
Another possible limitation is the non-random test
order. The order in which tests were offered to patients
varied considerably, but the results of our analysis
showed that test order did not significantly affect
experienced burden.
It has been shown that past experience with testing can
influence the perception of patients of a test [22–24]. It is
unusual for patients to undergo repeated testing, so we
expected very few of our patients to have undergone one
or more of these tests previously. The low prevalence
and the lack of data prevent us from exploring explicitly
any bias due to prior experience. We believe that in our
questionnaire study total, bias is kept to a minimum.
Non-response bias is negligible as we achieved a
response rate of 89%. The questionnaires were self-
administered so there is no potential for interviewer bias.
Response bias was minimized by assuring anonymity of
the patient. Furthermore, the questionnaires were
handed out by a physician, but patients were requested
to complete the questionnaire at home. Finally, due to
the subject of the questionnaire we did not
expect patients to respond in a sociably desirable
manner.
We have tried to standardize the information given to
patients by handing out a written information sheet prior
to testing. However, we cannot claim that all patients
received exactly the same oral information by their
specialists.
To our knowledge this is the first study to investigate
the patient burden of endoanal MRI, defecography and
anorectal function test combination. The burden of MRI
has been studied before, mostly with respect to patient
anxiety. In a review by Melendez et al [13] it has been
shown that anxiety-related reactions occur in approxi-
mately 4–30% of patients undergoing MRI. In this study,
three patients did not undergo an MRI because of
claustrophobia. None of the other patients became
anxious up to a level that the test could not be executed,
and none of the examinations had to be discarded
because of motion artefacts, also associated with high
patient anxiety in the past [17, 25–27].
The percentage of patients reporting high anxiety
levels was low in comparison with other studies. One
possible reason for this could be that anxiety was
measured after the test had been performed. Various
studies have reported lower anxiety levels post-MRI
Figure 3. Burden sum scores and
inconvenience ranking. Values
indicate mean and 95% confidence
interval.
Patients’ perception of tests
The British Journal of Radiology, February 2006 99](https://image.slidesharecdn.com/026britishjournalofradiology-britishinstituteofradiology-2006-130913065550-phpapp02/75/British-Journal-of-Radiology-British-Institute-of-Radiology-2006-eng-104-2048.jpg)
![compared with pre-MRI [16, 25, 27]. Another possible
explanation for the lower number of patients with
anxiety reactions could lie in the fact that patients
suffered from their incontinence for a long duration
and were not afraid that MRI would reveal a certain
malignant disease. Studies have shown that test anxiety
could result from insecurity about what the test would
reveal [16, 28]. Although the amount of anxiety of MRI in
this study was low in comparison with earlier studies,
the observed values were slightly higher than those for
defecography and the anorectal function combination.
MRI scored better with respect to other variables than
defecography and the anorectal function combination.
Small but significantly lower scores for MRI were seen
for pain, embarrassment and discomfort. Total burden
sum score was also significantly lower for MRI. Because
all tests were performed as part of a larger study
designed to evaluate the diagnostic performance of these
tests, patients received phased-array MRI as well as
endoanal MRI in a single session. The present study
addressed the burden of that total MRI session. It can be
expected that the burden for a diagnostic session with
endoanal MRI only would be even somewhat smaller,
because of the shorter duration of this single procedure.
Overall, MRI was preferred more often than defecogra-
phy and functional testing, with 120 (69%) patients scoring
MRI as least inconvenient. For every test we observed a
significant relationship between the given inconvenience
rank and the burden sum score. Patients ranking a test as
least inconvenient reported significantly less burden than
patients who ranked this test as most inconvenient. We feel
confident in concluding that the burden sum score, based
on a combination of embarrassment, pain, anxiety and
discomfort, is a reflection of relative inconvenience. The
observed relation between the burden values and the
ranking question supports the construct validity of this
short and apprehensive questionnaire.
In summary, in this study, set up to investigate the
burden of diagnostic tests used in the assessment of
faecal incontinence, we found significant differences
between tests, with MRI scoring significantly better than
defecography and the anorectal function combination.
As the differences were small and the average burden
values were low for all tests, we find it safe to say that
the role of burden of testing in the search for an optimal
strategy in faecal incontinence will be limited. The
preferred diagnostic pathway will most likely be based
on maximizing diagnostic accuracy at acceptable costs.
Efforts to collect more information on test accuracy and
costs are underway.
References
1. Thomas TM, Egan M, Walgrove A, Meade TW. The
prevalence of faecal and double incontinence. Com Med
1984;6:216–20.
2. Perry S, Shaw C, McGrother C, Matthews RJ, Assassa RP,
Dallosso H, et al. Prevalence of faecal incontinence in adults
aged 40 years or more living in the community. Gut
2002;50:480–4.
3. Borrie MJ, Davidson HA. Incontinence in institutions: costs
and contributing factors. CMAJ 1992;147:322–8.
4. Johanson JF, Irizarry F, Doughty A. Risk factors for fecal
incontinence in a nursing home population. J Clin
Gastroenterol 1997;24:156–60.
5. Mavrantonis C, Wexner SD. A clinical approach to fecal
incontinence. J Clin Gastroenterol 1998;27:108–21.
6. Jorge JM, Wexner SD. Etiology and management of fecal
incontinence. Dis Colon Rectum 1993;36:77–97.
7. Kamm MA. Obstetric damage and faecal incontinence.
Lancet 1994;344:730–3.
8. Toglia MR. Pathophysiology of anorectal dysfunction.
Obstet Gynecol Clin North Am 1998;25:771–81, vi.
9. Prather CM. Physiologic variables that predict the outcome
of treatment for fecal incontinence. Gastroenterology
2004;126 (Suppl.):s135–s140.
10. Briel JW, Stoker J, Rociu E, Lameris JS, Hop WCJ, Schouten
WR. External anal sphincter atrophy on endoanal magnetic
resonance imaging adversely affects continence after
sphincteroplasty. Br J Surg 1999;86:1322–7.
11. Stoker J, Rociu E. Endoluminal MR imaging of anorectal
diseases. J Magn Reson Imaging 1999;9:631–4.
12. Rociu E, Stoker J, Eijkemans MJ, Schouten WR, Lameris JS.
Fecal incontinence: endoanal US versus endoanal MR
imaging. Radiology 1999;212:453–8.
13. Melendez JC, McCrank E. Anxiety-related reactions asso-
ciated with magnetic resonance imaging examinations.
JAMA 1993;270:745–7.
14. Vaizey CJ, Carapeti E, Cahill JA, Kamm MA. Prospective
comparison of faecal incontinence grading systems. Gut
1999;44:77–80.
15. Van Gelder RE, Birnie E, Florie J, Schutter MP, Bartelsman
JF, Snel P, et al. A comparison of patient preference of CT
colonography and colonoscopy: a five-week follow-up
study. Radiology 2004;233:328–37.
16. Katz RC, Wilson L, Frazer N. Anxiety and its determinants
in patients undergoing magnetic resonance imaging. J
Behav Ther Exp Psych 1994;25:131–4.
17. MacKenzie R, Sims C, Owens RG, Dixon AK. Patients’
perceptions of magnetic resonance imaging. Clin Radiol
1995;50:137–43.
18. Henry MM. Pathogenesis and management of fecal incon-
tinence in the adult. Gastroenterol Clin North Am
1987;16:35–45.
19. JorgeJM,Habr-GamaA,WexnerSD.Clinicalapplicationsand
techniquesofcinedefecography.AmJSurg2001;182:93–101.
20. Wiersma TG, Mulder CJ, Reeders JW. Dynamic rectal
examination: its significant clinical value. Endoscopy
1997;29:462–71.
21. Felt-Bersma RJF, Cuesta MA. Fecal incontinence 1994 -
which test and which outcome. Neth J Med 1994;44:182–8.
22. Mueller PR, Biswal S, Halpern EF, Kaufman JA, Lee MJ.
Interventional radiologic procedures: patient anxiety, per-
ception of pain, understanding of procedure, and satisfac-
tion with medication–a prospective study. Radiology
2000;215:684–8.
23. Murphy KJ, Brunberg JA. Adult claustrophobia, anxiety
and sedation in MRI. Magn Reson Imaging 1997;15:51–4.
24. Thorp D, Owens RG, Whitehouse G, Dewey ME. Subjective
experiences of magnetic resonance imaging. Clin Radiol
1990;41:276–8.
25. Dantendorfer K, Amering M, Bankier A, Helbich T, Prayer
D, Youssefzadeh S, et al. A study of the effects of patient
anxiety, perceptions and equipment on motion artifacts in
magnetic resonance imaging. Magn Reson Imaging
1997;15:301–6.
26. Sarji SA, Abdullah BJ, Kumar G, Tan AH, Narayanan P.
Failed magnetic resonance imaging examinations due to
claustrophobia. Australas Radiol 1998;42:293–5.
27. Quirk ME, Letendre AJ, Ciottone RA, Lingley JF. Anxiety in
patients undergoing MR imaging. Radiology 1989;170:
463–6.
28. Gebbensleben B, Rohde H. Anxiety before gastrointestinal
endoscopy–a significant problem? Dtsch Med Wochenschr
1990;115:1539–44.
M Deutekom, M P Terra, M G W Dijkgraaf et al
100 The British Journal of Radiology, February 2006](https://image.slidesharecdn.com/026britishjournalofradiology-britishinstituteofradiology-2006-130913065550-phpapp02/75/British-Journal-of-Radiology-British-Institute-of-Radiology-2006-eng-105-2048.jpg)
![Enhanced visualization and quantification of magnetic resonance
diffusion tensor imaging using the p:q tensor decomposition
1,2,3
A PEN˜ A, PhD, 1,3
H A L GREEN, MBChB, 3
T A CARPENTER, PhD, 1,2,3
S J PRICE, FRCS, 1,3
J D PICKARD,
MChir, FRCS, FMedSci and 2,3
J H GILLARD, BSc, MD, FRCR
Departments of 1
Neurosurgery, 2
Radiology and the 3
Wolfson Brain Imaging Centre,
Addenbrooke’s Hospital and the University of Cambridge, Cambridge CB2 2QQ, UK
ABSTRACT. Many scalar measures have been proposed to quantify magnetic resonance
diffusion tensor imaging (MR DTI) data in the brain. However, only two parameters are
commonly used in the literature: mean diffusion (D) and fractional anisotropy (FA). We
introduce a visualization technique which permits the simultaneous analysis of an
additional five scalar measures. This enhanced diversity is important, as it is not known a
priori which of these measures best describes pathological changes for brain tissue. The
proposed technique is based on a tensor transformation, which decomposes the diffusion
tensor into its isotropic (p) and anisotropic (q) components. To illustrate the use of this
technique, diffusion tensor imaging was performed on a healthy volunteer, a sequential
study in a patient with recent stroke, a patient with hydrocephalus and a patient with an
intracranial tumour. Our results demonstrate a clear distinction between different
anatomical regions in the normal volunteer and the evolution of the pathology in the
patients. In the normal volunteer, the brain parenchyma values for p and q fell into a
narrow band with 0.976,p,1.063 6 1023
mm2
s21
and 0.15,q,1.08 6 1023
mm2
s21
.
The noise appeared as a compact cluster with (p,q) components (0.011, 0.141) 6
1023
mm2
s21
, while the cerebrospinal fluid was (3.320, 0.330) 6 1023
mm2
s21
. In the
stroke patient, the ischaemic area demonstrated a trajectory composed of acute, sub-
acute and chronic phases. The components of the lesion were (0.824, 0.420), (0.884, 0.254),
(2.624, 0.325) at 37 h, 1 week and 1 month, respectively. The internal capsule of the
hydrocephalus patient demonstrated a larger dispersion in the p:q plane suggesting
disruption. Finally, there was clear white matter tissue destruction in the tumour patient.
In summary, the p:q decomposition enhances the visualization and quantification of MR
DTI data in both normal and pathological conditions.
Received 22 April 2003
Revised 24 May 2005
Accepted 1 June 2005
DOI: 10.1259/bjr/24908512
’ 2006 The British Institute of
Radiology
Magnetic resonance (MR) diffusion tensor imaging
(DTI) is a technique which allows the in vivo measure-
ment of water diffusion in biological tissues from which
tissue microstructure can be inferred [1–5]. It has been
used successfully to investigate a number of neurological
disorders that involve the disruption of white matter
fibres including schizophrenia [6], head injury [7],
multiple sclerosis [8] and stroke [9, 10]. In addition,
DTI data can be used with a set of computational
techniques called ‘‘tractography’’ [11] to reconstruct in
vivo white matter tracts in the human brain, which is a
very promising field, for example, to investigate their
disruption due to an expanding tumour [12].
Diffusion is properly described by a high-dimensional
mathematical quantity called a tensor. A tensor represents
the generalization of scalars and vectors and as such, it
contains more information than these. In three dimensions
a scalar has one element, a vector three elements and a
tensor nine elements. In order to quantify pathological
changes in the diffusion tensor, a transformation is
required which reduces the dimensionality of the tensor
and to this end a number of tensor scalar measures have
been proposed [1, 13]. From a theoretical point of view,
tensor calculus establishes that many such measures exist.
These include the lattice index (LI), relative anisotropy
(RA), fractional anisotropy (FA), the volume ratio (VR) and
ratios of the various eigenvalues (li), the mean diffusivity
(D), the Euclidean length of the tensor (L), its anisotropy
angle (w) and any algebraic combination of the first, second
and third invariants of the tensor [14].
From a practical point of view, however, only a limited
number of these measures are actually used in clinical
studies. In the MR DTI literature, the most common of
these measures are FA and D. Out of 30 recent studies on
clinical applications of DTI, encompassing diseases such
as schizophrenia, Alzheimer’s disease, stroke, multiple
sclerosis and head injury, 26 reported their results using
both FA and D [7, 9, 12, 15–36], while only four reported
D alone [37–40].
The caveat with exclusively using D and FA to
characterize pathology in clinical applications is that it is
not known a priori which tensor scalar measure is the most
appropriate to quantify pathological changes in brain tissue.
It is conceivable, for example, that a study might fail to
show significant changes when the diffusion tensor is
measured using FA but it may show differences when
using RA or L or some other measure. We have previously
Address correspondence to: Dr Jonathan H Gillard, University
Department of Radiology, Addenbrooke’s Hospital, Cambridge CB2
2QQ, UK.
The British Journal of Radiology, 79 (2006), 101–109
The British Journal of Radiology, February 2006 101](https://image.slidesharecdn.com/026britishjournalofradiology-britishinstituteofradiology-2006-130913065550-phpapp02/75/British-Journal-of-Radiology-British-Institute-of-Radiology-2006-eng-106-2048.jpg)
![shown this to be the case in acute stroke [34]. The
identification of which is the ‘‘best’’ measure of the
diffusion tensor is an empirical process, which will only
be resolved after a large number of experiments are
conducted and corroborated with external empirical infor-
mation, such as histology. In these circumstances it seems
reasonable to analyse as many scalar measures as possible,
and not rely solely on D and FA.
This article explores the novel application of a
mathematical technique to enhance the visualization
and quantification of brain tissue in MR DTI, which we
will term ‘‘p:q decomposition’’. The technique is based on
a tensor transformation, which decomposes the diffusion
tensor into its isotropic (p) and anisotropic (q) compo-
nents. In contrast to the standard practice in the literature
where only D and FA are analysed, this technique
permits the visualization simultaneously of seven scalar
measures. These are D, p, q, RA, FA, w, and L. This
technique is based on a classical decomposition used in
tensor calculus, already observed by the major contribu-
tions of Basser et al [13] and Pierpaoli et al [5], but which
has not been applied yet to visualize and quantify the
diffusion tensor in MR DTI.
In the following sections we will describe the
technique and apply it to data from a control volunteer
and three clinical examples.
Materials and methods
Theory
Diffusion in tissue can be mathematically represented as
a second-order Cartesian tensor, which in matrix form is:
Dij~
Dxx Dxy Dxz
Dyx Dyy Dyz
Dzx Dzy Dzz
2
6
4
3
7
5 ð1Þ
Given that the tensor is symmetric along its principal
diagonal, i.e. Dyx5Dxy, it has only six independent
components. From the tensor, the eigenvalues li are
calculated using a standard methodology, such as
singular value decomposition [41], as l1, l2 and l3.
According to tensor calculus, based on the eigenvalues
many possible scalar measures of the diffusion tensor
can be devised [42, 43].
The standard methodology in the DTI literature,
however, is to calculate only two scalar measures of
Dij. These are the mean diffusion (D) defined as:
D~
1
3
tr(Dij)~
l1zl2zl3
3
ð2Þ
where tr represents the trace of the tensor, and the
fractional anisotropy (FA) or the relative anisotropy (RA)
defined as:
FA~
ffiffiffi
3
2
r
ffiffiffiffiffiffiffiffiffiffiffiffiffiffiffiffiffiffiffiffiffiffiffiffiffiffiffiffiffiffiffiffiffiffiffiffiffiffiffiffiffiffiffiffiffiffiffiffiffiffiffiffiffiffiffiffiffiffiffiffiffiffiffiffi
(l1{D)2
z(l2{D)2
z(l3{D)2
q
ffiffiffiffiffiffiffiffiffiffiffiffiffiffiffiffiffiffiffiffiffiffiffi
l2
1
zl2
2
zl2
3
q
RA~
ffiffiffi
1
3
r
ffiffiffiffiffiffiffiffiffiffiffiffiffiffiffiffiffiffiffiffiffiffiffiffiffiffiffiffiffiffiffiffiffiffiffiffiffiffiffiffiffiffiffiffiffiffiffiffiffiffiffiffiffiffiffiffiffiffiffiffiffiffiffiffi
(l1{D)2
z(l2{D)2
z(l3{D)2
q
D
ð3Þ
The proposed technique is based on a classical tensor
decomposition, already observed by Basser et al [13] and
Pierpaoli et al [5]. Our contribution is to construct a
graphical representation of the diffusion tensor based on
this decomposition. This transformation has its conceptual
roots in the mathematical theory of continuum mechanics
[44, 45]. We will term the technique p:q decomposition.
Using this methodology, the first step is to decompose
the diffusion tensor from Equation (1) according to the
next equation:
Dij~DIijz½DijÀDIijŠ ð4Þ
into two tensors P and Q, i.e. Dij5Pij+Qij. Here Iij is the
identity tensor Iij5diag(1,1,1). The first term on the right
hand side of Equation (4) is the isotropic tensor, while
the second term (in brackets) represents the deviatoric
tensor. The magnitude of these tensors can be denoted by
its isotropic (p) and anisotropic (q) components. The
values of p and q can be computed as:
p~
ffiffiffi
3
p
D ð5Þ
and
q~
ffiffiffiffiffiffiffiffiffiffiffiffiffiffiffiffiffiffiffiffiffiffiffiffiffiffiffiffiffiffiffiffiffiffiffiffiffiffiffiffiffiffiffiffiffiffiffiffiffiffiffiffiffiffiffiffiffiffiffiffiffiffiffiffi
(l1{D)2
z(l2{D)2
z(l3{D)2
q
ð6Þ
According to these definitions p is therefore a scaled
measure of the mean diffusion in the tensor, while q is a
measure of the variance or deviation of the eigenvalues
with respect to the mean diffusion of the tensor.
The second step is to plot each tensor as a point in a
Cartesian plane with p taken as the x-axis and q as the y-
axis, as in Figure 1a. This plane will be denoted as the p:q
plane. The effect of this transformation is to reduce the
dimensionality of the tensor from six dimensions to two.
The third step is to use the p:q plane to deduce the five
additional tensor scalar measures: D, RA, FA, L and w.
Four of these seven tensor measures (q, RA, FA, w) are
anisotropy measures, while D and p are measures of the
magnitude of diffusion and L is a measure of the total
diffusion of the tensor. D, p, q and L have units of
1023
mm2
s21
, RA and FA are dimensionless, and w has
units of degrees.
These scalar measures can be deduced either analyti-
cally or graphically. The analytical method is to directly
compute the measures based on the p,q components
using the formulae:
L~
ffiffiffiffiffiffiffiffiffiffiffiffiffiffi
p2zq2
p
, RA~
q
p
, FA~
ffiffiffi
3
2
r
q
L
, w~ tan{1 q
p
ð7Þ
However, the real advantage of using the p:q plane is that
we can obtain these values directly from the graph as
follows. Consider a tensor A from which we can com-
pute its location in the p:q plane using Equations (5) and
(6) as po and qo. Therefore, Lo is the distance between the
origin of coordinates and the point (po,qo); wo is the angle
subtended between the p axis and a line originating in
the centre of coordinates and passing through point
(po,qo), i.e. the segment Lo; RAo is the ratio between qo and
po; FAo is the ratio between qo and Lowith scale factorffiffiffiffiffiffi
3=2
q
1:22; D is 1ffiffi
3
p 0:57 of the value in the p axis.
A Pen˜ a, H A L Green, T A Carpenter et al
102 The British Journal of Radiology, February 2006](https://image.slidesharecdn.com/026britishjournalofradiology-britishinstituteofradiology-2006-130913065550-phpapp02/75/British-Journal-of-Radiology-British-Institute-of-Radiology-2006-eng-107-2048.jpg)
![Figure 1b illustrates the geometrical relationship
between these various quantities.
Data acquisition
In order to illustrate the use of the p:q decomposition
with clinical data, four representative cases were selected.
The first comprised five regions of interest (ROIs) in a
healthy 27-year-old volunteer (to illustrate spatial varia-
tion in the tensor field, as in Figure 1c). The second reports
the findings in a 76-year-old hypertensive woman who
presented with a sudden onset of expressive dysphasia
and right-sided hemiparesis. Imaging of her left middle
cerebral artery territory stroke was undertaken at 37 h, 1
week and 3 months from stroke onset to illustrate the
temporal variation in the tensor field (Figure 1d). The third
case is a 85-year-old female hydrocephalus patient with a
history of gait ataxia, falls and memory problems. And
finally, the fourth case is a 46-year-old male patient with a
WHO Grade II oligodendroglioma.
The Local Research Ethics Committee approved the
study and informed consent was obtained. The diffusion
tensor data sets were acquired using a 5 mm slice
thickness. Imaging was performed on a 3 Tesla magnetic
resonance machine (Bruker Medspec S300; Bruker
Medical, Ettlingen, Germany). A single shot spin echo,
echo planar imaging technique, with Stejskal-Tanner
diffusion sensitizing pulses [46] was used. Imaging
parameters were: repetition time (TR)55070 ms, echo
time (TE)5107 ms, a590˚, d521 ms and D566 ms. Eight
interleaved supratentorial slices were acquired with a
phase template in a near axial plane, using a 128 6 128
matrix, field of view of 25 cm 6 25 cm. For each slice,
images were collected from 12 non-collinear gradient
directions [47]. For each gradient direction an unweighted
bo image and five diffusion weighted images were
collected at equally spaced b-values in the range
bmin5318 s mm22
to bmax51541 s mm22
. Using a spe-
cially-written program in MATLAB (The MathWorks Inc.,
Natick, MA) the diffusion tensor was computed on a voxel
by voxel basis, using a singular value decomposition
algorithm to fit the signal intensities to the Stejskal-Tanner
equation, following the method proposed by Basser et al
[1, 2]. From the tensor, the p and q components were
calculated based on Equations (5) and (6), and D, RA, FA,
w, and L using Equations (2) and (7).
Results
Normal volunteer
D and FA maps of the volunteer were used to select
square anatomical ROIs of 5 6 5 voxels, which were
subsequently averaged to obtain a mean value for the
ROI. These were placed in the corpus callosum (CC),
occipital cortex (Cx), cerebrospinal fluid (CSF), internal
capsule (IC) and noise regions, as illustrated in
Figure 2a,b. When these ROIs were plotted in the p:q
plane, they formed clearly segregated clusters (Figure 2c).
The spherical diffusion and deviatoric diffusion fell
within a narrow band with 0.976,p,1.063 6
1023
mm2
s21
for the three structures in brain parench-
yma, i.e. CC, IC, Cx, D50.607, 0.563, 0.613 6
1023
mm2
s21
and p51.052, 0.976, 1.063 6
1023
mm2
s21
, respectively. In contrast, all the other
measures varied substantially, with a range bounded by
maximum values for the CC (q51.086, L51.032) 6
1023
mm2
s21
and RA50.879, 45.9˚, FA51.512, and
Figure 1. (a) A point representing a
sample of tissue in the p:q plane.
The x axis corresponds to the
isotropic component of diffusion (p)
and the y axis the anisotropic
component of diffusion (q). Any
tensor can be decomposed into its p
and q components po and qo, which
will correspond to a point in the p:q
plane. (b) Starting from a point in
the p:q plane, we can deduce the
standard anisotropy measures RA
and FA using simple geometry. Both
of these measures will be
proportional to the angle w, in fact
RA is proportional to the tangent
and FA proportional to the sine. (c)
Two tissues will, in general, have
different p and q components. Thus
a tissue A with components pA and
qA, will have a different location
from a tissue B with components pB
and qB. (d) A tissue A in general will
have different p and q components
at different times. By plotting these
different components in the p:q
plane we can obtain a trajectory
that illustrates the evolution of
tissue in time. In this example we see
a trajectory demonstrating three
time points for tissue A.
Enhanced visualization and quantification in MR DTI
The British Journal of Radiology, February 2006 103](https://image.slidesharecdn.com/026britishjournalofradiology-britishinstituteofradiology-2006-130913065550-phpapp02/75/British-Journal-of-Radiology-British-Institute-of-Radiology-2006-eng-108-2048.jpg)

![(Figure 3a). To clarify presentation and due to the
multiple number of ROIs used, all variables analysed
were averaged within each ROI to obtain a mean value
and standard deviation. For each ROI the mean is in the
crossing of the bars which represent the magnitude of
standard deviation. The lesion (ischaemic region) in the
stroke patient described a trajectory in the p:q plane
composed of three phases, which occupied the regions:
0.824,p,2.624 6 1023
mm2
s21
and 0.25,q,0.42 6
1023
mm2
s21
. The (p,q) components of the lesion ROI
were (0.824, 0.420), (0.884, 0.254), (2.624, 0.325) at 37 h, 1
week and 1 month, respectively. All these results are
shown in Figure 3b.
The corresponding contralateral control ROIs
(Figure 3a, shown in blue), in contrast, demonstrated
only a small degree of change, remaining in the region
1.154,p,1.288 6 1023
mm2
s21
and 0.47,q,0.77 6
1023
mm2
s21
. The (p,q) components of the control ROI
were (1.154, 0.475), (1.229, 0.777), (1.288, 0.586) at 37 h, 1
week and 1 month, respectively.
Results for the seven scalar measures are presented in
Table 1.
Hydrocephalus patient
We have investigated microstructural changes in the
internal capsule associated with the ventricular dilatation
in this patient. For this analysis, four ROIs have been
selected (twointhe patient bilaterallyand twointhecontrol
volunteer bilaterally) in one axial slice corresponding to the
posterior limb of the internal capsule (IC) at the level of the
foramen of Monro. Each ROI was composed of nine voxels.
As a comparison, the same regions were selected in a
control volunteer in the same manner. The results were: for
the patient p51.29¡0.466, q50.85¡0.054 for the left IC and
p50.96¡0.195, q50.86¡0.147 for the right IC; and for the
control, p51.01¡0.023, q50.80¡0.084 for the left IC, and
p50.96¡0.034, q50.84¡0.159 for the right IC. All the p, q
units are in 1023
mm2
and are illustrated in Figure 4. These
results demonstrate that while the mean values of the four
ROIs are roughly similar, there is a marked increase in the
dispersion of the voxels in the IC of the patient.
Tumour patient
In this patient we investigated the hypothesis that
there are significant differences between the microstruc-
ture in the tumour region and an equivalently-located
contralateral control. For this analysis, two ROIs have
been selected in the patient in one axial slice: one in the
tumour region (the posterior pericallosal region) and
another in the equivalent normal-appearing contralateral
control region. For the tumour: p52.26¡0.210, q5
0.37¡0.049, while for the contralateral control region p
51.331¡0.128, q50.71¡0.134. All the p, q units are in
1023
mm2
and are illustrated in Figure 5. These results
demonstrate both an increase in the isotropic component
of diffusion and a decrease in the deviatoric component.
We can interpret these changes as suggesting a loss in the
microstructure of tissue, as a decrease in the density of
fibres (more intercellular space) and a loss in fibre
coherence. These changes are consistent with previous
reports [48].
Discussion
We have presented a technique that permits the
simultaneous visualization of multiple tensor scalar
measures from MR DTI data. In particular, we have
shown how, from a single graph (the p:q plane), it is
possible to deduce seven scalar measures of the diffusion
tensor, including D, p, q, RA, FA, w, and L. This
represents an improvement on the standard methodol-
ogy in the MR DTI literature in which only two scalar
measures (typically FA and D) are displayed.
There have already been a number of studies in the
literature that have considered plotting simultaneously
two tensor scalar measures, particularly FA and D. These
include Pierpaoli et al [5] who distinguished various
brain regions based on decomposing the tensor in terms
of D and the volume ratio (VR). Werring et al [8] in an
investigation of normal-appearing white matter lesions
in multiple sclerosis, and Wieshmann et al [49] and Jones
et al [50] have also demonstrated the potential of plotting
FA and D simultaneously. Plotting D vs FA, however,
Table 1. Data from the MR diffusion tensor imaging (DTI) acquisitions for the normal volunteer (upper set) and the stroke
patient (lower set)
Normal volunteer
D p q RA FA w L
Corpus callosum 0.607 1.052 1.086 1.032 0.879 45.92 1.512
Internal capsule 0.563 0.976 0.684 0.701 0.703 35.05 1.192
Cortex 0.613 1.063 0.150 0.141 0.171 8.06 1.073
Noise 0.007 0.011 0.141 12.145 1.220 85.29 0.142
Cerebrospinal fluid 1.917 3.320 0.330 0.099 0.121 5.68 3.336
Stroke patient
D p q RA FA w L
37 h (lesion) 0.476 0.824 0.420 0.510 0.556 27.03 0.925
37 h (control) 0.666 1.154 0.475 0.412 0.466 22.39 1.248
1 week (lesion) 0.511 0.884 0.254 0.287 0.338 16.02 0.920
1 week (control) 0.709 1.229 0.777 0.632 0.654 32.29 1.454
1 month (lesion) 1.515 2.624 0.325 0.124 0.150 7.07 2.644
1 month (control) 0.743 1.288 0.586 0.455 0.507 24.48 1.415
Mean diffusion (D), isotropic component of diffusion (p), anisotropic component of diffusion (q), anisotropy angle (w), fractional
anisotropy (FA), relative anisotropy (RA), Euclidean length (L).
Enhanced visualization and quantification in MR DTI
The British Journal of Radiology, February 2006 105](https://image.slidesharecdn.com/026britishjournalofradiology-britishinstituteofradiology-2006-130913065550-phpapp02/75/British-Journal-of-Radiology-British-Institute-of-Radiology-2006-eng-110-2048.jpg)

![RA, FA). In this context, several interesting observations
from both the normal volunteer and the stroke patient
have been possible by using the p:q technique.
Normal volunteer
The first observation is that the p:q plane provides a
graphical means to understand the complex equations
that describe RA and FA. From Figure 1b and Equation
(7), one can easily observe that both RA and FA are
composite measures of other more basic tensor quan-
tities. In particular, RA is simply the ratio between q and
p, and FA the ratio between q and L scaled by a factor
of
ffiffiffiffiffiffi
3=2
q
1:22.
The second observation is that the p:q plane explains
some anomalies when using FA and RA as measures of
anisotropy. For example, if we take the value of FA for
noise from Table 1, we obtain the theoretical maximum
FA value of 1.22. This is confusing, as one would not
expect empty space to have a large degree of organiza-
tion (anisotropy). This paradoxical result is in fact a
methodological artefact in using FA as an anisotropy
measure, and is due to the presence of L in the
denominator of FA. Given that the diffusion of empty
space should be zero (or close to zero due to experi-
mental error), a very small L will imply a very large FA.
Thus FA is a measure of tissue anisotropy, but weighted
by its total diffusion. The same argument applied to the
value of RA, which gives the enormous value of 12
(while the corpus callosum, for instance, is 1.032).
The third observation is the insight that q might offer
as a measure for the background noise in the data.
Equation (6) can be interpreted in statistical terms such
that q is a measure of the variance of the eigenvalues of
the tensor with respect to the mean diffusion D.
Therefore, isotropic elements in the data (such as the
empty space, Cx and the CSF) should theoretically have
all the eigenvalues equal and thus a q equal to zero.
However, due to experimental error, background noise
and other MR acquisition influences, there is a small
discrepancy and the eigenvalues are not exactly the
same. Our results show that Cx and the noise have
approximately the same q values (0.141 and 0.15), while
the CSF presented a larger dispersion (q50.330), which
might be attributed to the contribution of diffusion and
bulk flow during the acquisition time.
Stroke patient
The first observation is the ability of the p:q planes to
visually convey simultaneous changes in the isotropic
and anisotropic components of the diffusion tensor as
they change in time, in other words the ‘‘trajectory’’ of
the tensor. In addition to the qualitative nature of the
trajectory, the magnitude of tensor changes can be read
directly from the p and q axes of the plots. In our
example, the trajectory describing the lesion evolution is
composed of three segments or phases (Figure 3b),
which can be interpreted in biological terms as the acute
(reduction in p, reduction in q), sub-acute (pseudonor-
malization of p, while q remains reduced) and chronic
(increase in p, while q remains reduced) phases that have
been well-documented in association with stroke [9].
A second observation demonstrates another methodo-
logical artefact or anomaly of FA and RA. Close
inspection of Figure 3b demonstrates that the lesion
clusters (shown in red) with respect to the control
clusters (shown in blue) are displaced first above a line of
constant FA in the acute phase (37 h) and subsequently
below this line in the sub-acute phase (1 week), as shown
in the inset. As both RA and FA are functions of the
angle w, this would imply that they are increased in the
lesion as compared with the control, which is absurd.
This paradox of increased tissue anisotropy (as mea-
sured in terms of RA or FA) was reported by Nusbaum
and colleagues [51] in normal ageing. As we have
explored in more detail in the case of acute stroke [34],
the p:q technique provides a graphical explanation of
why this can be the case, and that this apparent increase
in anisotropy (as measured in terms of RA or FA) can be
Figure 5. This is the p:q diagram of
a patient with a Grade II
oligodendroglioma in the posterior
pericallosal white matter. The
location of the regions of interest
(ROIs) is indicated in the inset
(above), and the patient’s MR fluid
attenuation inversion recovery
(FLAIR) image (below). Compared
with the control region, the tumour
region demonstrates both an
increase in isotropic diffusion (p)
and a decrease in deviatoric
diffusion (q). This tissue signature is
consistent with the destruction of
white matter tracts in the tumour
region.
Enhanced visualization and quantification in MR DTI
The British Journal of Radiology, February 2006 107](https://image.slidesharecdn.com/026britishjournalofradiology-britishinstituteofradiology-2006-130913065550-phpapp02/75/British-Journal-of-Radiology-British-Institute-of-Radiology-2006-eng-112-2048.jpg)
![purely a graphical consequence of the manner in which
FA and RA are calculated and thus a methodological
artefact. Quantitatively, the anisotropy measured with
FA and RA of the lesion’s acute phase (37 h): RA
increased from 0.412 to 0.510 (or +24%) and FA increased
from 0.466 to 0.556 (or +19%). In contrast, q decreased
from 0.475 to 0.420 (or 212%). This behaviour suggests,
albeit tentatively, that theoretically q may detect early
changes in tissue anisotropy that are misrepresented by
RA and FA.
A third observation is that during the sub-acute phase
(1 week after the stroke), the best sensitivity to the
pathology is offered by q rather than by FA or RA. q was
reduced from 0.777 to 0.254 (267%), In contrast, FA and
RA decreased by the smaller amounts of 0.632 to 0.287
(255%), and 0.654 to 0.338 (248%), respectively.
Based on the previous observations, we can conclude
that, at least in some circumstances, some non-standard
anisotropy measures (such as q) can provide a higher
sensitivity to detect pathological conditions than stan-
dard measures such as RA and FA. We have also shown
that RA and FA have the potential to give ‘‘paradoxical’’
results and thus must be used with caution. However,
this analysis does not resolve what is perhaps the most
important question in MR DTI: from all the various
tensor measures, which one is the best one to character-
ize damage to brain tissue? As has been recently noted
by Pierpaoli et al [23], the fact remains that we do not
know a priori which is the best measure because this is
not a theoretical question but an empirical one. It is
equivalent to asking which statistical measure, e.g. the
mean or the variance for example, will better describe a
population. They describe different aspects of a popula-
tion and therefore will be useful in answering different
questions. Tensor calculus can only help by defining
which measures can be used in our analysis. Which one
best describes some aspect of the brain (be it a tissue type
or a pathological condition, such as oedema or necrosis)
can only be answered empirically, by relating the
observed tensor measures with independent biological
data such as histology, other imaging modalities and/or
cognitive tests.
Hydrocephalus patient
The disruption observed in IC using the p:q diagram
from the hydrocephalus patient is encouraging. In
patients with hydrocephalus it is common to observe
clinical symptoms that are thought to be associated with
the disruption of deep white matter tracts. Similar
findings were observed in this patient at the level of the
internal capsule (IC). It has been suggested that during
ventricular dilatation, these tracts are being stretched and
thus become mechanically compromised. Our results
support this notion by demonstrating that the MR DTI
diffusion signature of the IC is altered. In particular, this
disruption is not due to changes in the anisotropy of tissue
but to changes in its mean diffusion. This suggests that the
white matter tracts have been disrupted.
Tumour patient
In the case of the tumour patient, the p:q decomposi-
tion was useful to illustrate simultaneously changes in
both the isotropic and the anisotropic components of the
diffusion tensor. There was a decrease in anisotropy (q)
and an increase in mean diffusion (p). These changes are
thought to be associated with white matter destruction.
There are a number of limitations in using the p:q
decomposition. Just like D, RA and FA, the location of
tissue in the p:q plane does not give information about
the directionality of diffusion. Also, there are other
important tensor scalar measures that are not directly
conveyed by the p:q plane, such as the eigenvalues and
the tensor invariants. Finally, from a practical point of
view, the p:q decomposition must be applied to other
brain pathologies in order to establish how beneficial it
might be in those situations.
Conclusion
The p:q tensor decomposition enhances the visualiza-
tion and quantification of MR DTI data in both normal
and pathological conditions. In particular it is an aid to
visualize simultaneously seven scalar tensor measures.
We have also shown the pitfalls of using FA and RA
exclusively, and the potential of using other tensor
measures, particularly q. However, it is important to note
that, despite the enhanced visualization and quantifica-
tion provided by our technique, the choice of which
tensor scalar measure best describes brain tissue and its
changes remains an empirical matter. We hope that the
enhanced repertoire of analysis tools that we propose
might enable improved categorization of tensor abnorm-
alities in pathology.
Acknowledgments
AP is in receipt of a Wellcome Trust Fellowship in
Mathematical Biology. The Cambridge Commonwealth
Trust supports HALG. The Medical Research Council
Technology Foresight grant and the Wolfson Foundation
support the Wolfson Brain Imaging Centre. We acknowl-
edge the help of radiographers Tim Donovan, Victoria
Lupson and Ruth Bisbrown-Chippendale, the many useful
discussions with Dr Neil G Harris, Dr Brian K Owler, Dr
Luzius A Steiner and Dr Shahan Momjian, as well as the
excellent computing support of Mr Julian Evans.
References
1. Basser PJ. Inferring microstructural features and the
physiological state of tissues from diffusion-weighted
images. NMR Biomed 1995;8:333–44.
2. Basser PJ, Mattiello J, LeBihan D. Estimation of the effective
self-diffusion tensor from the NMR spin echo. J Magn
Reson B 1994;103:247–54.
3. Basser PJ, Mattiello J, LeBihan D. MR diffusion tensor
spectroscopy and imaging. Biophys J 1994;66:259–67.
4. Pierpaoli C, Basser PJ. Toward a quantitative assessment of
diffusion anisotropy. Magn Reson Med 1996;36:893–906.
5. Pierpaoli C, et al. Diffusion tensor MR imaging of the
human brain. Radiology 1996;201:637–48.
6. Foong, J, et al. Neuropathological abnormalities of the corpus
callosum in schizophrenia: a diffusion tensor imaging study.
J Neurol Neurosurg Psychiatry 2000;68:242–4.
7. Arfanakis K, et al. Diffusion tensor MR imaging in diffuse
axonal injury. AJNR Am J Neuroradiol 2002;23:794–802.
A Pen˜ a, H A L Green, T A Carpenter et al
108 The British Journal of Radiology, February 2006](https://image.slidesharecdn.com/026britishjournalofradiology-britishinstituteofradiology-2006-130913065550-phpapp02/75/British-Journal-of-Radiology-British-Institute-of-Radiology-2006-eng-113-2048.jpg)

![PET-CT findings in surgically transposed ovaries
1,2,3
R ZISSIN, MD, 1
U METSER, MD, 1
H LERMAN, MD, 1
G LIEVSHITZ, MD, 4
T SAFRA, MD and
1,3
E EVEN-SAPIR, MD, PhD
Department of 1
Nuclear Medicine and 4
Oncologic Surgery Unit, Tel-Aviv Sourasky Medical Center
and the Department of 2
Diagnostic Imaging, Sapir Medical Center, Kfar Saba, affiliated to the
3
Sackler Faculty of Medicine, Tel-Aviv, Israel
ABSTRACT. The aim of this study is to present the PET/CT findings of surgically
transposed ovaries. PET/CT studies and associated abdominal imaging studies of seven
women, aged 28–43 years, with 11 transposed ovaries were retrospectively reviewed.
Attention was directed to the location and the 18
F-Fluorodeoxyglucose (FDG) avidity of
the transposed ovaries. On the CT part of the PET/CT, location of the transposed ovaries
was in the ipsilateral iliac fossa or paracolic gutter abutting the anterior aspect of the
ipsilateral colon (n56), posterolateral to the cecum (n54) and in the anterior
abdominal cavity (n51). Ovaries were of soft-tissue density (n510 with a hypodense
region in two) and one was cystic. In three patients, the transposed ovary was
associated with increased FDG uptake with standard uptake values ranging from 2.4 to
4.8. Two of the latter patients had more than one PET/CT study. FDG uptake altered
between studies, probably related to the performance of the study on different phases
of the cycle. Menstrual history in one of the patients confirmed that the study was
performed at the ovulatory-phase of the cycle. To conclude, a transposed ovary may
appear on a PET-CT study as a mass with occasionally increased FDG uptake that may be
related to its preserved functionality. Physicians interpreting PET/CT should be aware of
surgically transposed ovaries in young female patients to avoid misdiagnosing it as
tumour.
Received 17 February 2005
Revised 21 May 2005
Accepted 15 June 2005
DOI: 10.1259/bjr/33143536
’ 2006 The British Institute of
Radiology
Pelvic radiation therapy for cervical, vaginal or colo-
rectal cancer often leads to ovarian failure. Ovarian
transposition outside the radiation field, to the paracolic
gutter or iliac fossa, is a surgical procedure performed to
preserve ovarian function mainly in young females with
early stages of cervical carcinoma [1]. On imaging, the
transposed ovary may appear as a small soft-tissue mass,
often with one or more tiny cysts, or alternatively as a
larger intraperitoneal cystic mass which may show
functional, periodic changes on follow-up studies, accord-
ing to the expected changes in the ovary during the
different phases of the menstruation cycle. Surgical clips
are usually placed to permit identification of
the transposed ovary [2–5]. In oncologic patients, the
recognition of the position and the appearance of the
transposed ovary are crucial to avoid misinterpreting it as a
tumour. We have encountered 10 18
F-Fluorodeoxyglucose
(FDG) PET/CT studies in 7 females with 11 surgically
transposed ovaries and we present their imaging findings
on PET/CT and conventional abdominal imaging.
Materials and methods
We reviewed the clinical data and imaging studies of
seven female oncologic patients (aged 28–43 years) after
ovarian transpositions who were referred for PET/CT
studies. Ovarian transposition was bilateral in four
patients and unilateral in the other three. Five women
had carcinoma of the cervix, one had a rectovaginal cleft
mucinous adenocarcinoma and one had uterine non-
Hodgkin’s lymphoma. Six patients reported amenor-
rhoea after hysterectomy and one was menstruating.
Two of the study patients had more than one PET/CT
study, at different time points in the menstruation cycle,
available for assessment. One patient had two studies
and the other had three. Five PET/CT studies were
performed for findings suggestive of recurrence that
were detected on physical examination and/or seen
on MRI or diagnostic CT performed for follow-up. In two
patients, five follow up PET-CT studies were performed,
for re-staging and for monitoring response to treatment.
PET-CT scan was performed following the adminis-
tration of iodinated oral contrast material and after
intravenous injection of 370–666 MBq (10–18 mCi) of
18
FDG. Low-dose CT scanning was performed (140 kV,
80 mA, 0.8 s per CT rotation, pitch of 6, and table speed
of 22.5 mm s21
) during normal respiration. PET scanning
was performed immediately following the CT without
changing the patient position. Images were interpreted at
a work-station (Xeleris Elgems, Haifa, Israel) equipped
with fusion software that enables the display of PET, CT
and fused PET/CT images.
Results
The clinical and imaging findings of the patients are
summarized in Table 1. All 11 transposed ovaries were
Address correspondence to: Einat Even-Sapir, Department of
Nuclear Medicine, Tel-Aviv Sourasky Medical Center, 6 Weizman
Street, Tel-Aviv, 64239 Israel.
The British Journal of Radiology, 79 (2006), 110–115
110 The British Journal of Radiology, February 2006](https://image.slidesharecdn.com/026britishjournalofradiology-britishinstituteofradiology-2006-130913065550-phpapp02/75/British-Journal-of-Radiology-British-Institute-of-Radiology-2006-eng-115-2048.jpg)


![This increased ovarian uptake was not detected on a
previous PET/CT study, performed not at the ovulatory
phase, associated with an altered appearance of the
ovary, seen on the CT part of that study, as a hypodense
mass.
Discussion
Ovarian transposition was described by McCall et al
in 1958 for young (,40 years old) females with an
early-stage cervical carcinoma planned for pelvic
radiosurgical treatment, to maintain ovarian function
[6]. The procedure may be unilateral or bilateral,
performed at the time of the radical hysterectomy or
staging lymphadenectomy [1]. The repositioning of the
ovary outside the radiation field may be above the iliac
crest, into the ipsilateral paracolic gutter or lower down,
below the iliac crest lateral to the iliopsoas muscle [2].
The normal transposed ovary may appear on abdom-
inal CT as a soft-tissue mass, sometimes with small cysts
or as a predominant cystic lesion, mimicking a peritoneal
or retroperitoneal tumour implants. The location of the
transposed ovary on CT is generally either adjacent to
the ascending or descending colon, or in the upper pelvis
lateral to or anterolateral to the psoas muscle [2–5].
However, in one of our patients, the transposed ovary
was in an atypical location, i.e. in the anterior abdominal
cavity between the abdominal wall musculature and the
small bowel loops, mimicking a peritoneal implant.
Adjacent surgical clips assisted in identifying it as a
transposed ovary.
Lack of familiarity with the procedure as well as with
the CT features of a transposed ovary may lead to a
diagnostic error in the interpretation of abdominal CT or
MR imaging, misdiagnosing the transposed ovary as a
metastatic deposit. It was the case in five of our patients,
who were referred for a PET/CT study for a ‘‘suspected’’
tumoural recurrence on either CT or MRI. A right-sided
transposed ovary should also be differentiated from a
mucocele of the appendix, although an appendectomy is
usually performed at the time of the surgical procedure
[5]. In one of our patients, the appendix was not removed
and was identified separately from the ovary on the CT
part of the study, obviating such an interpretation
mistake.
Recently, hybrid systems composed of PET and
CT have been introduced in addition to conventional
(c)
Figure 1. (Cont.) (c) Coronal PET-CT images (from left to right: CT, PET and fused PET/CT images) show mild increased FDG uptake
in the left transposed ovary (arrows). Physiological FDG uptake is seen in the brain, myocardium, bowel and liver.
PET-CT findings in surgically transposed ovaries
The British Journal of Radiology, February 2006 113](https://image.slidesharecdn.com/026britishjournalofradiology-britishinstituteofradiology-2006-130913065550-phpapp02/75/British-Journal-of-Radiology-British-Institute-of-Radiology-2006-eng-118-2048.jpg)

![cross-sectional imaging methods in the routine practice
of oncologic patients for staging, monitoring response to
treatment and assessment of recurrence. PET and CT
data, acquired at the same clinical setting, with genera-
tion of fused PET/CT images, provide both functional
and anatomical information [7]. A transposed ovary may
show increased FDG uptake on the PET part of the study
due to functional changes, as was seen in three of our
patients. FDG uptake in normal ovaries was reported in
pre-menopausal patients without a known ovarian
malignancy at mid-menstrual cycle. In oligomenorrhoeic
patients too, FDG uptake may be high and resemble the
uptake values found at mid-cycle [8]. In menstruating
patients, the physiological cause of uptake may be sorted
out by discussing the menstruation history with the
patient. However, as ovarian transposition is carried out
primarily in patients with gynaecological malignancies
that are often post-hysterectomy, their ovulatory-phase
cannot be determined by history alone. Therefore, when
detecting a focal increased abdominal uptake on PET in a
young female patient, the possibility of a functional
uptake in a transposed ovary should be born in mind
and adjacent surgical clips should be looked for on the
CT part of the study. Directly interviewing the patient
may also assist, as unfortunately the information of
ovarian transposition is often omitted from the referral
sheath for a PET/CT study. It was, indeed, not provided
in any of our patients.
In conclusion, the physician interpreting a PET/CT
study should be familiar both with the clinical history
and the imaging findings of ovarian transposition.
Increased FDG uptake in a transposed ovary may be
related to its preserved functionality.
References
1. Morice P, Juncker L, Rey A, El-Hassan J, Haie-Meder C,
Castaigne D. Ovarian transposition for patients with cervical
carcinoma treated by radiosurgical combination. Fertil Steril
2000;74:743–8.
2. Newbold R, Safrit H, Cooper C. Surgical lateral ovarian
transposition: CT appearance. AJR Am J Roentgenol
1990;154:119–20.
3. Goldberg RE, Sturgeon JF. Surgically transposed ovary
presenting as an intraperitoneal mass on computed tomo-
graphy. Can Assoc Radiol J 1995;46:229–30.
4. Kier R, Chambers SK, Kier R, Chambers SK. Surgical
transposition of the ovaries: imaging findings in 14 patients.
AJR Am J Roentgenol 1989;153:1003–6.
5. Bashist B, Friedman WN, Killackey MA. Surgical transposi-
tion of the ovary: radiologic appearance. Radiology
1989;173:857–60.
6. McCall ML, Keaty EC, Thompson JD. Conservation of
ovarian tissue in the treatment of the carcinoma of the
cervix with radical surgery. Am J Obstet Gynecol
1958;75:590–600.
7. Rohren EM, Turkington TG, Coleman RE. Clinical
applications of PET in oncology. Radiology 2004;231:
305–32.
8. Lerman H, Metser U, Grisaru D, Fishman A, Lievshitz G,
Even-Sapir E. Normal and abnormal 18F-FDG
endometrial and ovarian uptake in pre- and postmeno-
pausal patients: assessment by PET/CT. J Nucl Med
2004;45:266–71.
Figure 2. A 39-year-old patient with a previous hysterectomy for uterine non-Hodgkin’s lymphoma, referred for suspected
central nervous system recurrence (patient no. 6). (a) On PET data (from left to right: coronal, sagittal and transaxial images)
increased FDG uptake was detected in the right abdomen (arrows). (b) On PET-CT (from left to right: CT, PET and fused PET/CT
images) the increased uptake corresponded in location to a soft-tissue mass posterolateral to the cecum, adjacent to surgical
clips, identified as a transposed ovary (arrows). (c) PET/CT study performed 6 months later, without treatment in the interim. The
transposed ovary shows no increased uptake, confirming the functional aetiology of FDG uptake on the first study (arrow).
PET-CT findings in surgically transposed ovaries
The British Journal of Radiology, February 2006 115](https://image.slidesharecdn.com/026britishjournalofradiology-britishinstituteofradiology-2006-130913065550-phpapp02/75/British-Journal-of-Radiology-British-Institute-of-Radiology-2006-eng-120-2048.jpg)
![An audit of imaging test utilization for the management of
lymphoma in an oncology hospital: implications for resource
planning?
A SCHWARTZ, BSc, M K GOSPODAROWICZ, MD, K KHALILI, MD, M PINTILIE, MSc, S GODDARD, BSc,
A KELLER, MD and R W TSANG, MD
University of Toronto, Princess Margaret Hospital, University Health Network, 610 University
Avenue, Toronto, Ontario, M5G 2M9 Canada
ABSTRACT. The purpose of this study was to assist with resource planning by examining
the pattern of physician utilization of imaging procedures for lymphoma patients in a
dedicated oncology hospital. The proportion of imaging tests ordered for routine
follow up with no specific clinical indication was quantified, with specific attention to
CT scans. A 3-month audit was performed. The reasons for ordering all imaging
procedures (X-rays, CT scans, ultrasound, nuclear scan and MRI) were determined
through a retrospective chart review. 411 lymphoma patients had 686 assessments (sets
of imaging tests) and 981 procedures (individual imaging tests). Most procedures were
CT scans (52%) and chest radiographs (30%). The most common reasons for ordering
imaging were assessing response (23%), and investigating new symptoms (19%).
Routine follow up constituted 21% of the assessments (142/686), and of these, 82%
were chest radiographs (116/142), while 24% (34/142) were CT scans. With analysis
restricted to CT scans (296 assessments in 248 patients), the most common reason for
ordering CT scans were response evaluation (40%), and suspicion of recurrence and/or
new symptom (23%). Follow-up CT scans done with no clinical indication comprised 8%
(25/296) of all CT assessments. Staging CT scans were under-represented at 6% of all
assessments. Imaging with CT scans for follow up of asymptomatic patients is
infrequent. However, scans done for staging new lymphoma patients were
unexpectedly low in frequency, due to scans done elsewhere prior to referral. This
analysis uncovered utilization patterns, helped resource planning and provided data to
reduce unnecessary imaging procedures.
Received 26 April 2005
Revised 1 June 2005
Accepted 22 June 2005
DOI: 10.1259/bjr/27372198
’ 2006 The British Institute of
Radiology
Lymphoma clinicians rely heavily on imaging techni-
ques to determine the stage of disease at initial
presentation, to assess the response to treatment and to
follow the disease over time [1]. CT scans remain the
standard for evaluation of nodal disease [2], while MRI
gives additional information for some extranodal sites.
Gallium scans and/or 18
FDG-PET scans are also useful
tools in the staging and follow-up where they help to
distinguish residual fibrotic mass from viable lymphoma
[3, 4]. After treatment has been completed and providing
a complete remission has been achieved, the goal of
follow-up investigations is to identify recurrent disease
before symptoms develop [5]. However, routine CT
imaging for follow up has not been shown to be cost-
effective, as investigation of symptoms is the most cited
reason for finding recurrent disease [6–13]. Several
studies documented that only 5–9% of relapses were
imaging-detected before the development of symptoms
[5, 11, 13].
At a dedicated oncology hospital, the policy for
lymphoma patients has not been to perform routine CT
imaging for follow up of asymptomatic patients beyond
the attainment of complete remission of disease. Taking a
chest radiograph has been left to the discretion of the
attending physician. This is in agreement with published
studies that suggested CT scan should be performed
according to clinical indications, not strictly as routine
actions [8, 10]. Edelman et al also proposed that
‘‘eliminating unnecessary testing would decrease the
risk of further physical and psychological harm from
the inevitable occurrence of false-positive tests’’ [9]. The
subject of whether clinicians are optimally utilizing the
available imaging modalities has been seldom studied
[10]. This is particularly important in an environment of
limited resources, as there is usually a waiting list to
access certain imaging procedures such as CT and MRI
scans. Concerns were expressed by the imaging depart-
ment that the lymphoma group may be ordering an
excessive number of scans unnecessarily for routine
follow ups, hence making the resource less available for
staging or other urgent reasons in a timely fashion.
Therefore, in this study, the pattern of physician
utilization of imaging investigations in the management
of lymphoma was examined. The goal was to ascertain
the indications for each imaging examination, for
example: staging, evaluating response to treatment,
suspected or confirmed recurrence, and routineAddress correspondence to: Dr Richard W Tsang,
The British Journal of Radiology, 79 (2006), 116–122
116 The British Journal of Radiology, February 2006](https://image.slidesharecdn.com/026britishjournalofradiology-britishinstituteofradiology-2006-130913065550-phpapp02/75/British-Journal-of-Radiology-British-Institute-of-Radiology-2006-eng-121-2048.jpg)


![The types of imaging procedures are shown in Table 2.
Chest radiographs accounted for the majority (82%) The
follow-up chest radiographs constituted 116 assessments
of 295 performed over the 3-month period (39% of chest
radiograph assessments).
Utilization of CT scans
CT scans were performed on 248 patients. These
patients received 296 assessments and 513 procedures
(Table 3). 30% of these patients were ‘‘new’’ and 70%
were ‘‘old’’. Over the 3-month period, the majority of
patients (85%) received one CT assessment (Table 3), but
each assessment may involve 1–3 CT procedures
(Table 4).
The indications for CT scans included 40% for
response assessment, 13% for suspicion of recurrence,
11% for residual disease, 10% for investigation of new
symptoms, 8% for routine follow up, 6% for staging and
12% for other reasons (Figure 8). When comparing the
indications for CT between ‘‘new’’ and ‘‘old’’ patients,
the largest differences were 38% for response assess-
ment, and 17% for staging, and a difference of 17% for
suspicion of recurrence and 12% for routine follow up
(Figure 9). All the routine follow up CT assessments
(n525) were done for ‘‘old’’ patients, and accounted for
12.3% of the CT scan assessments done for ‘‘old’’
patients. Medical oncologists requested 92% (23/25)
and radiation oncologists requested 8% (2/25) of the
routine follow up CT scans. Of the follow-up CT scans,
72% (18/25) were in patients diagnosed in 2000–2003.
Discussion
At the time when this study was initiated, there were
two main concerns at the hospital regarding the
utilization of imaging resources by the lymphoma group.
A first concern for clinicians was that scans ordered as
staging investigations might overwhelm the imaging
resource, as it is known that all new patients must be
staged with imaging examinations [14], specifically CT
scans of head and neck, thorax, abdomen and pelvis [1].
The results showed that staging accounts for only 4% of
all the imaging assessments, and for an analysis
restricted to CT scans it was 6% of assessments. The
differences between the ‘‘new’’ patients and ‘‘old’’
patients showed an expected trend of ‘‘new’’ patients
receiving more assessments for staging and evaluation of
response. However, even for ‘‘new’’ patients the utiliza-
tion of imaging for staging is low, and since all patients
are staged with imaging, this implied that the majority
had initial imaging performed prior to referral. The audit
was conducted at a tertiary oncology hospital, with
Figure 4. Total number of
procedures per patient within the 3
month period.
Figure 5. Imaging procedures performed during the
3-month study on lymphoma patients. This graph shows the
percentage of procedures that each imaging examination
comprises.
Imaging utilization in lymphoma patients
The British Journal of Radiology, February 2006 119](https://image.slidesharecdn.com/026britishjournalofradiology-britishinstituteofradiology-2006-130913065550-phpapp02/75/British-Journal-of-Radiology-British-Institute-of-Radiology-2006-eng-124-2048.jpg)

![follow-up with no discernable clinical indication
accounted for 21% of the total assessments and 16% of
the total procedures. Follow-up represents a large
proportion of assessments when all imaging procedures
are grouped together, but chest radiographs account for
the majority of follow-up procedures (82%), and only
24% consisted of CT scan procedures. A chest radiograph
is less costly and more widely available compared with a
CT scan [8, 9, 11, 15, 16]. Indeed, for routine follow-up,
chest radiographs were more frequently ordered by
clinicians compared with CT scans in this study, but it is
less sensitive compared with a thorax CT scan. Studies
have found that CT scans are minimally effective for
follow-up in identifying relapses [1, 10, 17] as relapses
are most often detected by patients developing disease-
related symptoms [6–9, 11–13, 18]. Therefore, this implies
that the practice of ordering routine chest radiographs
has questionable clinical benefit, although one study did
suggest a role in following Hodgkin’s disease in the first
3 years after treatment [12]. Perhaps the common
practice of using chest radiographs as follow up is more
due to its wide availability, low cost, and minimal X-ray
exposure.
The majority of CT scans were performed for ‘‘old’’
patients. Most of these patients received one assessment
(85%), but for two-thirds of patients this assessment
constituted more then 1 CT procedure. The reason for
ordering CT scans (Figure 8) differed slightly from the
reason for ordering all of the imaging procedures when
considered together (Figure 6). CT scans were used more
to evaluate the response to treatment, rather than to
evaluate new problems or for routine follow up. Perhaps
this reflected a high degree of success in the initial
primary management of lymphomas. The data showed
that although follow-up accounted for 21% of all imaging
assessments, only 25 CT assessments were done for
routine follow-up within the 3-month period (i.e. 8% of
all CT assessments). Of these, 92% were ordered by
medical oncologists and 8% by radiation oncologists. The
reason for this discrepancy could be due to differences in
the patient factors seen by the two specialties (a higher
patient volume, with a higher risk of relapse in more
advanced stage patients seen by medical oncologists) or,
alternatively, patients seen by radiation oncology may be
more likely to have follow up imaging performed
elsewhere.
Many studies have suggested surveillance follow-up
routines based on effectiveness, both in terms of the
ability to detect relapse and cost [2, 5, 7–9, 11–13]. Not all
of the recommended standards are in agreement,
ranging from basic history, physical examination and
serum lactic dehydrogenase (LDH) tests for follow up
[8], which is similar to the practice at our hospital, to a
combination of physical examination, blood work, chest
radiograph and additional imaging tests such as CT and
gallium scans left to the discretion of the investigator
[11]. The United States National Comprehensive Cancer
Network 2004 practice guidelines for Hodgkin’s
disease, which are based on consensus rather than
published data, outline an even more intensive follow
up routine that entails chest imaging (CT scan or
radiograph), to be performed every 3–6 months during
the first 3 years post-treatment and annually from the
4th year after treatment [19]. Abdominopelvic imaging
was recommended every 6–12 months in the first 3 years
post treatment, and annually in years 4 and 5. For
patients treated with radiation therapy to the chest,
mammographic screening was suggested 8–10 years
Figure 8. Analysis of CT scans, rea-
sons for ordering assessments.
Figure 9. Comparing reasons for CT
scans between ‘‘new’’ and ‘‘old’’
patients.
Imaging utilization in lymphoma patients
The British Journal of Radiology, February 2006 121](https://image.slidesharecdn.com/026britishjournalofradiology-britishinstituteofradiology-2006-130913065550-phpapp02/75/British-Journal-of-Radiology-British-Institute-of-Radiology-2006-eng-126-2048.jpg)
![post-therapy. The follow up guidelines for NHL were
not detailed, except for follicular lymphoma where
follow up imaging was regarded as necessary but
ordered as clinically indicated, about every 6 months
[20]. An international workshop that established stan-
dardized response criteria in NHL stated that ‘‘imaging
studies may be added for relevant clinical indications,
but specific tests cannot be currently recommended’’, yet
acknowledges that the issue is still controversial and that
good clinical judgement is the most important compo-
nent of patient follow up [2]. In one study of Hodgkin’s
disease, among patients with recurrence of disease,
imaging-detected cases did not have a better overall
clinical outcome with salvage therapy compared
with patients whose recurrence were detected by
symptoms [12].
A limitation of this study is the retrospective nature of
the review, as it is possible that a clinician had ordered
an imaging procedure with a legitimate indication, but
did not document this in the medical record either before
or after the imaging procedure was performed. Such a
situation will be misclassified under the category of
‘‘routine follow up with no specific clinical indication’’.
Given this limitation, the 8% rate of utilization of CT
scans for this reason is probably acceptable within a
practice environment where there had been significant
variation in the follow up recommendations as cited
above. In addition, other institutions with different
referral pattern and case-mix will invariably find a very
different spectrum for the reasons behind imaging
utilization. However, it is the feasibility of the methodol-
ogy and the potential usefulness of the auditing
procedure in assessing and assigning resource utilization
in this study that should be emphasised. Increasingly,
stakeholders of the healthcare delivery system
such as government, health authorities and hospital
boards demand accurate utilization data to assign
resources, and the type of information requested is
often along the same vein as that provided in this
study.
In conclusion, in the lymphoma patients seen at a
tertiary oncology hospital, imaging assessments
requested for staging are under-represented. A substan-
tial proportion of patients having had imaging tests
completed elsewhere prior to referral explained this.
Imaging requested for routine follow up of asympto-
matic lymphoma patients is infrequent, apart from chest
radiographs. This study reflects the utilization patterns
of imaging within a disease group and would assist in
planning the assignment of imaging resources based on
case-mix. It also reassured the physicians and the
institution that the majority of CT scans were ordered
for valid indications. It is hoped that the study also
raised the awareness of clinicians in the importance of
continually adhering to proper indications for ordering
imaging tests.
References
1. Schiepers C, Filmont JE, Czernin J. PET for staging of
Hodgkin’s disease and non-Hodgkin’s lymphoma. Eur J
Nucl Med Mol Imaging 2003;30 Suppl. 1:S82–8.
2. Cheson BD, Horning SJ, Coiffier B, Shipp MA, Fisher RI,
Connors JM, et al. Report of an international workshop
to standardize response criteria for non-Hodgkin’s
lymphomas. NCI Sponsored International Working
Group. J Clin Oncol 1999;17:1244–53.
3. Naumann R, Vaic A, Beuthien-Baumann B, Bredow J,
Kropp J, Kittner T, et al. Prognostic value of positron
emission tomography in the evaluation of post-treatment
residual mass in patients with Hodgkin’s disease and non-
Hodgkin’s lymphoma. Br J Haematol 2001;115:793–800.
4. Even-Sapir E, Israel O. Gallium-67 scintigraphy: a corner-
stone in functional imaging of lymphoma. Eur J Nucl Med
Mol Imaging 2003;30 Suppl. 1:S65–81.
5. Weeks JC, Yeap BY, Canellos GP, Shipp MA. Value of
follow-up procedures in patients with large-cell lymphoma
who achieve a complete remission. J Clin Oncol
1991;9:1196–203.
6. Biasotti S, Garaventa A, Padovani P, Faraci M, Fioredda F,
Hanau G, et al. Role of active follow-up for early diagnosis
of relapse after elective end of therapies. Pediatr Blood
Cancer 2005;45:781–6.
7. Radford JA, Eardley A, Woodman C, Crowther D. Follow
up policy after treatment for Hodgkin’s disease: too many
clinic visits and routine tests? A review of hospital records.
BMJ 1997;314:343–6.
8. Elis A, Blickstein D, Klein O, Eliav-Ronen R, Manor Y,
Lishner M. Detection of relapse in non-Hodgkin’s lym-
phoma: role of routine follow-up studies. Am J Hematol
2002;69:41–4.
9. Edelman MJ, Meyers FJ, Siegel D. The utility of follow-up
testing after curative cancer therapy. A critical review and
economic analysis. J Gen Intern Med 1997;12:318–31.
10. Cohen MD, Siddiqui A, Weetman R, Provisor A, Coates T.
Hodgkin disease and non-Hodgkin lymphomas in children:
utilization of radiological modalities. Radiology
1986;158:499–505.
11. Dryver ET, Jernstrom H, Tompkins K, Buckstein R, Imrie
KR. Follow-up of patients with Hodgkin’s disease following
curative treatment: the routine CT scan is of little value. Br J
Cancer 2003;89:482–6.
12. Torrey MJ, Poen JC, Hoppe RT. Detection of relapse in
early-stage Hodgkin’s disease: role of routine follow-up
studies. J Clin Oncol 1997;15:1123–30.
13. Guppy AE, Tebbutt NC, Norman A, Cunningham D. The
role of surveillance CT scans in patients with diffuse large
B-cell non-Hodgkin’s lymphoma. Leuk Lymphoma
2003;44:123–5.
14. Vinnicombe SJ, Reznek RH. Computerised tomography in
the staging of Hodgkin’s disease and non-Hodgkin’s
lymphoma. Eur J Nucl Med Mol Imaging 2003;30 Suppl.
1:S42–55.
15. Valk PE, Pounds TR, Tesar RD, Hopkins DM, Haseman
MK. Cost-effectiveness of PET imaging in clinical oncology.
Nucl Med Biol 1996;23:737–43.
16. Joines JD, McNutt RA, Carey TS, Deyo RA, Rouhani R.
Finding cancer in primary care outpatients with low back
pain: a comparison of diagnostic strategies. J Gen Intern
Med 2001;16:14–23.
17. Rankin SC. Assessment of response to therapy using
conventional imaging. Eur J Nucl Med Mol Imaging
2003;30 Suppl. 1:S56–64.
18. Oh YK, Ha CS, Samuels BI, Cabanillas F, Hess MA, Cox JD.
Stages I-III follicular lymphoma: role of CT of the abdomen
and pelvis in follow-up studies. Radiology 1999;210:483–6.
19. NCCN. The NCCN Clinical Practice Guidelines in
Oncology. Hodgkin’s Disease. www.nccn.org: National
Comprehensive Cancer Network; 2004. Report No.:
V.1.2004.
20. NCCN. The NCCN Clinical Practice Guidelines in
Oncology. Non-Hodgkin’s Lymphoma. www.nccn.org:
National Comprehensive Cancer Network; 2005. Report
No.: v.1.2005.
A Schwartz, M K Gospodarowicz, K Khalili et al
122 The British Journal of Radiology, February 2006](https://image.slidesharecdn.com/026britishjournalofradiology-britishinstituteofradiology-2006-130913065550-phpapp02/75/British-Journal-of-Radiology-British-Institute-of-Radiology-2006-eng-127-2048.jpg)
![Image quality and breast dose of 24 screen–film combinations for
mammography
1
A D DIMAKOPOULOU, MSc, 2
I A TSALAFOUTAS, PhD, 1
E K GEORGIOU, MD, PhD and
1
E N YAKOUMAKIS, PhD
1
Medical Physics Department, Medical School, University of Athens, 75 Mikras Asias, 115 27, Athens
and 2
Medical Physics Unit, Konstantopoulio-Agia Olga Hospital, 3-5 Agias Olgas, Nea Ionia, 142 33,
Athens, Greece
ABSTRACT. In this study the effect of different mammographic screen–film
combinations on image quality and breast dose, and the correlation between the
various image quality parameters, breast dose and the sensitometric parameters of a
film were investigated. Three Agfa (MR5-II, HDR, HT), two Kodak (Min-R M, Min-R
2000), one Fuji (AD-M), one Konica (CM-H) and one Ferrania (HM plus) single emulsion
mammographic films were combined with three intensifying screens (Agfa HDS, Kodak
Min-R 2190 and Fuji AD-MA). The film characteristics were determined by sensitometry,
while the image quality and the dose to the breast of the resulting 24 screen–film
combinations were assessed using a mammography quality control phantom. For each
combination, three images of the phantom were acquired with optical density within
three different ranges. Two observers assessed the quality of the 72 phantom images
obtained, while the breast dose was calculated from the exposure data required for
each image. Large differences among screen–film combinations in terms of image
quality and breast dose were identified however, that, could not be correlated with the
film’s sensitometric characteristics. All films presented the best resolution when
combined with the HDS screen at the expense of speed, and the largest speed when
combined with the AD-MA screen, without degradation of the overall image quality.
However, an ideal screen–film combination presenting the best image quality with the
least dose was not identified. It is also worth mentioning that the best performance for
a film was not necessarily obtained when this was combined with the screen provided
by the same manufacturer. The results of this study clearly demonstrate that
comparison of films based on their sensitometric characteristics are of limited value for
clinical practice, as their performance is strongly affected by the screens with which
they are combined.
Received 26 February 2005
Revised 23 May 2005
Accepted 7 June 2005
DOI: 10.1259/bjr/84646476
’ 2006 The British Institute of
Radiology
The main concern in mammography screening is the
detection of features characteristic of breast disease.
These features often have sizes of the order of 1 mm and
differ from the normal tissue only slightly in composi-
tion, thus setting high requirements for the resolution
and contrast that an imaging system must offer in order
to be appropriate for mammography [1]. On the other
hand, given the high radiosensitivity of the breast and
the large number of women examined many times
during their life, it is evident that the doses during
mammography should be kept as low as possible.
While digital mammography may look promising, the
vast majority of mammography examinations are still
carried out with screen–film systems. In recent years,
most film manufacturers have presented new films and
intensifying screens for mammography that reduce the
dose to the breast and produce the image quality
required to maintain the diagnostic sensitivity and
specificity of mammography at high levels. However,
while the design is the major factor in determining the
performance of a film, this may be affected by the
processing conditions, such as the chemicals used, their
temperature and the processing time [2]. Inappropriate
chemicals or a developing temperature lower than
recommended may result in unacceptable mammograms
and this is why some films have been modified to be less
dependent on processing conditions [3, 4].
Film characteristics can be determined and monitored
for changes due to processing by sensitometry. However,
film performance will be dependent on the screen with
which it is combined and thus for clinical practice the
characteristics of the screen–film combination rather than
those of film or screen separately are of interest [5]. The
screen–film characteristics can be determined and
monitored using an appropriate quality control (QC)
phantom, with which changes in image quality due to
processing or other reasons can be identified.
One of the parameters routinely monitored with the
QC phantom is the background or reference optical
density (OD) of the mammographic images. Apart from
the personal preferences of radiologists, it has been
shown that for a given screen–film combination, subtle
details and small contrast differences are best accentu-
ated when the film OD is within a certain range [6–8]. For
The British Journal of Radiology, 79 (2006), 123–129
The British Journal of Radiology, February 2006 123](https://image.slidesharecdn.com/026britishjournalofradiology-britishinstituteofradiology-2006-130913065550-phpapp02/75/British-Journal-of-Radiology-British-Institute-of-Radiology-2006-eng-128-2048.jpg)
![this reason it has been recommended that each institu-
tion should determine the optimum OD for the screen–
film used and the processing conditions specific to it [7].
In this study, eight films were combined with three
intensifying screens and the resulting 24 screen–film
combinations were compared in terms of image quality
and breast dose. Film characteristics were determined by
sensitometry, whereas the image quality and speed of
the screen–film combinations were assessed using a QC
phantom to obtain images within three different OD
ranges. Our main objective was to investigate the effect
of different screens on a certain film and search for any
correlation between the image quality, breast dose and
the sensitometric parameters of a film.
Materials and methods
The eight single emulsion mammographic films tested
in this study were the MR5-II, HDR, HT (Agfa-Gevaert
N.V., Mortsel, Belgium), Min-R M, Min-R 2000 (Eastman
Kodak Company, New York, NY), AD-M (Fuji Photo Film
Co. Ltd, Tokyo, Japan), CM-H (Konica Corporation,
Tokyo, Japan) and HM plus (Ferrania Sp A, Ferrania
(SV), Italy). One box from each film type was used to
avoid little differences that may exist among different film
batches or films that may have been stored for different
times and under different storage conditions [9]. The three
intensifying screens used in this study were the HDS
(Agfa), the Min-R 2190 (Kodak) and the AD-MA (Fuji).
For each film a 21-step sensitometric strip was
produced, using an X-Rite 334 sensitometer (X-Rite,
Grandville, MI) operated in the green spectrum. All films
were processed in a daylight processor (Curix Capacity,
Agfa) with nominal processing time 90 s (22 s developing
time) and with the developer temperature set to 36˚C. The
developer type was the Eos Dev (Agfa) and the fixer type
was the G334i (Agfa). All films were processed sequen-
tially, immediately after exposure and on the same day, to
avoid day-to-day variations in processing conditions
caused by the ageing of the chemicals that may have
variable effects on the characteristics of each film [9, 10].
The OD of the 21 steps of the sensitometric strips was
measured using a calibrated optical densitometer (RMI
331, X-Rite). For each film the Hurter-Driffield (HD)
curve was plotted and the following sensitometric
parameters were derived: OD of base plus fog (ODb+f),
maximum OD (ODmax), average gradient (AG), film
gamma (c) and film speed. The AG and c are the slopes
of the HD curve for ODs from 0.25+ODb+f to 2.0+ODb+f
and from 1.0+ODb+f to 2.0+ODb+f, respectively. AG and c
are both used as indices of film contrast, however, only c
can be used to reproduce the linear part of the HD
curve. The film speed was defined as the reciprocal of
the relative light exposure required to obtain an OD of
1+ODb+f. Using this definition, the higher the film speed
the less exposure is needed for a given OD. In order to
illustrate the expected increase in breast dose – according
to sensitometry – when a film other than the fastest one is
used, the sensitometric relative dose index (SRDI) was
defined as the reciprocal of the relative speed value. The
SDRIs were expressed as percentages of the smallest
SRDI value (highest speed) that was taken as 100%. It
must be noted that from preliminary sensitometric tests
it has been confirmed that for different sheets of the same
film type processed within the same day, variations of
less than ¡0.01 in ODb+f, ¡10% in speed and ¡0.1 in
ODmax, AG and c should be expected.
To evaluate the characteristics of screen–film combina-
tions, a mammography QC phantom was employed
(breast phantom, Model 18-222; Nuclear Associates,
Division of Victoreen Inc., NY). This phantom is
realistically shaped and equivalent to an average firm
breast of 4.5 cm compressed thickness, consisting of 50%
adipose and 50% glandular tissue. It includes 12 groups
of calcium carbonate specks (simulating microcalcifica-
tions), 7 hemispheric masses composed of 75% glandular
and 25% adipose equivalent tissue (simulating tumours)
and a wax insert with 5 embedded nylon fibres
(simulating glandular tissue fibrils). The phantom also
contains a five-step stepwedge, simulating breast areas
with compositions 100% adipose, 70% adipose–30%
glandular, 50% adipose–50% glandular, 30% adipose–
70% glandular and 100% glandular tissue. Finally, two
line-pair test targets (5–20 lp mm21
each), one parallel
and one perpendicular to the anode–cathode axis and a
central area where the background OD is measured, are
included. A similar phantom (without the nylon fibres
and with only one line-pair test target) was used by
Nassivera and Nardin [11].
The phantom was exposed using a Senographe 500T
mammography unit (CGR, Buc, France). All exposures
were made with the Mo/Mo target filter combination,
constant tube potential (28 kVp), large focal spot (0.3 mm
nominal size) and without the breast compression paddle.
Using manual mAs selection technique, images of the
phantom were acquired until for each screen–film
combination three films with OD as close as possible to
the central OD of three different optical density ranges
(0.70–1.10, 1.11–1.50, 1.51–2.00) were produced to account
for the wide range of ODs that can be encountered within
actual mammographs. Phantom images were processed
in the same processor and on the same day as the
sensitometric strips, so both film characteristics and
screen–film performance were determined under the
same processing conditions. It must be noted that as the
Kodak and Fuji cassettes were not compatible with
the Agfa daylight processor, the films exposed with these
cassettes had to be transferred manually to the Agfa
cassette in order to be fed into the processor.
For each one of the resulting 72 phantom images, the
OD of the central area was measured with the densi-
tometer, as well as the OD of the areas simulating 100%
adipose and 100% glandular tissue. The OD difference of
these two areas can be used as an index of screen–film
contrast (CI) and, according to the phantom manufac-
turer, it should be ¢0.28.
All phantom images were examined using a viewing
box especially designed for mammography, featuring
adjustable brightness, masking shutters and a magnify-
ing glass. The shutters were closed down to the phantom
image size and the brightness was adjusted as necessary
to obtain the best possible conditions for viewing each
type of simulated lesion, while for speck groups the
magnifying glass was also used. A magnifying glass
supplied with the QC phantom was used to inspect the
line pair object. The above details are mentioned, as
A D Dimakopoulou, I A Tsalafoutas, E K Georgiou and E N Yakoumakis
124 The British Journal of Radiology, February 2006](https://image.slidesharecdn.com/026britishjournalofradiology-britishinstituteofradiology-2006-130913065550-phpapp02/75/British-Journal-of-Radiology-British-Institute-of-Radiology-2006-eng-129-2048.jpg)
![viewing conditions are very important for interpreting
mammograms or scoring phantom images [12].
Two observers scored the images independently and
any disagreements were resolved by consensus. Five
scores were recorded for each film: one for the speck-
groups, one for masses, one for fibres and two for the
two line-pair test targets. For ambiguous decisions
concerning not clearly visualized structures, a 0.5 mark
was assigned. In order to have a single index character-
izing the screen–film performance, a total score (TS) was
calculated using the following weighting coefficients: 0.4
for specks, 0.35 for masses and 0.25 for fibres. These
coefficients were selected after consulting with five
radiologists about the clinical importance of each
simulated structure for diagnosis. Since the two scores
for the line-pair test targets have no straightforward
clinical relevance, their mean value was calculated for
reference only (resolution score).
For screen–film combination comparisons in terms of
breast dose, the entrance surface air-kerma (ESAK) at the
phantom surface was calculated from the mAs selected
for each exposure. For the range of mAs selections
utilized in this study, the output at 28 kVp defined at the
phantom entrance surface was 98¡2 mGy mAs21
.
Furthermore, the ESAK required to achieve a net OD of
1 was calculated by interpolation from the ODs and the
ESAKs of the three films acquired for each combination.
The resulting ESAKs for a net OD51 were used to derive
the relative dose index (RDI), expressed as a percentage
of the smallest observed value, that was considered as
100%. Using this definition, the larger the RDI, the larger
the dose to the breast and the smaller the speed of a
given screen–film combination.
To investigate the correlation between the various
image quality parameters, sensitometric parameters, OD
and dose indices linear regression analysis was used. A
correlation coefficient (r) larger than 0.7 was taken as an
indication of good correlation. Specifically, the correla-
tions of all the image quality scores (TS, specks, masses,
fibres and resolution) with AG, c, SRDI, CI, OD and
ESAK were investigated. Furthermore, the correlation of
TS with resolution, the correlations of CI with AG, c,
SDRI, OD and ESAK and the correlations of SDRI with
RDI and ESAK were also investigated.
Results
The HD curves for all the films studied are plotted in
Figure 1, while their sensitometric parameters are given in
Table 1. In Figure 1, the large differences among the HD
curve shapes, the high speed of Min-R 2000, the low speed
of AD-M and the non-typical but similar HD curve
shapes of HDR and HM plus should be noted. From
Table 1, it can be seen that the Min-R 2000 presents the
highest speed and c, while the CM-H has the highest AG.
Concerning the screen–film comparisons, for the 72
phantom images evaluated in this study, speck scores
ranged from 6 to 11, mass scores from 2.5 to 6, fibre scores
from 2 to 4, total scores from 4.3 to 7.3, resolution
scores from 10 to 14.5 lp mm21
and CI from 0.26 to 0.61.
For eachofthethree ODranges the respectiveESAK ranges
were: 2.0–4.9 mGy, 2.4–6.2 mGy and 3.1–8.8 mGy. The
results for the 24 combinations studied in terms of the
ESAK at the phantom surface, the background OD, the TS,
the CI and the resolution score are presented in Tables 2a,
2b and 2c for the three different OD ranges, respectively. In
the two last columns of each table, the screen–film RDI and
the mean value of TS in the three OD ranges (TSm) are also
given. From these tables it can be seen that the screen
affected the image quality of a given film as well as the dose
Figure 1. The Hurter-Driffield (HD) curves of the eight
films included in this study are given. The optical densities
(ODs) of the 21 steps of the sensitometric strips correspond
to log relative exposure values (LogE) that range from 0 to 3,
in steps of 0.15 each. In these figures, only the ODs for
LogE¢ge;0.9 (steps 7 to 21) are presented in order to
enhance the visibility of the differences in the linear part and
the shoulder of the HD curves.
Table 1. The results of the sensitometric evaluation of the eight mammographic films included in this study. The lowest speed
was arbitrarily defined as 100%. The sensitometric relative dose index (SRDI) was defined as the reciprocal of the relative speed,
considering the lowest value (highest speed) as 100%
Film Parameter MR5-II
(Agfa)
HT
(Agfa)
HDR
(Agfa)
Min-R
M (Kodak)
Min-R
2000 (Kodak)
CM-H
(Konica)
AD-M
(Fuji)
HM plus (Ferrania)
ODb+f 0.20 0.23 0.21 0.17 0.20 0.20 0.17 0.22
ODmax 3.50 3.84 3.98 3.88 4.03 3.80 3.58 4.13
AG 2.46 3.12 3.09 3.13 2.80 3.64 3.50 2.93
c 2.80 4.36 3.98 4.13 4.46 4.23 4.24 3.68
Rel. Speed (%) 115 121 143 133 167 126 100 143
SRDI (%) 145 138 117 125 100 132 167 117
Agfa-Gevaert N.V., Mortsel, Belgium; Eastman Kodak Company, New York, NY; Fuji Photo Film Co. Ltd, Tokyo, Japan; Konica
Corporation, Tokyo, Japan; Ferrania USA Inc., USA.
OD, optical density; AG, average gradient; c, film gamma.
Image quality and breast dose of screen–film mammography
The British Journal of Radiology, February 2006 125](https://image.slidesharecdn.com/026britishjournalofradiology-britishinstituteofradiology-2006-130913065550-phpapp02/75/British-Journal-of-Radiology-British-Institute-of-Radiology-2006-eng-130-2048.jpg)


![TS, CI, resolution and the lowest RDI were observed for
different combinations and thus an ‘‘ideal’’ combination
was not identified. Second, the best performance of a
given film or screen was not always obtained when
combined with the screen or film, respectively, from the
same manufacturer.
Finally, concerning the correlation between image
quality parameters, sensitometric parameters and dose,
no correlation coefficient larger than 0.7 was calculated
in any of the correlations tested. The largest correlation
coefficient calculated was that between CI and OD,
which was 0.66 but increased to 0.87 when the MR5-II
combinations were excluded, demonstrating that for
modern high contrast films the screen–film contrast
increases with OD. It must be clarified, however, that this
correlation has been assessed for ODs up to 2.0 and it is
expected that for higher ODs the CI will start to decrease
again as the films become saturated.
The poor correlations of image quality parameters (TS,
specks, masses, fibres, resolution and CI) with film contrast
(c, AG) and the poor correlation of RDI with SRDI,
confirmed that film performance is strongly affected by
the screen. Concerning the lack of correlation of TS with CI,
resolution and dose, the following remarks should be
made. While combinations with high TS generally had high
CI, there were many cases with high CI and low TS. There
were also many combinations with high TS that, however,
exhibited low resolution score and vice versa. Finally, slow
combinations did not always give high TS, as expected
according to the general principle that the higher the dose
the lower the quantum mottle.
Discussion
The major conclusion of this study was that film
characteristics are modified by intensifying screens in
such a significant and variable way, that comparisons
among films based on the manufacturer’s specifications
or sensitometry are of limited value. Indeed, a film with
given technical specifications or sensitometric characteri-
stics, when combined with different screens may exhibit
improved or degraded performance.
Instructive of the variable effect that a screen may have
on a film, it can be seen that while Min-R 2000 was the
fastest film and remained the fastest when combined
with the Fuji screen, the RDI ratio of CM-H and Min-R
2000 combinations with Fuji screen was 1.04 while for
film only the respective ratio of SDRI was 1.32. That
means that the Fuji screen spectral emission better
matched the spectral sensitivity of CM-H compared
with Min-R 2000. The slowest film, according to
sensitometry, was the AD-M, which remained the slow-
est when combined with all screens. The SDRI for AD-M
was 167 while its smallest RDI was 191 and it was
observed when combined with the Fuji screen.
Examples of the largest variations observed in score
and dose when a film was combined with different
screens are: the HM plus where the TS was 36% larger
with the Fuji than with the Agfa screen (Table 2c), the
Min-R 2000 where the CI was 46% and 22% larger with
the Agfa than with the Kodak screen (Tables 2a and 2c,
respectively), the Min-R 2000 where the resolution was
26% larger with the Agfa than with the Fuji screen (Table
2b) and the HT (Agfa) where 63% more dose is required
with the Agfa screen than with the Fuji screen.
As previously mentioned, from Tables 2–4 some
conclusions may be drawn concerning the superiority
of certain combinations over others in terms of image
quality or speed. However, the absolute values of scores
and other screen–film characteristics may be quite
different on other mammographic facilities, given the
strong dependence of film characteristics on processing
conditions [13, 14]. This must be emphasised, as the
objective of this study was not to recommend or
condemn certain films or screens but to investigate the
effect of screens on the performance of films. Although
most screen–film comparisons in the literature have been
carried out using the same processing conditions for all
films, it must be noted that the general notion is that a
film would perform optimally when it is processed
according to the recommendations of the manufacturer.
Even so, this does not annul the fact that the breast dose
and image quality for a film optimally processed will
again vary, depending on the screen with which it is
combined, and that some films will be affected by the
screen more than others.
Table 4. The best film for a given screen in terms of total score (TS), index of screen–film contrast (CI), line pairs per millimetre
(lp mm21
) and relative dose index (RDI). Letters in parentheses give reference to Tables 2a, 2b or 2c where each value can be
found. The largest values overall for each parameter are given in bold
MR5-II HT HDR MIN-R M MIN-R 2000 CM-H AD-M HM plus
(Agfa) (Agfa) (Agfa) (Kodak) (Kodak) (Konica) (Fuji) (Ferrania)
TS HDS (Agfa) – 6.2 (b) – – – – – –
Min-R2190 (Kodak) – – – – – – 6.7 (c) –
AD-MA (Fuji) – – – – – – 7.3 (c) –
CI HDS (Agfa) – – – – 0.61 (c) – – –
Min-R2190 (Kodak) – – 0.56 (c) – – – – –
AD–MA (Fuji) – – – – 0.57 (c) – – –
lp mm21
HDS (Agfa) – – – – 14.5 (b,c) – – 14.5 (b)
Min–R2190 (Kodak) – – – – 13.5 (b) 13.5 (b) 13.5 (b) 13.5 (b)
AD–MA (Fuji) – – – – – – 14 (b) –
RDI HDS (Agfa) – – – – – 153 – –
Min–R2190 (Kodak) – – – – – 140 – –
AD–MA (Fuji) – – – – 100 – – –
Agfa-Gevaert N.V., Mortsel, Belgium; Eastman Kodak Company, New York, NY; Fuji Photo Film Co. Ltd, Tokyo, Japan; Konica
Corporation, Tokyo, Japan; Ferrania USA Inc., USA.
A D Dimakopoulou, I A Tsalafoutas, E K Georgiou and E N Yakoumakis
128 The British Journal of Radiology, February 2006](https://image.slidesharecdn.com/026britishjournalofradiology-britishinstituteofradiology-2006-130913065550-phpapp02/75/British-Journal-of-Radiology-British-Institute-of-Radiology-2006-eng-133-2048.jpg)
![Even if it were assumed that the processing conditions
were optimal for all films, it would again be difficult to
select the best screen–film combination from those
studied, as there are no established criteria about what
increase in breast dose is justified by a superior image
quality. For example the AD-MA/AD-M presented a TS
of 7.3 (11 specks, 6 masses, 3 fibres) and an ESAK of
6.2 mGy while the AD-MA/Min-R 2000 a TS of 6.4 (9
specks, 5 masses, 4 fibres) with an ESAK of 2.4 mGy. To
conclude which is the best combination, one has to
decide if the 14% increase in TS could justify the 158%
increase in breast dose. The same question still holds
when considering that certain combinations (as the AD-
MA/AD-M) exhibited slightly larger TS for larger ODs
but with disproportional increase in breast dose.
An important remark should also be made concerning
the OD of the films studied. It is obvious that the films
included in Table 2a are of too low OD and few of the
films included in Table 2c are of too high OD, compared
with the target OD range of 1.3 to 1.8 proposed for
mammography [1]. Nonetheless, certain combinations
exhibited better scores in Table 2a than in Tables 2b and
2c, while most of the films of Table 2c with ODs larger
than 1.8 exhibited scores similar to those of Table 2b. In
clinical practice, however, given that the wide OD
variations within a mammogram are not uncommon,
some areas may present similar ODs with those of Table
2a or larger than 1.8 and therefore the performance of a
screen–film combination within all OD ranges is of
interest. In this context, comparisons based on the TSm
may be considered more relevant to the clinical situation
than comparisons based on the TS within only one OD
range. The variability of TS with OD should always be
considered when selecting the central OD setting of the
automatic exposure control (AEC) system based on the
results of phantom scores.
Some final comments should be made concerning the
method used to assess the image quality of screen–film
combinations. Phantom scoring does not always represent
clinical practice, as in actual mammograms the perfor-
mance of a given combination will be also dependent on
the breast type [15]. Furthermore, phantom scoring may
be somewhat biased, as it relies on the detection of
structures known to be present at specific positions [16].
Nevertheless, phantoms are considered as the best way
for the objective evaluation of image quality and various
models with fixed or randomly positioned details are
extensively used. Caldwell et al [17] agreed on the
usefulness of such phantoms for the objective evaluation
of image quality and also reported that a subjective
assessment of image quality is better accomplished with
an anthropomorphic breast phantom than with actual
mammograms, where the variability among radiologists
was higher. However, they noted that no significant
correlation was found between the various methods used
to evaluate image quality and concluded that more work
is required to obtain an index of true image quality
correlated with the probability of correct diagnosis.
In conclusion, image quality and dose in mammogra-
phy are more strongly dependent on screen–film
combination than on film or screen separately. While
sensitometry remains an important tool for determining
and monitoring the film characteristics [18], it is of little
value when the image quality and breast dose in clinical
mammograms are of concern. Therefore, any change of
film or screen type in a mammographic facility should be
carefully investigated with a phantom, for determining
the performance of the selected screen–film combination
and for adjusting the AEC system to the optimum OD
range for this combination.
References
1. van Woudenberg S, Thijssen M, Young K. European
protocol for the quality control of the physical and technical
aspects of mammography screening. In: Perry N, Broeders
M, de Wolf C, Kirkpatrick A, Tornberg S, editors. European
guidelines for quality assurance in mammography screen-
ing (3rd edn). Luxembourg: Office for Official Publications
of the European Communities, 2001.
2. Brink C, De Villiers JFK, Lo¨tter MG, Van Zyl M. The
influence of film processing temperature and time on
mammography image quality. Br J Radiol 1993;66:685–90.
3. Tabar L and Haus AG. Processing of mammographic films:
technicalandclinicalconsiderations.Radiology1989;173:65–9.
4. Kimme-Smith C, Bassett LW, Gold RH, Zheutlin J,
Gornbein JA. New mammography screen/film combina-
tions: imaging characteristics and radiation dose. AJR Am J
Roentgenol 1990;154:713–9.
5. Kirkpatrick AE, Law J. A comparative study of films and
screens for mammography. Br J Radiol 1987;60:73–8.
6. Robson KJ, Kotre CJ, Faulkner K. The use of a contrast-
detail test object in the optimization of optical density in
mammography. Br J Radiol 1995;68:277–82.
7. McParland BG, Boyd MM, Yousef KAL. Optimizing optical
density of a Kodak mammography film-screen combination
with standard-cycle processing. Br J Radiol 1998;71:950–3.
8. McParland BJ. A comparison of two mammography film-
screen combinations designed for standard-cycle proces-
sing. Br J Radiol 1999;72:73–5.
9. Kimme-Smith C, Bassett LW, Gold RH, Chow S. Increased
radiation dose at mammography due to prolonged expo-
sure, delayed processing and increased film darkening.
Radiology 1991;178:387–91.
10. Fernandez JM, Guibelalde E. Technical note: Physical
evaluation of recent Kodak films for mammography. Br J
Radiol 1993;66:828–32.
11. Nassivera E, Nardin L. Daily quality control programme in
mammography. Br J Radiol 1996;69:148–52.
12. Pisano ED, Britt GG, Lin Y, Schell MJ, Burns CB, Brown ME.
Factors affecting phantom scores at annual mammography
facility inspections by the U.S. Food and Drug
Administration. Acad Radiology 2001;8:864–70.
13. Tsalafoutas IA, Dimakopoulou AD, Koulentianos ED,
Serefoglou AN, Yakoumakis EN. The variation of the
sensitometric characteristics of seven mammographic films
with processing conditions. Br J Radiol 2004;77:666–71.
14. Kimme-SmithC,RotschildPA, Bassett LW, GoldRH,Moler C.
Mammographic Film-Processor Temperature, Development
Time and Chemistry. AJR Am J Roentgenol 1989;152:35–40.
15. Meeson S, Young KC, Rust A, Wallis MG, Cooke J,
Ramsdale ML. Implications of using high contrast mammo-
graphy X-ray film-screen combinations. Br J Radiol
2001;74:825–35.
16. Jackson VP, Harrill CD, White SJ, Gillespie KR, Mail JT, Katz
BP. Evaluation of a dual-screen, dual-emulsion mammogra-
phy system. AJR Am J Roentgenol 1989;152:483–6.
17. Caldwell CB, Fishell EK, Jong RA, Weiser WJ, Yaffe MJ.
Evaluation of mammographic image quality: pilot study
comparing five methods. AJR Am J Roentgenol
1992;159:295–301.
18. West MS and Spelic DC. Using light sensitometry to
evaluate mammography film performance. Med Phys
2000;27:854–60.
Image quality and breast dose of screen–film mammography
The British Journal of Radiology, February 2006 129](https://image.slidesharecdn.com/026britishjournalofradiology-britishinstituteofradiology-2006-130913065550-phpapp02/75/British-Journal-of-Radiology-British-Institute-of-Radiology-2006-eng-134-2048.jpg)
![The effect of phantom type, beam quality, field size and field
position on X-ray scattering simulated using Monte Carlo
techniques
G McVEY, DPhil
Joint Department of Physics, The Royal Marsden NHS Trust, Fulham Road, London SW3 6JJ, UK
ABSTRACT. Determining the amount of scatter inside and outside a diagnostic X-ray
room is important for evaluating the dose to staff and the public. The amount of
scatter is affected by many physical factors including beam quality and field size.
However, there is little published data on patient scatter and there are large
differences between the available data sets. Hence, a Monte Carlo code was developed
to allow a systematic study of the factors affecting patient scatter. A voxel phantom
was used to provide a realistic model of the patient. The variation of scatter with
different phantom types was investigated to show the effect of patient
inhomogeneities and obliquities. The effect of altering tube voltage, filtration, voltage
ripple, field size and position on patient scatter was studied. A larger than expected
variation in the patient scatter was observed with increasing field area due to the
proximity of the field borders with the patient obliquities. The effect of the tube
voltage ripple on the patient scatter was also calculated. This showed that there would
be little effect on the scatter levels within X-ray rooms if ageing X-ray generators,
which produce substantial voltage ripple, were replaced by X-ray tubes with modern
medium frequency generators. Recommendations are made on the choice of published
scatter data for X-ray room design.
Received 25 October 2004
Revised 7 June 2005
Accepted 15 June 2005
DOI: 10.1259/bjr/59998010
’ 2006 The British Institute of
Radiology
Scatter is produced by all materials in a diagnostic X-
ray room, with the main source of scattered radiation
being the interaction of X-rays with the patient [1].
However, there is a limited amount of scatter data
available for use in X-ray room design. The data were
obtained from measurements undertaken with tissue
equivalent slab phantoms [2]; with human-shaped
homogeneous phantoms [3] and with heterogeneous
phantoms such as the RANDO phantom [4–6]. Since
these studies used a variety of phantom types and
technique parameters, there was a large variation in the
scatter values reported. An alternative solution is to use
Monte Carlo computer simulations of the scatter pro-
duced by a model of human anatomy. This has enabled
three systematic studies of the effect of different
parameters on scatter from patients undergoing
chest posteroanterior (PA), lumbar spine anteroposterior
(AP) and lumbar spine lateral (LAT) radiographic
examinations.
For the first study, four voxel phantoms (P1 to P4)
have been used to simulate the patient as shown in
Figure 1. These different approaches have been followed
to investigate the effect of patient obliquities and
inhomogeneities on scatter. The first approach was to
use a voxel phantom (P1) reconstructed from CT data. It
was developed by Zubal et al [7, 8] and was recently
used in a Monte Carlo model to optimize image quality
and patient dose in chest and lumbar spine radiography
[9, 10]. Dance et al [11] showed that Zubal’s voxel
phantom was representative of a patient undergoing
chest and lumbar spine radiographic examinations. The
second approach was to use the voxel phantom devel-
oped by Zubal and change all the voxels inside the
patient contour to be soft tissue and those outside to be
air (P2). The third approach was to use the voxel
phantom with all the voxels within the phantom to be
soft tissue (P3). The fourth voxel phantom was devel-
oped as a block of soft tissue specified by the average
dimensions of Zubal’s voxel phantom (P4).
The second study used the Monte Carlo code to
calculate the effect of varying the imaging parameters on
the scatter from the patient model (P1): the tube voltage
(60–150 kV), tube filtration (2.5–7.0 mmAl) and voltage
ripple (0–50%). By studying the effect of voltage ripple
on patient scatter, it can be observed whether replacing
an old X-ray generator, which has substantial voltage
ripple, with a modern X-ray generator, which has
negligible voltage ripple, will make a significant differ-
ence to the scatter levels inside and outside X-ray rooms.
The third study used the Monte Carlo code to calculate
the effect on the scatter from the patient model (P1)
of varying the field area (25–1225 cm2
) and the position
of the field on the patient. This study generalized the
results for the chest and lumbar spine regions so that the
data may be interpreted for other X-ray examinations.
The calculated scatter values obtained in this work may
be used to aid the design of X-ray rooms, but they may
also assist in the analysis of the doses received by staff
Current address: North Wales Medical Physics, Glan Clwyd
Hospital, Bodelwyddan, Denbighshire LL18 5UJ, UK.
This work was supported by a grant from Anglia and Oxford
Health Authority.
The British Journal of Radiology, 79 (2006), 130–141
130 The British Journal of Radiology, February 2006](https://image.slidesharecdn.com/026britishjournalofradiology-britishinstituteofradiology-2006-130913065550-phpapp02/75/British-Journal-of-Radiology-British-Institute-of-Radiology-2006-eng-135-2048.jpg)
![who undertake and assist with interventional radiolo-
gical examinations.
Methods and materials
Voxel Monte Carlo code
The Monte Carlo code is similar to that used
previously to study image quality and patient dose in
radiographic examinations [9, 10], but was extended to
simulate the scatter surrounding a voxel phantom. The
program transports the photons through the voxel
phantom; a collision density estimator [12] is used to
provide an efficient method of calculating scatter. The
model calculates the air kerma at points 1 m from the
phantom surface for scattering angles between 30˚ and
150˚. Scatter ratios were determined by the air kerma at
each of these points divided by the incident air kerma
without backscatter. The scatter ratios are expressed as
percentages. A large number of photon histories were
used to calculate this parameter so its uncertainty was
less than ¡1% (1 standard deviation).
The patient model was a voxel phantom (P1) derived
from segmented CT data [7, 8]. Each voxel belonged to 1
of 55 organs [10]. The tissue type of each organ was
specified as one of average soft tissue, healthy lung, bone
or bone spongiosa. The calculations used tissue densities
and compositions taken from the International
Commission on Radiation Units and Measurements
(ICRU) Report No. 46 [13], except for bone which was
taken from Kramer [14]. The patient support device, i.e.
the chest stand for the chest examination or couch top for
the lumbar spine examinations, was included in the
voxel phantom by the addition of an extra layer of
voxels. Table 1 shows the thickness and composition of
the chest stand and couch top. The dimensions of the
voxel phantom were 89.9 cm long, 35.6 cm wide and
21.4 cm thick. As the lower limbs were not present in the
phantom, its length was determined to be equivalent to
the height of the average European male in sitting
position. The shoulder width and chest thickness were
determined after an initial study [11, 15] which com-
pared calculations with measurements of patient
entrance air kerma.
Figure 1 shows the computer model of a patient
undergoing a radiographic examination for which the
scatter was calculated. The model included the X-ray
spectrum from the X-ray tube, the patient and the couch
top or chest stand. The X-ray spectra were calculated
using a Birch and Marshall [16] model. The grid and the
screen–film imaging system were not included in the
model. This means that the Monte Carlo model will
produce significantly greater forward scatter than would
Figure 1. The simulation model
used to calculate the scatter from a
patient undergoing, for example, a
chest posteroanterior X-ray
examination. The position of the
detector is shown at a scattering
angle of 135˚. The three other
phantoms used in the calculations
are also shown below.
Simulating scatter from patients
The British Journal of Radiology, February 2006 131](https://image.slidesharecdn.com/026britishjournalofradiology-britishinstituteofradiology-2006-130913065550-phpapp02/75/British-Journal-of-Radiology-British-Institute-of-Radiology-2006-eng-136-2048.jpg)
![be observed clinically if a grid and film cassette were
present (or grid and image intensifier for fluoroscopic
imaging systems). The scatter from the grid and film
cassette would have been negligible as the patient
significantly attenuates the X-ray beam. Therefore, the
forward directed patient scatter calculated by the Monte
Carlo model is a conservative estimate of the clinical
situation.
Table 1 shows the imaging system parameters. These
parameters was found to provide good image quality in
a recent EU clinical trial [17, 18] and were thus used as a
reference system to observe the differences in patient
scatter when the imaging system parameters were
varied.
In the first study, the effect of the patient heterogene-
ities and obliquities on scatter were investigated.
Therefore, in addition to the patient model (P1)
described above, the other three phantoms shown in
Figure 1 were used to simulate scatter from a patient
undergoing chest PA, lumbar spine AP and lumbar spine
lateral examinations. Phantom P2 was defined with the
voxels inside the patient’s surface set to average soft
tissue and those outside the surface set to air. Phantom
P3 was a slab phantom defined with all voxels, apart
from the chest stand or couch top, set to be average soft
tissue. Phantom P4 was also a slab phantom defined by
the average thickness (z direction) and width (y direc-
tion) of the patient model within the field borders for
each projection. Table 2 shows the dimensions of the P4
phantoms including the chest stand or couch top. This
was undertaken as the shoulder width was considerably
larger than the width further down the phantom’s body
outline. Hence, it was interesting to determine which
slab phantom (P3 or P4) scatter approximated the scatter
from the patient model most closely. The patient model
(P1) was used for the other two studies described in the
introduction.
Validation of the patient model
Sandborg et al [9] and McVey et al [10] describe the use
of the voxel Monte Carlo code to simulate image quality
and patient dose. As part of this work, Dance et al [11]
and Sandborg et al [15] compared measurements of
optical density behind phantoms and patient entrance air
kerma with calculations using the Monte Carlo code for
both of these situations. The good agreement obtained
from the comparisons showed that the voxel phantom
(P1) was representative of a patient undergoing chest
and lumbar spine X-ray examinations [11, 15].
Simulation of Williams’ scattering experiment
This section describes the method used to compare the
scatter calculated using the voxel Monte Carlo code with
the scatter measured by Williams [5]. This was carried
out to validate the calculations against recent indepen-
dently published values and also to check the reliability
of Williams’ measured values.
Williams measured the scatter from the abdominal
and pelvic sections of a RANDO phantom. Therefore, a
voxelized cylinder of Alderson Muscle A material was
used to simulate the RANDO phantom of dimensions
50.0 cm long, 25.0 cm wide and 21.5 cm thick. Its
composition and density were obtained from ICRU
Report No. 44 [19]. Williams [5] measured the scatter in
terms of air kerma normalized to the dose–area product
(DAP). Therefore, a DAP meter and the air between it
and the phantom surface were included in the voxel
model. McVey [20] showed that these materials produce
a significant amount of scatter. The DAP meter was
modelled as a solid block of Perspex with dimensions:
16.4 cm length, 18.1 cm width and 1.7 cm thickness. An
average density of 0.315 g cm23
was used for the
Perspex as the DAP meter was constructed from layers
of Perspex 0.2 cm thick with an air gap between them.
The DAP meter was assumed to be at a distance of
26.6 cm from the X-ray focus and the focus to surface
distance (FSD) was 80 cm. The incident field at the
phantom surface was 22 cm long and 17.5 cm wide. The
Table 1. The parameters used for the chest and lumbar spine imaging systems
Imaging system parameters
Parameter type Chest Lumbar spine
Tube voltage (kV) 141 72 (for AP projection),77 (for LAT projection)
Filtration (mmAl) 5.7 4.7
Target angle ( ˚) 15 12
Voltage ripple (%) 0 0
Focus film distance (cm) 150 146
Focus surface distance (cm) 127 112 (for AP projection); 98 (for LAT projection)
Field size at focus surface distance (cm6cm) 30.6621.2 27.5610.9 (for AP projection); 23.469.2 (for LAT
projection)
Chest stand/couch top 6.0 mm of wood 1.2 mm Al
AP, anteroposterior; LAT, lateral.
Table 2. The dimensions of the homogeneous voxel phan-
toms (P4) defined by the average patient model dimensions
Phantom dimensions (cm)
Examination Length Width Thickness
Chest PA 89.9 22.0 16.0
Lumbar spine AP 89.9 24.0 18.0
Lumbar spine LAT 89.9 17.6 24.4
PA, posteroanterior; AP, anteroposterior; LAT, lateral.
G McVey
132 The British Journal of Radiology, February 2006](https://image.slidesharecdn.com/026britishjournalofradiology-britishinstituteofradiology-2006-130913065550-phpapp02/75/British-Journal-of-Radiology-British-Institute-of-Radiology-2006-eng-137-2048.jpg)
![scatter was calculated at points 1 m from the centre of
the phantom for scattering angles between 30˚ and 150˚.
Results and discussion
Validation of the scatter calculations
The scatter calculations were validated by comparing
the scatter at points surrounding a block of solid water
calculated with the voxel Monte Carlo code to the values
calculated by an EGS4 Monte Carlo code for the same
geometry as described by McVey [20]. Good agreement
(within 2%) was shown between the values calculated by
the two codes for photon energies between 20 keV and
150 keV and for tube voltages between 50 kV and
120 kV.
The voxel Monte Carlo code could not be used to
simulate the scatter measurements previously carried
out in a clinical X-ray room as detailed by McVey and
Weatherburn [1]. This was due to the geometrical
limitations of the code and the size of the simulated
model. McVey and Weatherburn [1] used the EGS4
Monte Carlo code to calculate the scatter from solid
water blocks placed within a simulated X-ray room and
showed reasonable agreement with the measured scatter.
For this simulation, the percentage scatter contribution
from the X-ray room walls to the total calculated scatter
was determined to be small, being 3.7% [20]. Thus, the
scatter calculated by the voxel Monte Carlo code should
be reasonably representative of the scatter levels found
in clinical X-ray rooms.
Dependence of percentage scatter on phantom
type
Figure 2 shows the scatter from the four phantoms
calculated for the chest PA, lumbar spine AP and lumbar
spine LAT projections, respectively. The scatter for the
patient (P1) and the contoured phantom (P2) lie between
the values for the thick slab phantom (P3) and the slab
phantom with average dimensions (P4) below scattering
angles of 62˚ for the lumbar spine AP view, below 108˚
for the chest PA view and below 125˚ for the lumbar
spine LAT view. Therefore, the phantom with the
average dimensions (P4) can provide a conservative
estimate of the scatter from a patient (P1) for all
scattering angles for the chest PA and lumbar spine
LAT exams and for scattering angles less than 67˚ and
greater than 131˚ for the lumbar spine AP exam.
By comparing Figures 2a–c, it can be seen that the
chest PA examination produced the largest amount of
scatter as the highest tube voltage and largest field area
were employed. The lungs also attenuated the scattered
X-rays less than soft tissue. The lumbar spine AP
Figure 2. The variation of the percentage scatter with different phantom types (P1 to P4) for (a) the chest posteroanterior
projection, (b) the lumbar spine anteroposterior projection and (c) the lumbar spine lateral projection.
Simulating scatter from patients
The British Journal of Radiology, February 2006 133](https://image.slidesharecdn.com/026britishjournalofradiology-britishinstituteofradiology-2006-130913065550-phpapp02/75/British-Journal-of-Radiology-British-Institute-of-Radiology-2006-eng-138-2048.jpg)
![projection produced the least scatter in the forward
direction as it had the lowest tube voltage and provided
attenuation by a large thickness of soft tissue. The
lumbar spine AP projection produced more scatter in the
backward direction than the lumbar spine LAT projec-
tion as it had a larger field area.
The largest differences between the different phantom
types occurred between scattering angles of 30˚ and 87˚.
The largest difference was 77% for the lumbar spine AP
projection at 87˚. Table 3 shows the scatter for all the
phantoms relative to the patient model for 45˚ and 120˚
scattering angles as examples of forward and backward
directed scatter. The thick slab phantom (P3) produced
the least scatter in the forward direction as it had the
largest thickness and width and, therefore, greatly
attenuated the scattered X-rays. The contoured phantom
(P2) produced more scatter than the thick slab phantom
in the forward direction. The phantom obliquity attenu-
ated the scattered X-rays less. The contoured phantom’s
thickness and width varied along its length, and in
places these were larger than the phantom with average
dimensions (P4). Thus, the contoured phantom produced
less scatter than the phantom with average dimensions.
The scatter from the patient model (P1) was lower than
from the contoured phantom (P2) in the forward
direction. Bone attenuated the scattered X-rays more
than soft tissue in all the examinations. In the chest
examination, fewer scatter interactions occurred in lung
than soft tissue as its density was lower.
For different examinations, Table 3 shows that the
differences between the phantom types were larger in
the forward direction for the lumbar spine AP projection
compared with those for the chest examination as a
lower tube voltage was used for the lumbar spine AP
projection. For the lumbar spine LAT examination, the
differences were not as large as would be expected for
the large thickness of the patient in the lateral projection.
The field edge was close to the phantom boundary.
Therefore, there was less tissue to attenuate the forward
scattered photons.
Figure 2 shows that the phantom type had less effect in
the backward direction than in the forward direction for
the frontal projections. The scatter was produced near the
entrance surface of a phantom [20]. For the lateral
projection, changes in the phantom width were more
significant. The effect of the tissue inhomogeneities in the
Table 3. Percentage scatter for different phantom types (P1 to P4) relative to the percentage scatter for the patient model (P1)
Percentage scatter for a 45˚ scattering angle
Phantom type Chest PA exam Lumbar spine AP exam Lumbar spine LAT exam
Thick slab phantom (P3) 0.62 0.56 0.70
Contoured phantom (P2) 1.12 1.29 1.14
Patient model (P1) 1.00 1.00 1.00
Slab phantom with average dimensions (P4) 1.36 1.46 1.22
Percentage scatter for a 120˚ scattering angle
Phantom type Chest PA exam Lumbar spine AP exam Lumbar spine LAT exam
Thick slab phantom (P3) 1.16 0.91 0.96
Contoured phantom (P2) 1.17 1.04 1.08
Patient model (P1) 1.00 1.00 1.00
Slab phantom with average dimensions (P4) 1.32 0.99 1.22
PA, posteroanterior; AP, anteroposterior; LAT, lateral.
Table 4. The variation of percentage scatter from the patient (P1) for different tube voltages normalized to the scatter values
for reference imaging systems
Percentage scatter relative to the reference imaging system values
45˚ scattering angle 120˚ scattering angle
kV Chest PA exam Lumbar spine
AP exam
Lumbar spine
LAT exam
Chest PA exam Lumbar spine
AP exam
Lumbar spine
LAT exam
60 0.64 0.87
70 0.91 0.90 0.97 0.94
72 1.00 1.00
77 1.00 1.00
80 1.23 1.05 1.06 1.04
90 0.68 1.51 1.17 0.89 1.15 1.10
95 1.22 1.12
102 0.76 0.92
110 0.83 1.97 1.36 0.94 1.23 1.18
130 0.95 0.99
141 1.00 1.00
150 1.03 1.01
PA, posteroanterior; AP, anteroposterior; LAT, lateral.
G McVey
134 The British Journal of Radiology, February 2006](https://image.slidesharecdn.com/026britishjournalofradiology-britishinstituteofradiology-2006-130913065550-phpapp02/75/British-Journal-of-Radiology-British-Institute-of-Radiology-2006-eng-139-2048.jpg)
![backward direction was similar to their effect in the
forward direction for the chest PA and lumbar spine LAT
projections. For the lumbar spine AP projection, there was
a larger difference between the forward and backward
directed scatter as bone volume occupied a greater
proportion of the irradiated volume than for the other
projections.
Dependence of percentage scatter on tube voltage
Table 4 shows the variation of scatter normalized to
the reference system values for X-ray tube voltages
between 60 kV and 150 kV for the different examina-
tions. The largest variation was for forward directed
scatter in all projections. The forward directed scatter
became more penetrating with increasing tube voltage.
The majority of backward scattered X-rays were pro-
duced close to the entrance surface [20]. Therefore, there
was less of an effect for increasing tube voltage.
The percentage scatter for the lumbar spine AP
projection had the largest variation with tube voltage.
This projection had the lowest reference system tube
voltage of 72 kV. Therefore, increasing the tube voltage
had a large effect. The percentage scatter in the forward
direction increased by a factor of 2 for an increase in the
tube voltage of 38 kV.
The lumbar spine LAT projection had a smaller
variation with tube voltage than the AP projection. The
LAT projection had a reference system tube voltage of
77 kV and the field was positioned closer to the patient’s
edge than the AP projection. The chest PA projection had
a smaller variation with tube voltage than both the
lumbar spine projections. This was due to the high
reference system tube voltage of 141 kV and because the
lungs attenuated the scattered X-rays less than tissue in
the chest PA projection.
Table 5 compares the variation of the lumbar spine AP
and LAT values with those from McVey and
Weatherburn [1], Trout and Kelley [3] and Williams [5].
There were large differences in the variations of forward
directed scatter with tube voltage due to differences in
the attenuating properties of the phantoms used. The
differences in the variations were less in the backward
direction as the scatter was produced close to the
entrance surface of the phantom [20]. The variation of
Trout’s scatter values was considerably larger than the
other values. This was due to the 70 kV values being
produced by a self-rectified X-ray tube which had a low
beam quality. The variation of Williams’ scatter values
was slightly less than the other values. This was due to
the significant amount of scatter produced by the DAP
meter which was independent of tube voltage [1].
Dependence of percentage scatter on tube
filtration and voltage ripple
Table 6 shows the variation of percentage scatter with
tube filtration and voltage ripple. The filtration was
Table 5. A comparison of the variation of percentage scatter with tube voltage in the literature [1, 3, 5]
Percentage scatter relative to 70 kV values for a 45˚ scattering angle
Tube voltage (kV)
LS AP
exam values
LS LAT
exam values
Measured
values [1]
Calculated
values [1]
Trout and
Kelley [3] values
Williams
[5] values
50 0.52 0.84
60 0.70
70 1.00 1.00 1.00 1.00
80 1.35 1.17
85 1.13
90 1.65 1.30
95 1.35
100 4.76 1.28
110 2.16 1.51
120
125 6.19 1.51
150 8.10
Percentage scatter relative to 70 kV values for a 135˚ scattering angle
Tube voltage (kV)
LS AP
exam values
LS LAT
exam values
Measured
values [1]
Calculated
values [1]
Trout and
Kelley [3] values
Williams
[5] values
50 0.77 0.80 0.79 0.87
60 0.90
70 1.00 1.00 1.00 1.00 1.00 1.00
80 1.07 1.10
85 1.08
90 1.16 1.15
95 1.17
100 1.75 1.10
110 1.22 1.22
120 1.26 1.30
125 2.00 1.23
150 2.08
PA, posteroanterior; AP, anteroposterior; LAT, lateral.
Simulating scatter from patients
The British Journal of Radiology, February 2006 135](https://image.slidesharecdn.com/026britishjournalofradiology-britishinstituteofradiology-2006-130913065550-phpapp02/75/British-Journal-of-Radiology-British-Institute-of-Radiology-2006-eng-140-2048.jpg)

![system, which was close to the patient’s lateral bound-
ary. Second, the field centre was positioned at the centre
of the patient’s width. In both cases, the scatter was
calculated at points on the side of the patient where the
field was off-centre. Table 7 shows that the position of
field centre had a considerable effect. The percentage
scatter was larger for all scattering angles with the field
centred on the patient’s obliquity as there was less tissue
to attenuate the scattered radiation. The scatter for the
field centred on the patient obliquity was 2.3 times
greater than for the field centred on a thicker part of the
patient for a scattering angle of 45˚. Trout and Kelley [3]
found the scatter for the field centred at the phantom’s
edge was between 6.5 and 1.8 times larger than the
scatter for the field positioned at the centre of the
phantom’s width for tube voltages between 50 kV and
150 kV at a 45˚ scattering angle.
Shielding reports [6, 21] indicate a linear relationship
between scatter and field area. Table 8 shows that this
relationship is not valid for the variation of patient
scatter with field area. For a 25 cm 6 25 cm field area
incident in the chest PA view, the normalized scatter was
10.5% higher and 3.9% lower than expected for scattering
angles of 45˚ and 120˚. The forward directed scatter
values for the chest PA view were closest to the expected
variation with field area. The largest differences were
observed for the forward directed scatter in the lumbar
spine AP view. For the same field area incident in the
lumbar spine AP view, the normalized scatter was 90.7%
higher and 17.0% lower than expected for scattering
angles of 45˚ and 120˚.
The variation of scatter with field area shown in
Table 8 was due to the patient obliquities. A field width
of 25 cm covered the majority of the patient’s trunk.
The field edges were incident on the patient obliquities
and thus, the scattered X-rays were less attenuated.
The scatter was therefore larger than expected in the
forward direction. The patient’s obliquity produced a
small reduction in the amount of scatter produced in
the backward direction due to there being less tissue.
There was a greater difference for the lumbar spine
view than the chest PA view due to the lower tube
voltage.
A smaller number of field areas were investigated for
the lumbar spine LAT exam due to the small width of the
patient in this orientation. Table 8 shows the normalized
scatter values with the field centre close to the patient
obliquity (reference system position) and the field
positioned at the centre of the patient’s width. With the
225 cm2
field centred medially on the patient, the
normalized values were 3.38 and 2.29 for scattering
angles of 45˚and 120˚. With the field moved laterally by
3 cm, the normalized scatter values were smaller and
thus, there was a larger variation if the field was centred
over a thick part of the patient than if the field was
centred on the patient obliquity. However, the actual
scatter values tended to be larger for the field positioned
at the patient obliquity than at the patient centre as there
was less attenuation of the scattered X-rays (Table 7). If
the scatter was calculated at points on the other side of
the patient than the field centre, then the increased
attenuation would substantially reduce its amount.
Table 8. Percentage scatter for different square field areas relative to the percentage scatter for the 100 cm2
square field areas
given in Table 7
Percentage scatter normalized to the value for a 10 cm610 cm field size at a 45˚ scattering angle
Exam Chest PA exam Lumbar spine AP exam Lumbar spine LAT exam Lumbar spine LAT exam
Imaging system Reference system Reference system Reference system Field centred on patient centre
Field size
(cm6cm)
Expected
values
565 0.25 0.25 0.21 0.20 0.20
10610 1.00 1.00 1.00 1.00 1.00
15615 2.25 2.20 2.86 1.61 3.38
20620 4.00 4.07 7.55
25625 6.25 6.90 11.92
30630 9.00 9.45 14.52
35635 12.25 11.64 17.38
Percentage scatter normalized to the value for a 10 cm610 cm field size at a 120˚ scattering angle
Exam Chest PA exam Lumbar spine AP exam Lumbar spine LAT exam Lumbar spine LAT exam
Imaging system Reference system Reference system Reference system Field centred on patient centre
Field size
(cm6cm)
Expected
values
565 0.25 0.26 0.25 0.26 0.26
10610 1.00 1.00 1.00 1.00 1.00
15615 2.25 2.22 2.25 1.63 2.29
20620 4.00 3.94 3.86
25625 6.25 6.01 5.19
30630 9.00 7.78 6.13
35635 12.25 9.34 7.16
PA, posteroanterior; AP, anteroposterior; LAT, lateral.
Simulating scatter from patients
The British Journal of Radiology, February 2006 137](https://image.slidesharecdn.com/026britishjournalofradiology-britishinstituteofradiology-2006-130913065550-phpapp02/75/British-Journal-of-Radiology-British-Institute-of-Radiology-2006-eng-142-2048.jpg)
![Figure 3 shows the variation of scatter with square,
rectangular and equivalent square field areas between
25 cm2
and 900 cm2
for a 45˚ scattering angle for the
lumbar spine AP and chest PA projections. The
rectangular field length was kept constant at 30 cm and
the width increased from 5 cm to 30 cm. In X-ray room
design it is difficult to account for the variation of field
dimensions used in the clinical situation. Therefore, one
method investigated was to calculate the equivalent
square field area (s2
) using the equivalent square field
length (s) and the rectangular field dimensions (x and y)
shown in Equation (1) [22].
s~
2xy
xzyð Þ
ð1Þ
Figure 3a shows large differences in the variation of
scatter between square and rectangular field sizes for the
lumbar spine AP projection as a low tube voltage was
employed. There was an 82% difference between the
rectangular and square fields with areas of 300 cm2
(i.e.
10 cm 6 30 cm for the rectangular field). For the
rectangular field, the scattered X-rays were more
attenuated as the smaller width covers thicker parts of
the patient. For the square field, the scattered X-rays
were less attenuated as the field edge was closer to the
patient obliquity. Figure 3a shows that the equivalent
square field approximated the variation of scatter for
square fields well when the smallest rectangular field
dimension was greater than or equal to 10 cm. For the
smallest field dimension of 5 cm, the equivalent square
field overestimated the scatter for the square field.
Figure 3b shows that for the chest PA projection, the
differences in the scatter between square and rectangular
field sizes were less than for the lumbar spine AP view
due to the lower attenuation of the lung and the higher
tube voltage. For example, for field areas of 300 cm2
, a
difference of 11.4% was observed at a 45˚ scattering
angle. The scatter for the rectangular fields was closer to
the square field values than the equivalent square field
values where the smallest rectangular field dimension
was less than or equal to 10 cm. For both examinations,
the variation of backward directed scatter with field area
was similar for both square and rectangular fields.
Therefore, the scatter value for the largest appropriate
square field should be employed in X-ray room design to
provide a conservative dose estimate. The scatter from
large rectangular fields and their equivalent square field
sizes tends to be less than the scatter from square fields.
Comparison of scatter values in the literature
Table 9 shows a summary of the imaging parameters
stated in the literature which were used to obtain the
scatter values shown in Table 10. All the imaging system
Figure 3. The variation of the normalized percentage scatter at a 45˚ scattering angle with square, rectangular and equivalent
square field sizes between 25 cm2
and 900 cm2
for (a) the lumbar spine anteroposterior projection and (b) the chest
posteroanterior projection.
Table 9. The parameters used for measuring scatter in the different reports in the literature [1–3, 5, 20]
Image parameters
Parameter type Trout and Kelley [3] Bomford and Burlin [2] McVey and Weatherburn
[1, 20]
Williams [5]
Tube voltages (kV) 50, 70, 100 100 50, 70, 100a
50, 70, 100
Filtration (mmAl) 0.5, 1.5, 2.5 – 3.4 3.5
Generator type Self-rectified and
single phaseb
– Medium frequency,
3% ripple
Constant potential
Phantom material Torso-shaped masonite MixD block Solid Water block RANDO phantom
(Alderson A muscle)
Phantom dimensions
(cm6cm6cm)
72630620 30630622 30.5630.5610 50625621.5
Incident field size 20 cm620 cm 400 cm2
(circle) 20 cm620 cm 22 cm617.5 cm
FSD (cm) 100 – 100 80
a
100 kV for calculation only.
b
50 kV and 70 kV were used with a self-rectified generator and 100 kV was used with a single phase generator.
G McVey
138 The British Journal of Radiology, February 2006](https://image.slidesharecdn.com/026britishjournalofradiology-britishinstituteofradiology-2006-130913065550-phpapp02/75/British-Journal-of-Radiology-British-Institute-of-Radiology-2006-eng-143-2048.jpg)
![parameters were selected to be as similar as possible for
this comparison. The range of tube voltages studied was
restricted to be from 50 kV to 100 kV. All scattering
materials used were tissue equivalent. The phantoms
used by Trout and Kelley [3] and Williams [5] had a
human body contour. The voxel Monte Carlo code was
used to model the experimental set up for Williams
scatter measurements (as detailed above).
The scatter values in Table 10 were corrected where
necessary to the same units of percentage scatter.
Bomford and Burlin [2] measured the percentage scatter
for incident air kerma on the surface of the phantom.
Thus, a backscatter factor of 1.3 [22] was used to give the
values in Table 10 as the ratio of scattered air kerma to
incident air kerma without backscatter. Williams [5]
reported scattered air kerma divided by the DAP.
Williams’ values in Table 10 were converted to be in
terms of scattered air kerma divided by the incident air
kerma without backscatter. These values were also
increased to be equivalent to a field area of 400 cm2
,
which was the same field area as the other studies,
instead of 385 cm2
as shown in Table 9.
Table 10 shows that there was good agreement
between the calculated and measured scatter values
reported by McVey and Weatherburn [1] and the
calculated values given in the previous section and with
the measured values given by Williams [5]. These
agreements give confidence in both the calculations
and measurements. Both studies [1, 5] employed modern
equipment, including a DAP meter, in the experimental
set up. A FSD of 100 cm was used in the work of McVey
and Weatherburn and a FSD of 80 cm was used in the
work of Williams (Table 9). Williams’ values were
considerably greater than those of McVey and
Weatherburn for scatter in the backward direction. The
difference in FSD produced a difference in the position of
the DAP meter which resulted in large differences in the
scatter in the backward direction. McVey and
Weatherburn’s values were greater than Williams’
values in the forward direction due to the smaller
phantom thickness. Scatter in the backward direction
was less affected by changes in phantom thickness than
scatter in the forward direction [20].
The patient scatter values, calculated for the lumbar
spine AP view at 72 kV, were similar to Williams’ values
in the forward direction and less than Williams’ values in
the backward direction (Table 10) as a DAP meter was
not included in the scatter calculations.
Table 10 shows that there was poor agreement in the
forward directed scatter values reported by Bomford and
Burlin [2] and Trout and Kelley [3]. For example at a 30˚
scattering angle, Bomford’s values were 0.2 times smaller
than Trout’s. It is difficult to understand the reason for
the differences between Trout’s and Bomford’s results as
their phantoms had similar thicknesses (Table 9).
Bomford and Burlin had corrected their values for
scatter from the surroundings and leakage from the X-
ray tube head. These contributions were a large propor-
tion of the total reading as the scatter from the phantom
was small in the forward direction. McVey [20] calcu-
lated that the scatter from the collimators, ceiling, floor
and walls varied between 0.03% and 0.05%. This
accounted for some of the differences which were
between 0.045% and 0.101%, but also suggested that
Table 10. Comparison of published scatter values [1–3, 5, 20] and the scatter calculated using the voxel Monte Carlo code (MC)
in this paper for tissue equivalent materials
Percentage scatter values for 50 kV X-rays
Source of data 30˚ 45˚ 60˚ 90˚ 120˚ 135˚ 150˚
Trout and Kelley [3] 0.044 0.011 0.012 0.024 0.069 0.095 –
Measured values [1] – – – – – 0.181 –
Calculated values [1] 0.081 0.059 0.048 0.041 0.114 0.140 0.222
Williams [5] 0.071 0.070 0.073 0.120 0.221 0.279 0.314
Voxel MC calculated values 0.059 – 0.068 0.100 0.162 – 0.321
Percentage scatter values for 70 kV X-rays
Source of data 30˚ 45˚ 60˚ 90˚ 120˚ 135˚ 150˚
Trout and Kelley [3] 0.052 0.021 0.020 0.035 0.091 0.120 –
Measured values [1] – 0.137 – 0.078 0.195 0.237 0.252
Calculated values [1] 0.123 0.090 0.068 0.052 0.143 0.181 0.269
Williams [5] 0.084 0.083 0.086 0.137 0.253 0.322 0.358
Voxel MC calculated values 0.080 – 0.090 0.126 0.196 – 0.363
Lumbar spine AP view values (72 kV)a
0.072 0.084 0.096 0.119 0.185 0.218 0.244
Percentage scatter values for 100 kV X-rays
Source of data 30˚ 45˚ 60˚ 90˚ 120˚ 135˚ 150˚
Trout and Kelley [3] 0.127 0.100 0.098 0.110 0.190 0.210 –
Bomford [2] 0.026 0.039 0.052 0.065 0.156 0.221 0.273
Calculated values [20] 0.180 0.133 0.098 0.070 0.176 0.220 0.309
Williams [5] 0.108 0.106 0.108 0.163 0.291 0.355 0.412
Voxel MC calculated values 0.106 – 0.116 0.153 0.228 – 0.395
AP, anteroposterior.
a
20 cm 6 20 cm incident field size.
Simulating scatter from patients
The British Journal of Radiology, February 2006 139](https://image.slidesharecdn.com/026britishjournalofradiology-britishinstituteofradiology-2006-130913065550-phpapp02/75/British-Journal-of-Radiology-British-Institute-of-Radiology-2006-eng-144-2048.jpg)
![the masonite and MixD phantoms may have substan-
tially different attenuating properties. The scatter values
were similar in the backward direction for the two
phantoms as the scatter was less dependent on the
phantom thickness or density.
Conclusions
Accurate determination of the scatter in X-ray rooms is
important for designing shielding to meet the desired
radiation protection requirements. Previous studies have
used a variety of phantoms to estimate these scatter levels
and, as a review of the literature has shown, there are large
differences in the published scatter values. The work in
this paper has determined the magnitude of scatter from
patients undergoing diagnostic X-ray procedures with the
imaging system parameters varied in a systematic manner
to provide a comprehensive data set.
The voxel Monte Carlo calculations have demon-
strated that the linear relationship between scatter and
field area, as used in shielding reports [6, 21], is not valid
for patient irradiation. For example, the scatter was 91%
larger than the expected value for increasing the area of a
square field from 100 cm2
to 625 cm2
for a patient
undergoing an X-ray examination in the lumbar spine
region. The position of the field on the patient in relation
to the calculation points also had an effect. The scatter
from a patient undergoing a lumbar spine LAT exam
increased by 2.3 times for the centre of the field being
moved from the centre of patient’s width closer to the
patient’s obliquity with the calculation points on the
same side of the patient. If scatter was calculated on both
sides of the patient and the field centre moved laterally,
then the scatter distribution would become asymmetric
i.e. the scatter would be higher on one side compared
with the other. Thus, the calculation points on the same
side of the patient as the lateral shift would provide a
conservative estimate of the scatter. As well as X-ray
room design, this work can be applied to estimate the
doses received by staff who undertake interventional
procedures.
The Monte Carlo calculations have also demonstrated
small variations in patient scatter, in particular for
changing the tube voltage ripple. For example, the
scatter from a patient undergoing a lumbar spine AP
exam increased by 22% if an X-ray generator with a
voltage ripple of 50% was replaced by a constant
potential X-ray generator, whereas the scatter
increased by 97% if the tube voltage increased by
38 kV. Therefore, replacing X-ray generators with sub-
stantial voltage ripple by medium frequency units would
not produce sufficiently more scatter to warrant a change
to the X-ray room design (using the same dose
constraint).
A review of published scatter values [1, 5] has
suggested that there was a FSD dependence on back-
ward directed scatter when a DAP meter was present.
However, Marshall and Faulkner [4] found no FSD
dependence for air kerma measured adjacent to the
couch for a 90˚scattering angle, i.e. at a position forward
of the DAP meter. Marshall and Faulkner imply that the
FSD was simply increased, leading to an increase in field
size incident on the phantom, which may explain the
constancy in their scatter measurements. McVey and
Weatherburn [1] showed that there was a large variation
in backward directed scatter from the DAP meter.
Therefore, further work is necessary to investigate these
effects, their influence on patient scatter and their
possible impact on shielding barrier calculations.
For X-ray room design, the largest scatter values
provided by either McVey and Weatherburn [1] or
Williams [5] are recommended to provide a conservative
dose estimate at any FSD. The scatter from the patient
detailed in this paper may also be considered. In this
case, the significant scatter from the surroundings (e.g.
the DAP meter and X-ray collimators) [1] should be
taken into account. The inconsistent forward scatter
values given by Trout and Kelley [3] and Bomford and
Burlin [2] are not recommended for use even for X-ray
units which have significant voltage ripple. In this case,
the scatter data from this work, McVey and Weatherburn
[1] or Williams [5] should be used and modified by the
ratios detailed in this paper depending on the amount of
voltage ripple. The work in this paper can also be used to
study the effect of changing tube voltage, filtration,
voltage ripple, field area and field position on the patient
scatter. For example, in X-ray room design, these factors
can be used to increase the recommended scatter values
or independently measured scatter values to provide a
conservative dose estimate as appropriate to the clinical
situation.
Acknowledgments
I would like to thank Dr David Dance, Prof. Gudrun
Alm Carlsson and Dr Michael Sandborg for providing the
voxel Monte Carlo code which was the basis of the scatter
calculations. I also acknowledge the use of the computer
facilities at the Physics Department, Royal Marsden
Hospital, London, where all the Monte Carlo simulations
described in this paper were undertaken.
References
1. McVey G, Weatherburn H. A study of scatter in diagnostic
X-ray rooms. Br J Radiol 2004;77:28–38.
2. Bomford CK, Burlin TE. The angular distribution of
radiation scattered from a phantom exposed to 100–
300 kVp X-rays. Br J Radiol 1963;36:426–39.
3. Trout ED, Kelley JP. Scattered radiation from a tissue
equivalent phantom for X-rays from 50 to 300 kVp.
Radiology 1972;104:161–9.
4. Marshall NW, Faulkner K. The dependence of scattered
radiation dose to personnel on technique factors in
diagnostic radiology. Br J Radiol 1992;65:44–9.
5. Williams JR. Scatter dose estimation based on dose area
product and the specification of radiation barriers. Br J
Radiol 1996;69:1032–7.
6. Sutton DG, Williams JR. Radiation shielding for diagnostic
X-rays. Joint report of the BIR/IPEM working party, 2000.
7. Zubal G, Harrell CR. Voxel based Monte Carlo calculations
of Nuclear Medicine images and applied variance reduction
techniques. Image Vision Computing 1992;10:342–8.
8. Zubal G, Harrell CR, Smith EO, Rattner Z, Gindi G, Hoffer
PB. Computerised three dimensional segmented human
anatomy. Med Phys 1994;21:299–302.
9. Sandborg M, McVey G, Dance DR, Alm Carlsson G.
Schemes for the optimization of chest radiography using a
G McVey
140 The British Journal of Radiology, February 2006](https://image.slidesharecdn.com/026britishjournalofradiology-britishinstituteofradiology-2006-130913065550-phpapp02/75/British-Journal-of-Radiology-British-Institute-of-Radiology-2006-eng-145-2048.jpg)

![Techniques for measurement of dose width product in panoramic
dental radiography
P DOYLE, MSc, C J MARTIN, PhD and J ROBERTSON, PhD
Health Physics, Department of Clinical Physics and Bio-Engineering, Gartnavel Royal Hospital,
Glasgow G12 OXH, UK
ABSTRACT. Dose width product (DWP) is the quantity recommended for assessment of
patient dose for panoramic dental radiography. It is the product of the absorbed dose
in air in the X-ray beam integrated over an exposure cycle and the width of the beam,
both measured at the receiving slit. A robust method for measuring the DWP is
required in order to facilitate optimization of practices and enable comparison of dose
levels at different centres. In this study, three techniques for measuring the DWP have
been evaluated through comparison of results from 20 orthopantomographic units.
These used a small in-beam semiconductor detector and X-ray film, a pencil ionization
chamber and an array of thermoluminescent dosemeters (TLDs). The mean results
obtained with the three techniques agreed within ¡6%. The technique employing a
pencil ionization chamber of the type used for dose assessment of CT scanners is the
simplest and most reliable method. The in-beam detector and film method has larger
errors both from positioning the radiation detector and from measurement of X-ray
beam width, which should be the full width at half maximum obtained from a scan of
the film optical density. The TLD array method was accurate, but more time consuming
to carry out. The mean DWP for the units studied was 65 mGy mm and the mean dose–
area product was 89 mGy cm2
. The DWP for 30% of the units tested exceeded the
diagnostic reference dose of 65 mGy mm, recommended by the National Radiological
Protection Board.
Received 7 March 2005
Revised 7 June 2005
Accepted 15 June 2005
DOI: 10.1259/bjr/33207232
’ 2006 The British Institute of
Radiology
Panoramic radiography is a technique used in den-
tistry to show the mandibular joints with the teeth laid
out between them. The X-ray tube and film holder both
rotate during the exposure. The film is exposed to a
narrow X-ray beam through a secondary collimator slit,
across which the film moves as the radiographic image is
built up. The assessment of patient dose in panoramic
radiography is difficult because of the dynamic nature of
the imaging process and the narrow width of the X-ray
beam. The dose quantity used is the product of the
absorbed dose in air and the horizontal width of the
beam, both measured at the front side of the secondary
collimator slit, and integrated over a standard exposure
cycle. This is referred to as the dose width product
(DWP) with units of mGy mm. The DWP provides a
measurement related to the total amount of radiation to
which the patient is exposed. It can be derived either
from the product of the peak dose at the centre of the X-
ray beam and the width of the beam, or from an
incremental summation of the dose across the beam. The
aim of this study has been to compare and evaluate
results obtained from different techniques available for
measuring DWP.
As part of the National Radiological Protection Board
(NRPB) dental X-ray protection service, Napier reported
DWPs for 387 panoramic dental X-ray sets derived from
a technique that employed film to assess both dose and
beam width [1]. Based on results from this survey, the
Dental Guidance Notes recommend that a DWP of
65 mGy mm should be adopted as a local diagnostic
reference level (DRL) for a standard adult panoramic
radiograph [2]. Results from this study have been
compared with this value.
Method
The dose measurement techniques used in this study
were:
(a) ‘‘In-beam’’ detector and film: Measurement of peak
dose within the X-ray beam at the receiving slit
using a small solid state detector and determination
of the beam width using X-ray film [3]. The DWP is
calculated from the product of peak dose and beam
width.
(b) Partial volume detector: Direct measurement of the
summation of dose across the beam obtained from
the partial volume irradiation of a pencil ionization
chamber [4, 5].
(c) Thermoluminescent dosemeter (TLD) array: Measure-
ment of dose at the receiving slit using a linear array
of TLDs. This method can evaluate the DWP either
from the incremental summation of dose across the
beam or from the peak dose multiplied by the beam
width [3, 6].
More details of the techniques used and the measure-
ments made in evaluating them are given in the
following paragraphs.
The British Journal of Radiology, 79 (2006), 142–147
142 The British Journal of Radiology, February 2006](https://image.slidesharecdn.com/026britishjournalofradiology-britishinstituteofradiology-2006-130913065550-phpapp02/75/British-Journal-of-Radiology-British-Institute-of-Radiology-2006-eng-147-2048.jpg)
![‘‘In-beam’’ detector and film
A solid state detector that has an active width of
1.5 mm, which is marketed for measurement of the
DWP, was used with an Unfors 511 Mult-O-Meter
(Unfors Instruments AB, Billdal, Sweden).
Measurement showed that the length of the sensitive
region was approximately 4 mm. The detector was
attached to the front side of the secondary collimator
parallel to the slit and aligned visually with the slit. It is
important that the detector is aligned accurately with the
X-ray beam and is sufficiently narrow to enable it to lie
entirely within the region of the dose peak in order to
give an accurate result.
An assessment of the spatial response across the solid
state detector was made using an X-ray beam from a
radiographic unit collimated by a 0.2 mm wide lead slit.
The detector was moved perpendicular to the slit in
0.2 mm steps by means of a micromanipulator with a
vernier scale.
Images of the X-ray beam at the receiving slit of each
orthopantomographic (OPT) X-ray unit were obtained by
exposing Kodak T-mat L film. When this technique is
employed, care is needed to avoid saturating the film.
The width of the beam was obtained by measuring the
film optical density with a microdensitometer (MKIII CS;
Joyce-Loebl Ltd, Gateshead, UK) and determining the
full width at half maximum (FWHM) (technique A1).
However, a simple measurement using a ruler with a
light box (technique A2) has been recommended [3] and
this was also used in order to determine whether the
errors involved were significant.
Partial volume detector
A pencil ionization chamber commonly used for CT
dose index measurements (model No. 20X5-CT with a
MDH 2025 electrometer; Radcal Corporation, Monrovia,
NY) was attached in front of the secondary collimator,
perpendicular to the slit. The DWP was taken as the
product of the partial volume irradiation reading and the
active length of the chamber (100 mm) (technique B).
TLD array
This technique involved measuring the dose profile at
the receiving slit using an array of 34 TLDs mounted in a
Perspex jig with 1 mm thick walls and lid. The TLDs
used were high sensitivity LiF:Mg:Cu:P TLD-100H chips
(0.38 mm thick and 3.2 mm diameter), calibrated in a
70 kVp X-ray beam against air kerma in air, measured
using a 6 cm3
chamber and a Radcal 9010 electrometer.
The TLDs were placed on their edge, side by side in the
jig, which was then positioned in the centre of the
secondary collimator perpendicular to the slit. The TLDs
were read out using a Harshaw 5500 TLD reader (Qados,
Sandhurst, UK). The dose that each TLD received was
obtained by correcting the readout for background
radiation and applying a batch calibration factor. The
spacing of the TLDs in the jig was determined from a
measurement of the length of the arrays and found to be
0.40 mm. The DWP was calculated from the sum of the
doses received by all the TLDs d1–d34, multiplied by the
spacing w (technique C1) i.e.:
DWP 5 w(d1 + d2 +...+ d34)
The doses recorded were plotted against position in
the jig to give a profile of the dose distribution across the
slit (Figure 1). The DWP was also calculated from the
product of the maximum dose at the centre of the beam
and the FWHM value (technique C2). Comparison of
techniques C1 and C2 was used to confirm that the dose
summation and the product of peak dose and FWHM
gave similar results for the DWP.
Study method
Detectors and TLDs were all calibrated with respect to
an ionization chamber with a Keithley Triad 35050A
dosemeter system, which had a calibration traceable to a
national standard. Relative responses were measured
with the detector free in air and lying on a steel plate
with a slit overlying a cassette to simulate actual
exposure conditions. Based on these measurements,
results obtained with the CT chamber and the TLDs
were reduced by 5% to allow for the effect of backscatter.
The Unfors detector is shielded from backscatter to a
greater extent because of the metal its plate to its rear.
Measurements of DWP using the three techniques
were made on 20 different OPT X-ray units from eight
manufacturers (Table 1). The OPT units had been
installed at various times over the previous 25 years
and had an average age of 10 years. Successive
measurements were made using each of the three
techniques at the standard adult settings, typically; tube
potential 70 kV, tube current 10 mA and exposure time
16 s, and values for the DWP derived for each technique.
Experimental errors for the different techniques were
estimated to be A1 ¡16%, A2 ¡19%, B ¡7% and C1
¡8% and C2 ¡8%. Errors are expressed as percentages
for each result, combining errors from individual
components. The largest contributions were from the
measurement of beam width using a ruler and the
positioning of the Unfors detector.
The dose–area products (DAPs) for each unit were
calculated from the product of the DWP and the beam
length L [6]. The mean value for the DWP derived from
measurement techniques A1, B and C2 was employed.
The beam length L was measured with a ruler on a light
box using the film exposed for technique A.
Results
The OPT units studied had a range of beam widths
and examples of dose profiles obtained using TLDs for
OPT units with average beam widths of 2.5 mm and
4 mm are shown in Figure 1. DWP results obtained
using the different techniques are shown in Table 1. The
two sets of values for the DWP obtained from the TLD
data using different calculation methods, i.e. from dose
summation and from the product of the peak and the
FWHM, are compared in Figure 2. The ratio of the DWPs
measured using the two techniques is 0.96¡0.02 (mean
¡ standard error of the mean (sem)), confirming that the
Dose measurement for paranormic dental radiography
The British Journal of Radiology, February 2006 143](https://image.slidesharecdn.com/026britishjournalofradiology-britishinstituteofradiology-2006-130913065550-phpapp02/75/British-Journal-of-Radiology-British-Institute-of-Radiology-2006-eng-148-2048.jpg)

![FWHM of the OPT units included in this study is
4.0¡0.3 mm. The average beam width measured from
the film with a ruler and a light box was 20% higher
than the FWHM, and the DWP results calculated using
this (technique A2) were higher than those obtained
using the other techniques (Table 1, Figure 3). The
overestimation of the beam width was partially offset
by the lower dose resulting from misalignment of the
detector.
Values of DAP were calculated for each unit from the
product of the average DWPs derived from techniques
A1, B and C1 and measurements of the slit length L
(Figure 4). The average beam length L was 136¡2 mm
and the average DAP was calculated to be 89¡8 mGy
cm2
. Values of the mean and third quartile DWP
and DAP are compared with results from other studies
in Table 2. The average DWPs were greater than
the proposed DRL of 65 mGy mm [2] for 30% of the
units. 400 speed index systems are recommended by
the European Guidelines on Quality Criteria for
diagnostic radiographic images [7]. The five units
with the highest DWPs and DAPs all used films
with speed indices of 200–250, while the two lowest
both used direct digital radiography (DR), (Table 1,
Figure 4).
Discussion
All three techniques gave results within reasonable
agreement, but the errors associated with the in-beam
detector and film technique A are larger than those for
techniques B and C. For technique A, a microdensit-
ometer was required for the measurements and it was
important that exposures were limited to avoid satura-
tion of the film emulsion in order that accurate results
could be obtained. Measurement of the beam width with
a ruler gave a result 20% greater than the FWHM and
this method is therefore not appropriate. Use of a 35 mm
film scanner (PrimeFilm 1800u; Pacific Image Electronics,
Torrance, CA) linked to a PC with appropriate software
(e.g. Scion Image; Meyer Instruments Inc., Houston, TX)
and a calibrated film test strip to allow optical densities
to be determined provides an inexpensive method for
film scanning if a microdensitometer is not available,
although this requires further limitation to be placed on
the exposure because the measurable range in optical
density is more limited. Another potential source of error
in technique A is the visual positioning of the detector.
The active area of the detector is 1.5 mm in diameter,
which is similar to the width of the dose peak (Figure 1)
with seven of the units studied having beam widths of
Figure 2. Plot of dose width
products (DWPs) derived from
thermoluminescent dosemeters
(TLDs) showing the DWP derived
from the product of the peak dose
and full width half maximum
(FWHM) against the DWP from the
summation of the doses for all the
TLDs across the beam. The line of
identity is a 45˚ trendline.
Figure 3. Plot of dose width
product (DWP) measurements using
an Unfors detector (techniques
A1 – with full width half maximum
(FWHM) derived from
thermoluminescent dosemeter (TLD)
profile and A2 – FWHM measured
with a ruler and film) and a pencil
ionization chamber (technique B),
against the DWP derived from
summation of doses across the beam
from TLDs (technique C1). The line
of identity is a 45˚ trendline.
Dose measurement for paranormic dental radiography
The British Journal of Radiology, February 2006 145](https://image.slidesharecdn.com/026britishjournalofradiology-britishinstituteofradiology-2006-130913065550-phpapp02/75/British-Journal-of-Radiology-British-Institute-of-Radiology-2006-eng-150-2048.jpg)
![3 mm or less (Table 1). The detector’s active area must be
positioned within 0.5 mm of the centre of the beam to
keep errors to within ¡5%. A dedicated holder
incorporating a phosphor screen to facilitate alignment
of the detector with the X-ray beam is available from the
supplier of the detector, although it was not used in this
study.
The partial volume chamber method (B) is the most
direct and simplest of the three techniques. Errors in the
technique result from the calibration of the ionization
chamber and the magnitude of the backscatter. When
using this and technique A, care must be taken to ensure
that the length of cable attached to the detector is
sufficient to account for the rotational movement
involved in the scan.
Method (C) using the TLD array is the most time
consuming of the three techniques because of the
handling and processing of the high sensitivity TLDs,
which are brittle and need to be handled with care. The
technique is accurate and so provides a useful method
for dose comparisons, but is not recommended for
routine use. It was useful for confirmation that values
for the summation of the dose across the beam were
similar to the product of the peak dose and FWHM. The
agreement is closer than that reported in a previous
study [6], probably because the earlier study used TLDs
that were 0.85 mm thick. As a result, a limited number
would lie within the X-ray peak, and this is likely to
affect the accuracy of measurements of both the peak
dose and the FWHM.
The average DWP from the three techniques assessed
in this study is similar to the reference dose recom-
mended by the NRPB [1] and to the mean values
reported in other studies by medical physics depart-
ments [6, 8] (Table 2). In the present study, the third
quartile was not significantly different from the pro-
posed DRL [2] because there were a significant number
of units with similar DAPs (Figure 4). The third quartile
values in other studies tended to be higher than the
DRL. This could reflect differences resulting from the
sample size or distribution, measurement technique
or poorer optimization. It will also be influenced by
the 5% correction applied to account for backscatter in
techniques B and C in the present study. DAP measure-
ments were slightly less than results from other studies
(Table 2) [5, 6, 9].
Six of the units tested in this study had a DWP greater
than the DRL of 65 mGy mm. Five of these were using a
film/screen combination with a nominal speed index of
200 or 250, so adoption of a 400 speed system, which
could potentially reduce these doses by 40–50%, has been
recommended with a proportionate reduction in expo-
sure levels. Two of the units had DWPs that were close to
the recommended suspension level of 150 mGy mm [10]
and these units also had beam widths of 7–8 mm which
were significantly broader than the maximum recom-
mended value of 5 mm [2]. Investigation of the operation
of the units has been recommended in order to optimize
the system set ups and so reduce the exposures.
Conclusion
This study has measured the DWP using three
different techniques. The method using a semiconductor
detector and film required the slit width to be assessed
Figure 4. Bar chart showing
dose–area product (DAP) values for
a standard adult exposure for the 20
units studied. Data from film/screen
combinations with indices of
200–250 (F250, dark) and 400 (F400,
light), and from computed
radiography (horizontal lines) and
digital radiography (angled lines)
systems are indicated by different
shading.
Table 2. Comparison of results of this study with published
data
Sample
size
DWP (mGy mm): DAP (mGy cm2
):
Mean 3rd
Quartile
Mean 3rd
Quartile
This study 20 65 67 89 90
Napier [1] 387 57 67
Isoadri and
Ropolo [4]
5 74 84
Perisinakis and
Damilakis [5]
6 113
Williams and
Montgomery
[6]
16 65 76 113 139
Oduko [8] 26 69 80
Tierris et al
[9] (male)
62 101 117
(female) 62 85 97
DWP, dose width product.
P Doyle, C J Martin and J Robertson
146 The British Journal of Radiology, February 2006](https://image.slidesharecdn.com/026britishjournalofradiology-britishinstituteofradiology-2006-130913065550-phpapp02/75/British-Journal-of-Radiology-British-Institute-of-Radiology-2006-eng-151-2048.jpg)
![from the FWHM of the exposure peak, measured using a
microdensitometer, as use of a simple ruler measurement
[3] gave a result 20% greater than the true one.
Uncertainty in alignment of the detector with the X-ray
beam of more than 0.5 mm could result in a significant
error. If this technique is employed, a microdensitometer
and a dedicated alignment tool are recommended.
Use of a partial volume ionization chamber technique
(B) provides a simple, robust method for direct measure-
ment of the DWP, and is recommended as the technique
of choice. The measurements are simple to record, avoid
errors from positioning the radiation detector and do not
require a measurement of beam width. The pencil type
ionization chamber is also widely available and com-
monly used in diagnostic radiology departments for the
measurement of CT dose index.
Acknowledgments
The authors would like to thank Louise Lindsay
and Navneet Dulai for their assistance with the DWP
measurements.
References
1. Napier D. Reference doses for dental radiography. Br
Dental J 1999;186:8.
2. NRPB. Guidance notes for dental practitioners on the safe
use of X-ray equipment. NRPB, Department of Health,
Chilton, UK: NRPB, 2001.
3. British Institute of Radiology. Assurance of quality in the
diagnostic imaging department (2nd edn). London, UK:
BIR, 2001:51.
4. Isoardi P, Ropolo R. Measurement of dose–width product
in panoramic dental radiology. Br J Radiol 2003;76:
129–31.
5. Perisinakis K, Damilakis J, Neratzoulakis J, Gourtsoiannis
N. Determination of dose–area product from panoramic
radiography using a pencil ionization chamber: normalized
data for the estimation of patient effective and organ doses.
Med Phys 2004;31:4.
6. Williams JR, Montgomery A. Measurements of dose in
panoramic dental radiology. Br J Radiol 2000;73:1002–6.
7. Commission of the European Communities. European
Guidelines on Quality Criteria for diagnostic radiographic
images. EUR 16260 EN. Brussels, Belgium: CEC, 1996.
8. Oduko J. Optimisation of patient dose and image quality in
dental radiology– Over 65 time to retire your OPG? IPEM
Meeting, York, March 2001.
9. Tierris CE, Yakoumakis EN, Bramis GN, Georgiou E. Dose
area product reference levels in dental panoramic radi-
ology. Radiat Protection Dosim 2004;111:283–7.
10. Institute of Physics and Engineering in Medicine, College of
Radiographers, NRPB. Recommended Standards for the
Routine Performance Testing of Diagnostic X-ray Imaging
Systems, IPEM Report No. 77. IPEM: York, 1997.
Dose measurement for paranormic dental radiography
The British Journal of Radiology, February 2006 147](https://image.slidesharecdn.com/026britishjournalofradiology-britishinstituteofradiology-2006-130913065550-phpapp02/75/British-Journal-of-Radiology-British-Institute-of-Radiology-2006-eng-152-2048.jpg)
![A comparison of three-field and four-field techniques in different
clinical target volumes in prostate cancer irradiation using dose
volume histograms: a prospective three-dimensional analysis
A HILLE, MD, N TO¨ WS and C F HESS, PhD, MD
Department of Radiotherapy, University of Go¨ ttingen, Go¨ ttingen, Germany
ABSTRACT. The purpose of the current study was to quantitatively assess differences
between irradiation techniques on normal tissue exposure in different clinical target
volumes (CTVs) in irradiation of prostate cancer. 14 patients with prostate cancer
undergoing external beam radiotherapy were investigated. The prostate and prostate
+ proximal/entire seminal vesicles were delineated as CTVs. A three-field and two
different four-field plans were generated and compared concerning rectum, bladder
and femoral head dose–volume histograms (DVHs). The exposure of the rectum
exposed to 40–60 Gy was significantly lower for all CTVs with the three-field technique
compared with both four-field techniques. The exposure of the rectum to 70 Gy was
significantly lower for all CTVs with the weighted four-field technique compared with
the unweighted four-field and three-field techniques. The weighted four-field
technique was worst in bladder dose sparing for the three CTVs. Comparing the three-
field and the unweighted four-field technique for irradiation of the prostate and
prostate + entire seminal vesicles, no technique provided a clear advantage or
disadvantage in bladder dose sparing. For irradiation of the prostate + proximal
seminal vesicles the unweighted four-field technique provided the best bladder dose
sparing. Concerning the exposure of the femoral heads, the three-field technique was
significantly worse for the three CTVs compared with both four-field techniques. No
difference was found between the unweighted and the weighted four-field
techniques. In conclusion, none of the studied techniques consistently proved superior
in different CTVs in prostate cancer irradiation with respect to sparing all organs at risk.
The absolute differences between the three techniques were small and the clinical
relevance of these findings is uncertain.
Received 11 April 2005
Revised 10 June 2005
Accepted 21 June 2005
DOI: 10.1259/bjr/10206556
’ 2006 The British Institute of
Radiology
Three-dimensional (3D) conformal radiation treatment
with the use of individual multileaf collimators (MLCs)
has become the standard treatment technique for
localized prostate cancer [1–5]. The number of beams
and their orientation vary from one department to
another. The simplest techniques use three or four fields
[2, 4, 6–10], others use techniques with over five fields
[11, 12]. However, the published data do not indicate
that more sophisticated techniques increase the thera-
peutic index [13–19]. It is known that rectal toxicity
following external beam irradiation of prostate cancer
correlates with radiation dose and the percentage of
rectal volume included in the intermediate and high
dose-volumes [1, 4, 10, 12, 20]. Recently, the impact of
inclusion of the seminal vesicles in the clinical target
volume (CTV) on rectal dose has been recognized and a
risk-adapted CTV with exclusion of seminal vesicles or
inclusion of the proximal 2–2.5 cm of the seminal vesicles
was suggested to reduce the risk of rectal toxicity [21–
24].
Few studies compared different techniques concerning
irradiation of the prostate only [3, 14, 18], the prostate +
base of the seminal vesicles [19], or the prostate + entire
seminal vesicles [14–16]. These studies draw differing
conclusions concerning the best irradiation technique,
which may partly be due to different definitions of the
CTV in these studies. None of these studies investigated
systematically whether there is a difference between
techniques concerning irradiation of different CTVs of
the prostate.
The purpose of the current study was to quantitatively
assess the differences between a simple three-field and
two different four-field techniques on irradiated normal
tissue exposure in irradiation of the prostate only, the
prostate + proximal and the entire seminal vesicles. The
evaluation was based on three-dimensional treatment
planning including dose–volume histograms (DVH). To
our knowledge, this is the first prospective systematic
analysis for the effect of treatment technique on normal
tissue exposure concerning three different CTVs in
prostate cancer irradiation.
Methods and materials
14 consecutive patients with localized prostate cancer
stage T1–2 undergoing external beam radiotherapy with
Address correspondence to: Dr Andrea Hille, Klinik fu¨r
Strahlentherapie, Robert-Koch-Str. 40, 37075 Go¨ttingen, Germany.
The British Journal of Radiology, 79 (2006), 148–157
148 The British Journal of Radiology, February 2006](https://image.slidesharecdn.com/026britishjournalofradiology-britishinstituteofradiology-2006-130913065550-phpapp02/75/British-Journal-of-Radiology-British-Institute-of-Radiology-2006-eng-153-2048.jpg)
![curative intent to 72 Gy were investigated prospectively.
3D conformal computer-based planning was carried out
on CadPlan treatment planning system (Varian, Palo
Alto, CA). The prostate (P), the prostate + entire seminal
vesicles (PESV), or the prostate + proximal (PPSV) 2–
2.5 cm (approximately 60% in longitudinal direction) of
the seminal vesicles were taken as CTV and a planning
target volume (PTV) margin of 1 cm was added. The
definition of the proximal seminal vesicles was taken
from the literature [24]. The prostate, the entire and the
proximal seminal vesicles were delineated on each axial
slice on the planning computer. The external wall of the
rectum was contoured. The craniocaudal rectal extension
was defined as the first CT slice above the anal verge
(caudal border) and the cranial limit was defined as the
first slice below the sigmoid flexure. This definition is
consistent with definitions reported in the literature [7, 8,
15, 25]. The external wall of the bladder was contoured.
One planning CT scan (5 mm continuing, 5 mm slice)
was carried out with patients in supine position and a
comfortably filled bladder. Irradiation technique
included individual optimization with conformal treat-
ment planning and the use of individual blocks. Nine
plans were produced for each of the 14 patients.
Three different irradiation techniques using 20 MV
photons were evaluated.
(1) Four-field box technique with equally weighted
fields (so-called unweighted four-field technique for
simplification);
(2) Four-field box technique with unequal weighted
fields (so-called weighted four-field technique for
simplification);
(3) Three-field technique with one anterior and two
lateral fields with 90˚ and 270˚ wedges.
For technique 2 the weight of the ventral field versus
dorsal field was 1.3:0.7, and 1:1 for the lateral fields; for 3 it
was 1.3:0.85:0.85 with the highest weight for the anterior
field. For techniques 2 and 3, minor modification of the
beam weights were performed in order to homogenise the
dose distribution inside the PTV. Dose was specified
according to the ICRU 50 report [26]. For all techniques the
reference point for dose specification was the same. Dose
was specified at the centre of the treatment field in
projection of the central axes. Concerning dose homo-
geneity, at least 95% of the PTV was covered by 95% of the
prescribed dose as minimum. Field size was adjusted to
reach this dose homogeneity criterion. Dose calculation
included tissue density correction.
To determine the amount of the rectum exposed to
ionizing radiation, the percentage of the irradiated
rectum to 40 Gy, 50 Gy, 60 Gy and 70 Gy were calcu-
lated by the treatment planning system. Several investi-
gations indicate a relationship between DVHs and the
development of chronic rectal toxicity [1, 6, 7, 9, 10, 20,
27–31]. The rectal contouring varies from study to study
with some investigators outlining the whole rectum,
others the rectal wall. Concerning the rectal borders,
some studies outline the anatomic rectum, others the
rectum over the length of the fields. It is known that
there is a high variability of volume fractions of rectal
DVHs depending on how the rectal borders are defined,
and it is difficult to compare the results of different
studies concerning rectal DVHs [32, 33]. Studies analys-
ing either dose–volume relationships of the rectum with
or without the craniocaudal definition which we have
used in our study, or studies using an identical or similar
craniocaudal definition of the whole rectum, are sum-
marized in Table 1. The above mentioned values were
chosen following the rectal dose constraints given in
these publications [6–8, 27–31].
To determine the amount of the bladder exposed to
ionizing radiation, the volume of V100 (defined as the
percentage of bladder volume receiving 100% of the
prescribed dose) and the percentage of the irradiated
bladder to 40 Gy, 50 Gy, 60 Gy, 65 Gy and 70 Gy were
calculated by the treatment planning system. The data on
the tolerance of the bladder to radiation as a function of
the irradiated volume is limited. This may be due to a
large variation in the bladder DVHs when considering
the modifications of the organ due to different filling [9].
The above mentioned values were chosen following the
data in the literature about a relationship between
bladder toxicity and the irradiated bladder volume [4,
34–37]. The incidence of acute bladder toxicity increased
when more than 30% of the bladder received more than
65 Gy [4, 34, 35]. Late complications, such as bladder
contracture and volume loss, are described in 5% to 10%
at doses of 40 Gy delivered to the majority of the
bladder, at doses of 50–65 Gy delivered to about 30%
of the bladder volume and at doses of 65–75 Gy applied
to below 20% of the bladder volume [36]. Emami et al
estimated the TD5/5 to 65 Gy irradiated to the whole
bladder, and 66% of the bladder volume irradiated to
80 Gy [37].
To determine the amount of the femoral heads
exposed to ionizing radiation the volume of V50 and
V100 (defined as the percentage of femoral head volumes
receiving at least 50% and 100% of the prescribed dose)
were calculated by the treatment planning system. The
available data on the dose–effect relationship for femoral
heads are also limited [37, 38]. The clearest proposal is
that of Emami et al who indicated that a dose of 52 Gy
can be given to the whole femoral head with a risk for
chronic toxicity in 5 years to be 5%. The V100 value was
chosen following Emami et al’s study. However, the dose
to the whole femoral head is always lower than 52 Gy in
practice. Therefore, we additionally estimated the V50
value.
Statistical analysis
Analysis was performed using the program
STATISTICA 6.1 (Stat Soft, Palo Alto, CA). To evaluate
the statistical significance of differences, Friedman’s
ANOVA was performed followed by Wilcoxon matched
pairs test. Closure principle was used for multiple tests.
The level chosen for significance was .0.05.
Results
PTV
The dose distributions in the PTV for all three CTVs
were between 99.8% and 102% and typical standard
Treatment techniques in prostate cancer irradiation
The British Journal of Radiology, February 2006 149](https://image.slidesharecdn.com/026britishjournalofradiology-britishinstituteofradiology-2006-130913065550-phpapp02/75/British-Journal-of-Radiology-British-Institute-of-Radiology-2006-eng-154-2048.jpg)
![deviations ranged from 1% to 2.5% for all patients and all
considered CTVs and techniques.
No statistically significant differences were found
between the three techniques for all three CTVs.
Rectum volume
The median volume of the rectum was 84 cm3
(mean
value 90 cm3
, standard deviation 31 cm3
).
Exposure of the rectum with different techniques
The exposure of the rectum to 40–60 Gy was sig-
nificantly lower for all CTVs with the three-field
technique compared with both four-field techniques.
The exposure of the rectum to 70 Gy was significantly
lower for all CTVs with the weighted four-field
technique compared with the unweighted four-field
and three-field techniques.
The differences between the rectal volume receiving
40 Gy, 50 Gy, 60 Gy and 70 Gy, respectively, were
significant for all three CTVs between the three-field
technique and both four-field techniques, and between
both four-field techniques.
Details are demonstrated in Table 2. The values of
40 Gy, 50 Gy, 60 Gy and 70 Gy for all three techniques
are demonstrated graphically for the prostate only in
Figure 1, for the PPSV in Figure 2 and for the PESV in
Figure 3.
Bladder volume
The median bladder volume was 154 cm3
(mean value
146 cm3
, standard deviation 40 cm3
).
Exposure of the bladder with different techniques
P
The bladder volume receiving 50 Gy, 60 Gy and
65 Gy, respectively, was significantly higher with the
weighted four-field technique compared with both
the unweighted four-field and the three-field techniques.
The bladder volume receiving 40 Gy was significantly
lower with the unweighted four-field technique com-
pared with the weighted four-field technique. No
significant difference was found in the bladder volume
receiving 40 Gy, 50 Gy, 60 Gy, 65 Gy and 70 Gy,
Table 1. Relationship between dose–volume and late rectal toxicity reported in the literature
Authors Craniocaudal definition
of the whole rectum
Rectal
volume (%)
Rectal
dose (Gy)
Risk for chronic
rectal
bleeding (%)
Toxicity
grade
Used
toxicity
score
Median
follow up
Cozzarini [6] Anal verge to the sigmoid
flexure (patients with large
air/faecal content in the rectum
were excluded from analysis)
¢ 52
, 63
¢ 39
, 39
50
50
60
60
14
6.6
13.3
7
¢ 2 RTOG 3 years
Fiorino [7] Anal verge to the sigmoid
flexure (patients with large
air/faecal content in the rectum
were excluded from analysis)
50
50
60
60
70
70
. 53
, 53
. 42
, 42
. 22
, 22
14.2
4.3
14
5.2
12.9
6.3
¢ 2 RTOG 30
months
Fiorino [8] Anal verge to the sigmoid
flexure (patients with large
air/faecal content in the rectum
were excluded from analysis)
50
50
60
60
70
70
. 53
, 53
. 42
, 42
. 22
, 22
14.2
4
14
5
13
6
¢ 2 RTOG 2 years
Greco [27] Anal verge to the sigmoid flexure . 65 40 18 ¢ 2 RTOG 28
months
, 65 40 0
. 30 60 18
, 30 60 0
. 25 70 18
, 25 70 0
Huang [28] 11 cm in length starting at 2 cm
below the inferiormost aspect
of the ischial tuberositas
. 26
, 26
70
70
54
13
¢ 2 RTOG/
LENT-SOMA
6 years
Wachter [29] From the lower to the upper
border of the fields
¢ 57
, 57
60
60
31
11
2 RTOG/
EORTC
30
months
Zapatero [30] Anus to the sigmoid flexure . 42 . 60 7.7 ¢ 2 RTOG 4 years
, 42 , 60 0
Storey [31] Rectum was identified with
rectal contrast
. 25
, 25
. 30
, 30
70
70
¢ 70
¢ 70
37
13
40
¢ 2
¢ 2
3
3
RTOG/
LENT-SOMA
2 years
A Hille, N To¨ ws and C F Hess
150 The British Journal of Radiology, February 2006](https://image.slidesharecdn.com/026britishjournalofradiology-britishinstituteofradiology-2006-130913065550-phpapp02/75/British-Journal-of-Radiology-British-Institute-of-Radiology-2006-eng-155-2048.jpg)

![found between the unweighted four-field and the
weighted four-field techniques. Concerning the V100
values no significant difference was found for all CTVs
between the different techniques.
Discussion
Our study shows that none of the studied three-field and
four-field techniques consistently proved superior in
irradiation of the prostate, prostate + proximal seminal
vesicles and prostate + entire seminal vesicles with respect
to sparing all organs at risk. Published data do not indicate
that more sophisticated techniques increase the therapeutic
index [13–19]. Techniques with more than five fields have a
very high burden for daily routine treatment planning, and
an optimal radiation technique should not only provide the
best sparing for all organs at risk (rectum, bladder, femoral
heads), but also be safely implemented without undue
burden and reduce the risk of any error. For example,
simple, and therefore safe, verification by portal imaging
during radiation treatment is given with simple radiation
fields. For these reasons, a study, investigating only simple
radiation techniques was performed.
Figure 2. Mean values, standard
error and standard deviations (SD)
for the rectum exposed to 40–70 Gy
in irradiation of the prostate +
proximal seminal vesicles with
different treatment techniques.
Figure 1. Mean values, standard
error and standard deviations (SD)
for the rectum exposed to 40–70 Gy
in irradiation of the prostate only
with different treatment
techniques.
A Hille, N To¨ ws and C F Hess
152 The British Journal of Radiology, February 2006](https://image.slidesharecdn.com/026britishjournalofradiology-britishinstituteofradiology-2006-130913065550-phpapp02/75/British-Journal-of-Radiology-British-Institute-of-Radiology-2006-eng-157-2048.jpg)
![P
Bedford et al [14] concluded that for irradiation of the
prostate only a four-field technique with two oblique
anterior and lateral fields would be optimal for rectal
sparing. Koswig et al [3] found that, for irradiation of the
prostate, only, the best rectal sparing was with a six-field
technique. Khoo et al [16] concluded for prostate
irradiation, a three-field technique would bring the best
rectal sparing with acceptable bladder and femoral head
doses. They performed plans with 6 MV photons. We
compared in our study a three-field technique with two
different four-field techniques using 20 MV photons and
the results of Khoo et al [16] concerning rectal dose
sparing can be confirmed by our results. Another
recently published study investigated three-field techni-
ques versus four-field techniques in irradiation of the
prostate only and found that the three-field technique
using an anterior and two lateral (270˚ and 90˚) fields
with 20 MV photons provides the best rectal protection
[18]. This can also be confirmed by our results. The
recent study mentioned found no difference between the
techniques in bladder exposure and discussed that this
may be due to the CTV (prostate only) [18]. Our data
indicate that the three-field technique provides, for
irradiation of the prostate only, the best rectal dose
sparing with no significant differences in bladder dose
sparing compared with the unweighted four-field
technique. The weighted four-field technique was worst
in bladder dose sparing. Concerning the femoral head
doses, the three-field technique was worst.
PPSV
Neal et al compared a three-field, four-field and six-
field technique for irradiation of the prostate + the base
of seminal vesicles [19]. They found no significant
differences considering the irradiated volume of the
bladder and the rectum. However, they found a better
sparing of the rectum with a weighted four-field
technique and a better sparing of the bladder with the
six-field technique. Our data indicate for irradiation of
the prostate + proximal seminal vesicles the three-field
technique to be optimum in rectal dose sparing. The
weighted four-field technique was worst in bladder dose
sparing and the unweighted four-field technique pro-
vided a better sparing of the rectum compared with the
three-field technique. Concerning the femoral head
doses, the three-field technique was worst.
PESV
For irradiation of the prostate + seminal vesicles,
several authors compared different techniques and all of
these studies conclude that no single technique is
superior when considering all organs at risk (rectum,
bladder, femoral head). Fiorino et al compared various
coplanar techniques for conformal irradiation of the
prostate and seminal vesicles [15]. A three-field techni-
que with an anteroposterior and two lateral 30˚ wedged
fields gave the best sparing of the rectum. The bladder
was best spared with a six-field technique. The mean
dose of the bladder was significantly better against the
three-field technique and the four-field technique.
However, considering V95, no significant difference
was found between the techniques. The unweighted
four-field technique gave the worst sparing of the
bladder for Fiorino et al. In our study, the weighted
four-field technique gave the worst sparing of the
bladder.
Bedford et al [14] compared various four-field techni-
ques with a three-field technique which had lateral
oblique fields. They concluded that for irradiation of the
prostate and prostate + seminal vesicles, four-field
techniques with two oblique anterior and lateral fields
with individual field wedges for the different CTVs to be
Figure 3. Mean values, standard
error and standard deviations (SD)
for the volumes 50 Gy, 60 Gy and
65 Gy of the rectum in case of
irradiation of the prostate + entire
seminal vesicles with different
treatment techniques.
Treatment techniques in prostate cancer irradiation
The British Journal of Radiology, February 2006 153](https://image.slidesharecdn.com/026britishjournalofradiology-britishinstituteofradiology-2006-130913065550-phpapp02/75/British-Journal-of-Radiology-British-Institute-of-Radiology-2006-eng-158-2048.jpg)

![optimal for rectal sparing. However, such a technique
has a very high burden for daily routine treatment
planning. The simple three-field plan in this study with
an anterior and two lateral fields using 6 MV photons
showed a comparable level with the four-field technique
in rectal dose sparing, in case of irradiation of the
prostate + entire seminal vesicles. However, the dose to
the superficial body and femoral heads was found to be
very high [14]. Khoo [16] concluded for both the prostate
and seminal vesicles irradiation a three-field technique
would bring the best rectal dose sparing with acceptable
bladder and femoral head doses. They performed plans
with 6 MV photons also, but the superficial body dose
was not mentioned. In our study, we compared a three-
field technique with two different four-field techniques
using 20 MV photons, and the results of Khoo et al [16]
concerning rectal dose sparing can be confirmed by our
results. The weighted four-field technique was worst in
bladder dose sparing. Comparing the unweighted four-
field with the three-field technique in bladder dose
sparing, no clear advantages or disadvantages were
found. Concerning the femoral head doses, the three-
field technique was worst.
The studies investigating various techniques draw
differing conclusions concerning the best irradiation
technique. Some studies, comparing four and three-field
techniques concluded the three-field technique to be best
in rectal dose sparing [16, 18]. Others did not confirm
these results [14, 19]. The reasons for these differing
findings are unclear; PTV margins and PTV coverage
which have both an impact on radiation exposure of the
organs at risk were comparable among these studies and
comparable with our study. The different CTVs in theses
studies could have been responsible for the different
findings, but our study shows for all three CTVs the best
rectal dose sparing with the three-field technique.
Concerning the bladder dose, the differing conclusions
may be due to different bladder fillings which is known
to have an impact on bladder DVHs [9]. In most of the
studies, only few endpoints concerning dose volume
histograms had been chosen and the investigated points
were not associated with doses given in dose-constraint
studies. Analysing many dose endpoints, as we have
done in our study, can lead to unclear, or even
conflicting results. This could be an explanation for the
differing results compared with our study.
Although the differences between the three techniques
were small in our study they were significant, and we
conclude from our data that a three-field technique
provided the best rectal but the worst femoral dose
sparing with inconsistent results regarding the bladder
dose sparing for all three CTVs.
Estimated risk for chronic normal tissue exposure
Rectum
To associate the rectal DVHs in our study with an
estimated risk for chronic rectal toxicity, the results were
compared with studies analysing relationships between
dose–volume and rectal toxicity (Table 1).
Although the definitions of the rectum differ in some
of these studies from our definition, and although the
cut-off levels and the resulting risks for chronic rectal
toxicity ¢ grade 2 also differ in these studies, we can
draw cautious conclusions from our results regarding an
estimated risk for chronic rectal toxicity.
The obtained values from the three different techni-
ques were close together. In patients treated with
irradiation of the prostate only, the values for the rectum
exposure were below 5% for chronic rectal bleeding ¢
grade 2; for irradiation of the prostate + proximal
seminal vesicles between 5% and 15%; and for irradia-
tion of the prostate + entire seminal vesicles over 15%
with all three techniques. Nevertheless, the three-field
technique provided the best rectal dose sparing, except
for the rectal volume exposed to 70 Gy. The weighted
four-field technique provided a significantly better rectal
dose sparing than the unweighted four-field technique.
Whether the small differences between the various
techniques would have an impact on chronic rectal
toxicity is uncertain. Furthermore, published data sug-
gest increased local control with lower normal toxicity
with new technologies such as intensity modulated
radiation therapy (IMRT) [39–42]. IMRT allows the
increase of dose in part of the prostate while continuing
to protect normal tissue. However, until new technolo-
gies such as IMRT are introduced as a widespread
clinical routine treatment, 3D conformal radiation ther-
apy should be optimized to reduce toxicity while
inreasing local control.
Bladder
To estimate the risk for bladder toxicity we tried to
compare our data with the clinical relationship between
DVHs and the development of bladder toxicity, as
reported in the literature [4, 34–37].
The exposed bladder volumes in our study were
similar with the three different techniques. The risk of
chronic bladder toxicity in our study can be estimated to
be less than 5% to 10% in irradiation of the prostate only
with all three techniques. In irradiation of the prostate +
proximal/entire seminal vesicles, the risk for chronic
toxicity can be estimated to be above 10% with all three
techniques. For all three CTVs the weighted four-field
technique provided the worst bladder dose sparing.
Whether the small differences between the various
techniques would have an impact on chronic bladder
toxicity is uncertain.
Femoral heads
The three-field technique provided the worst radiation
exposure to the femoral heads. The differences for the
V50 value were significant; for the V100 value no
significant difference was found between the techniques
for all three CTVs. As the values for the three techniques
were below 52 Gy to the whole femoral heads, the risk of
chronic toxicity can be estimated to be below 5% in
5 years for the three CTVs [41].
Conclusion
In conclusion, none of the studied techniques consis-
tently proved superior in different CTVs in prostate
cancer irradiation with respect to sparing all the organs
Treatment techniques in prostate cancer irradiation
The British Journal of Radiology, February 2006 155](https://image.slidesharecdn.com/026britishjournalofradiology-britishinstituteofradiology-2006-130913065550-phpapp02/75/British-Journal-of-Radiology-British-Institute-of-Radiology-2006-eng-160-2048.jpg)


![SHORT COMMUNICATION
A comparative evaluation of two head and neck immobilization
devices using electronic portal imaging
1
K DONATO, BSc (Hon), 1
K LESZCZYNSKI, PhD, FCCPM and 2
K FLEMING, MHSc, MRT(T)
1
Northeastern Ontario Regional Cancer Centre, Hoˆ pital re´gional de Sudbury Regional Hospital, 41
Ramsey Lake Road, Sudbury, Ontario, P3E 5J1 and 2
Grand River Regional Cancer Centre, 835 King
Street West, Kitchener, Ontario, N2G 1G3, Canada
ABSTRACT. A study was performed to compare the positioning reproducibility and the
cost efficiency for two head and neck immobilization devices: the Uvex’
(Uvex Safety,
Smithfield, USA) plastic mask system and the Finesse Frame with Ultraplast System’
(PLANET Medical, Svendborg, Denmark). 20 patients treated with 3D conformal
radiation therapy for head and neck cancers were randomly selected (10 for each of the
two different immobilization systems) and electronic portal images acquired during
their course of treatment were saved and used in this study. The anatomical landmark
coordinates and their shifts in the anteroposterior (AP) and craniocaudal (CC) directions
with respect to the digitized simulator films for lateral fields were analysed using an in-
house developed portal image registration system. Statistically, no evidence was found
to indicate that the systematic components of the displacement for the Uvex’
system
and the Finesse Frame with Ultraplast System’
were different from each other or from
zero. The random component of displacement was slightly smaller in the AP direction
for the Uvex’
than the Ultraplast’
system (s51.9 mm and 2.9 mm, respectively,
p50.007), but larger in the CC direction (s53.8 mm and 2.2 mm, respectively, p,1029
).
Production time and required materials for a radiation therapy department were also
quantified to assess costs for each system. The overall costs per patient were estimated
at $141.50 (CAD) and $82.10 for the Uvex’
and Ultraplast’
systems, respectively. The
Finesse Frame with Ultraplast System’
of immobilization for head and neck cancer
treatment provides a field placement reproducibility that is equal to, or greater than,
that of the Uvex’
plastic mask immobilization system and, while it requires more
expensive materials, the workload and consequently overall cost is greatly reduced.
Received 16 March 2005
Revised 27 June 2005
Accepted 8 August 2005
DOI: 10.1259/bjr/32191494
’ 2006 The British Institute of
Radiology
Radiation treatment to the head and neck region is
delivered with accurate and precise placement of pre-
scribed portal fields. Reproducible alignment is increas-
ingly important as we apply high-dose three-dimensional
conformal radiation therapy (3D-CRT) techniques and
intensity-modulated radiation therapy (IMRT) in conjunc-
tion with the need for smaller clinical target volume (CTV)
margins. The consequences of field placement errors have
been described in various publications; failure to treat the
entire planning target volume (PTV) may be responsible
for local failure, and irradiation outside of the PTV may
result in normal tissue complications to important organs
[1–4], such as the spinal cord or the eye, in the case of head
and neck cancers. In order to increase the reproducibility
of portal field placement, various immobilization devices
are used to stabilize the position of the patient’s head
while treatment is delivered.
Previous publications have compared two or three
different systems of immobilization [5–7], and have
assessed treatment field position reproducibility with
similar results: the standard deviations of field place-
ment errors, s, were found to be between 1.7 mm and
3.3 mm, for both anteroposterior (AP) and craniocaudal
(CC) directions. In this study, an immobilization system
involving a Uvex’
(Uvex Safety, Smithfield, USA) plastic
mask was compared with a low temperature thermo-
plastic mask system, the Finesse Frame with Ultraplast
system’
(PLANET Medical, Svendborg, Denmark) using
off-line electronic portal imaging. The costs of both
systems in terms of production time and materials were
also calculated since the clinical introduction of a low
temperature thermoplastic mask appears to be less time-
consuming, less costly, and more convenient for the
patient [7] and, therefore, beneficial in general.
Materials and methods
Clinical setup
This study retrospectively selected 20 consecutive
head and neck patients treated at our centre betweenAddress correspondence to: K Leszczynski.
The British Journal of Radiology, 79 (2006), 158–161
158 The British Journal of Radiology, February 2006](https://image.slidesharecdn.com/026britishjournalofradiology-britishinstituteofradiology-2006-130913065550-phpapp02/75/British-Journal-of-Radiology-British-Institute-of-Radiology-2006-eng-163-2048.jpg)
![April 2001 and September 2001. These patients were
randomly drawn from two groups representing different
immobilization devices used in treatment setup; 10
patients with a Uvex’
mask system, and 10 patients
with a FinesseFrame with Ultraplast System’
. A sum-
mary of selected demographic data for both immobiliza-
tion groups is provided in Table 1. Review of the
summary confirms that there was no apparent signifi-
cant demographical bias between the groups. One
patient’s results were eliminated from the study due to
poor quality imaging. All patients attended the Mevasim
simulator (Siemens Medical Solutions, Concord, USA)
where lateral portal positioning was marked on the mask
for alignment purposes. A planning CT scan using
Somatom Plus (Siemens Medical Solutions) was per-
formed at 5 mm intervals for 3D conformal treatment
planning on the Helax TMS system (Nucletron B.V.,
Veenendaal, The Netherlands), and all patients were
treated on a Mevatron KD-2 or Primus linear accelerator
(Siemens Medical Solutions) with 6 MV beams. The
treatment beam arrangement consisted of two parallel
opposed lateral fields covering the head and neck target.
The nodes in the supraclavicular region were irradiated
with an anterior field. Portal images were acquired and
stored for daily fractions using Beamview Plus’
(Siemens Medical Solutions) video camera based electro-
nic portal imaging. For the purpose of this study, only
right lateral portal views were used. An average of 14
(range 9–19) portal images for each patient were
acquired for a total retrospective analysis of 272 images.
Immobilization devices
Two different thermoplastic masks and their respective
immobilization accessories were evaluated in this study.
To form the Uvex’
mask, two radiation therapists stabilize
the patient’s head on a Timo head rest and form a plaster
impression of the patient’s head and neck. One therapist
later drapes the negative impression and fills it to form a
positive impression. The 1/160 Uvex’
plastic is then
heated in a vacuum former and then moulded around
the plaster positive. The patient returns approximately 2
days later for the fitting process where the plastic mask is
fitted directly onto the patient’s head and neck and
mounted onto a Perspex’
(Lucite International Canada
Inc., Mississauga, Canada) acrylic headboard at three
fixation points on each side of the head (six fixation points
in total, distributed evenly from the lower neck to the top
of the head). The treatment field area is cut from the Uvex’
mask once a radiation oncologist approves the first-day
portal image in order to allow for increased skin sparing.
To form the Ultraplast’
mask, the Ultraplast’
material
is dipped into a hot water bath (75˚C) while the patient
is positioned on a Silverman head rest that attaches to a
‘‘Quick Snap and Lock’’ carbon fibre headboard by a
Finesse Frame system’
which is fixed at three points (at
the top and on either side of the head). Two therapists
then stretch the material and mould the mask directly
onto the head of the patient. After approximately 8 min,
the mask has hardened. The field area is not cut out from
the Ultraplast’
masks since they offer better skin sparing
than the Uvex’
masks [8] and, while reducing the dose in
the first few millimetres of skin, field cutouts may affect
positioning reproducibility [9].
Image analysis
Right lateral portal images were captured using the
Beamview Plus’
portal imaging system. These images
were then imported into a Portal ViewStation software
system developed in-house [10]. Corresponding simulator
films were digitized and imported into the Portal
ViewStation system. While the field borders of the
simulator films were defined manually, the field borders
of the portal images were extracted automatically by
applying an edge detection algorithm [11]. Adaptive
histogram equalization [12] was applied to the portal film
in order to enhance contrast. Two experienced radio-
therapists delineated bony landmarks (the vertebrae) on
both the simulator film and all portal images. The portal
images were transformed onto the simulator film coordi-
nate system and, using the chamfer matching registration
algorithm [13, 14], the corresponding anatomical land-
marks were aligned. Next, the borders of the simulated
field were matched with the borders of the portal images
by applying a polygon-matching algorithm [15] and the
displacement between the simulator film treatment field
borders and the portal image borders was recorded and
analysed to determine the translational field placement
error in the AP and CC directions, as well as the rotational
error measured in the plane orthogonal to the lateral beam.
The accuracy of the field placement measurement
method was previously assessed to be within 1.5 mm
and 1˚ for translational and rotational displacements,
respectively [10].
Statistical analysis
The reproducibility of treatment field placement is
reflected by a combination of both systematic and
random error. The systematic placement error for one
patient is that component of the field displacement that
was constant throughout the treatment period and can,
therefore, quantify the accuracy of patient positioning.
This error is defined as the mean of all displacements in
either the AP or CC direction. The random error, or the
precision with which the patient is positioned daily, is
Table 1. A summary of selected demographic data for
patients included in both immobilization groups
Demographics Immobilization device group
Uvex Ultraplast
Age: mean¡SD 65¡10 60¡11
Sex: Females/Males2/8 1/9
Diagnosis
distribution
Ca tongue – 4
Ca tonsil –2
Ca supraglottis – 2
Ca floor of mouth – 2
Ca hypopharynx – 1Ca tongue –1
Ca pharynx – 1 Ca oropharynx – 1
Ca oral cavity – 1 Ca gingiva – 1
Ca larynx –1 Ca glottis –1
Unknown primary – 2
Weight change
during
treatment:
Mean¡SD
4.8¡3.6 3.4¡5.7
Short communication: An evolution of two head and neck immobilization devices
The British Journal of Radiology, February 2006 159](https://image.slidesharecdn.com/026britishjournalofradiology-britishinstituteofradiology-2006-130913065550-phpapp02/75/British-Journal-of-Radiology-British-Institute-of-Radiology-2006-eng-164-2048.jpg)
![determined by subtracting the systematic displacement
from the total displacement for one fraction. For the
Uvex’
or Ultraplast’
group, the systematic error is
quantified by the range and standard deviation of the
mean field displacements for all individuals and the
random error for the group is the standard deviation of
all individual random errors.
Cost calculations
The average time of mask production was determined
by taking an average for the production of five masks of
each type. The production time included patient educa-
tion, mask production and, for the Uvex’
masks, time
spent in plastering the positive mould. The mid-range
salary rate for a Radiation Therapist at the Northeastern
Ontario Regional Cancer Centre was multiplied by the
time of production. In 2004, the salary range for radiation
therapists was between $48 750 and $67 500 (CAD) per
annum, therefore, the average salary of $58 125 was used
in this analysis. Full-time employees working 37.5 h per
week, work an average of 1950 h per year, resulting in a
cost per minute of $0.50 (CAD).
The total non-reusable materials costs were assessed
for masks of each type and the cost of materials for 10
masks was added to the labour cost for 10 masks of that
type. An approximate yearly cost was also calculated for
both the Uvex’
and Ultraplast’
immobilization systems.
Results
Patient reproducibility
Whether immobilized with a Uvex’
mask system or a
Finesse Frame with Ultraplast System’
, no difference in
the accuracy with which the patients were placed in
position for treatment (or systematic error) was detected.
A t-test applied to the magnitudes of systematic errors
measured in both groups yielded p.0.2 for translational
and rotational errors. For both immobilization systems,
using a Z-test, the average systematic errors were not
statistically different from zero (p.0.2 for translations in
AP and CC directions, and also for rotations). For the
Uvex’
mask system, the range of systematic errors was
[22.8, 4.4] mm in the AP direction with a standard
deviation of 2.6 mm, [22.3, 3.2] mm in the CC direction
with a standard deviation of 1.6 mm, and [21.7˚, 2.7˚] in
rotation with a standard deviation of 1.3˚. For the
Ultraplast’
mask system, the range of systematic errors
was [22.5, 2.7] mm in the AP direction with a standard
deviation of 1.9 mm, [23.6, 2.8] mm in the CC direction
with a standard deviation of 1.8 mm, and [23.6˚, 2.1˚] in
rotation with a standard deviation of 1.6˚ (Table 2).
There was, however, a difference in the random error, or
the precision, in field positioning for the two immobiliza-
tion setup systems: for the Uvex’
mask system, the
standard deviation of the random error in the AP direction
was found to be 1.9 mm compared with 2.3 mm for the
Finesse Frame with Ultraplast System’
(p50.007) while in
the CC direction, the standard deviation of the random
error for the Uvex’
mask system was 3.8 mm compared
with 2.2 mm for the Finesse Frame with Ultraplast
System’
(p,1029
). The standard deviations of the random
error in rotation were 1.8˚ and 2.1˚ for the Uvex’
and
Ultraplast System’
mask immobilizations, respectively,
and the difference was not statistically significant (p.0.05).
The frequency of translational field placement errors
larger than 5 mm was 11% for Uvex’
mask systems
and 8% for Finesse Frame with Ultraplast Systems’
in
the AP direction and was 8% for Uvex’
mask systems
and 5% for Finesse Frame with Ultraplast Systems’
in
the CC direction.
Costs
The average time taken by a radiation therapist to
produce a Uvex’
mask was 134 min. This time measure-
ment included patient contact as well as the production
of a plaster positive and vacuum-forming the mask. The
average time spent by a second radiation therapist was
47 min for the patient impression and mask fitting. The
total time was therefore 181 min, at a cost of $90.50
(CAD) per patient for labour alone.
The average time taken by a radiation therapist to
produce an Ultraplast’
mask, including room prepara-
tion and patient education, was 23.7 min. A second
radiation therapist spent an average time of 18.7 min
assisting with the production of the mask. The total time
was therefore 42.4 min, or a cost of $21.20 (CAD) per
patient for labour alone.
The cost of mask materials, excluding start-up costs,
base plates, or head rests, was $510 CAD for 10 Uvex’
masks and $609 CAD for 10 Ultraplast’
masks.
Therefore, the total materials and labour costs for the 10
Uvex’
masks were $1415.00 (CAD) and $821.00 (CAD) for
the 10 Ultraplast’
masks. At the NEORCC, there are
approximately 92 patients requiring immobilization
masks per year. At a cost difference per patient of $59.40
(CAD), the total cost difference per year is $5464.80 (CAD)
in favour of the Finesse Frame with Ultraplast System’
.
Discussion
Setup reproducibility
With the use of IMRT for treatment of head and neck
cancers, it is highly desirable to outline smaller margins
Table 2. Systematic and random errors for Uvex’
and Ultraplast’
immobilization systems
Anteroposterior Craniocaudal Rotational
Mask Type
Systematic (S) or
Random (R)
SD (mm) Positioning error
.5 mm
SD (mm) Positioning error
.5 mm
SD ( ˚)
Uvex S 2.6 16 (11%) 1.6 11 (8%) 1.3
R 1.9 3.8 1.8
Ultraplast S 1.9 11 (8%) 1.8 6 (5%) 1.6
R 2.3 2.2 2.1
K Donato, K Leszczynski and K Fleming
160 The British Journal of Radiology, February 2006](https://image.slidesharecdn.com/026britishjournalofradiology-britishinstituteofradiology-2006-130913065550-phpapp02/75/British-Journal-of-Radiology-British-Institute-of-Radiology-2006-eng-165-2048.jpg)
![that are added to the CTV and, thus, to more effectively
avoid normal tissue complications while still increasing
the total dose to the PTV in order to gain local control of
the tumour. Effective immobilization of the area to be
treated is essential for accurate and precise delivery of the
treatmentplan anddose prescription.While thesystematic
component of field placement error is primarily due to the
transfer of patient setup from treatment planning to
delivery, any mispositioning or moving of the patient
within the mask may cause the random component of
error.
The systematic component of error for both the Uvex’
and Ultraplast’
mask systems was less than 3 mm (1 SD)
for both the AP and CC directions of motion. This value
is consistent with previous studies [6, 17, 18] indicating
that the patient setup errors are often determined by
transfer errors from the simulator to the treatment unit
and are not necessarily affected by mask type.
In other publications, the use of thermoplastic masks, as
opposed to masks made of other materials such as plastics
or polycarbonate, appears to result in a comparable
random error [5, 7]. In this study, it was determined that
a decrease in random field placement error in the CC
direction by using the Finesse Frame with Ultraplast
system’
could be clinically significant since, according to
the formula used by Stroom et al [16], the CTV-PTV margin
may be reduced by 1.1 mm in the CC direction. It is not
apparent, however, whether this improvement in field
placement in the CC direction is due to the rigidity of the
thermoplastic mask material or the fixation of the head and
neck in the Finesse Frame’
which has a fixation point at the
vertex of the head. Since the random component of
displacement in the AP direction was actually slightly
smallerfortheUvex’
system,thereisnoclearevidencethat
our practice of cutting out the treatment field area from
Uvex’
masks for better skin sparing, had a significant
detrimental influence on the rigidity of immobilization.
There also appear to be fewer field placement errors
larger than 5 mm with the use of the Finesse Frame with
Ultraplast System’
. This may be attributed to a better fit
to the patient’s anatomy since the Ultraplast’
material
can be fitted directly onto the patient and there is no
intermediary cast necessary. The Finesse Frame with
Ultraplast System’
provides equal, or perhaps better,
immobilization for head and neck cancer radiation
treatment.
While the costs of materials for the Finesse Frame with
Ultraplast System’
are initially higher than those for the
Uvex’
mask and accessories, the increased time commit-
ment required to produce the Uvex’
masks and the
corresponding labour costs, in addition to the inconve-
nience for the patient of having to attend a mould room
fitting twice, make the Finesse Frame with Ultraplast
System’
a preferable option for a radiation therapy
department.
Conclusion
The Finesse Frame with Ultraplast system’ of immo-
bilization for head and neck cancer treatment provides a
field placement reproducibility that is equal to, or greater
than, that of the Uvex’ plastic mask immobilization
system. The Ultraplast’ system is also cheaper and more
time-efficient, making it a superior product for use in a
radiation therapy department.
Acknowledgments
We are grateful to Louise Beausoleil, Susan Boyko,
Scott Cosby and Janice O’Brien, as well as all the
Radiation Therapy Program staff who provided assis-
tance to this study.
References
1. Bentel G, Marks L, Hendren K, et al. Comparison of two
head and neck immobilization systems. Int J Radiat Oncol
Biol Phys 1997;38:867–73.
2. Bentel G, Marks L, Sherouse G, et al. A customized head
and neck support system. Int J Radiat Oncol Biol Phys
1995;32:245–8.
3. Goitein M. Calculation of the uncertainty in the dose
delivered to the patient. Med Phys 1985;12:606–12.
4. Goitein M, Busse J. Immobilization errors: Some theoretical
considerations. Radiology 1975;117:407–12.
5. Weltens C, Kesteloot K, Vandevelde G, Van Den Bogaert W.
Comparison of Plastic and Orfit’ masks for patient head
fixation during radiotherapy: Precision and costs. Int J
Radiat Oncol Biol Phys 1995;33:499–507.
6. Gilbeau L, Octave-Prignot M, Loncol T, Renard L, Scalliet P,
Gregoire V. Comparison of setup accuracy of three different
thermoplastic masks for the treatment of brain and head
and neck tumors. Radiother Oncol 2001;58:155–62.
7. Lord L, May S, Bailey M, Smith L. Is one head and neck
immobilization system as good as another? One center’s
experience. Med Dosim 2003;28:39–43.
8. Carl J, Vestergaard A. Skin damage probabilities using
fixation materials in high-energy photon beams. Radiother
Oncol 2000;55:191–8.
9. Halm E, Tamri A, Bridier A, Wibault P, Eschwege F.
Influence of thermoplastic masks on absorbed skin dose for
head and neck radiotherapy. Cancer Radiother
2002;6:310–9.
10. Leszczynski K, Loose S, Boyko S. An image registration
scheme applied to verification of radiation therapy. Br J
Radiol 1998;71:413–26.
11. Leszczynski K, Shalev S, Cosby S. The enhancement of
radiotherapy verification images by an automated edge
detection technique. Med Phys 1992;19:611–21.
12. Leszczynski K, Shalev S. Digital contrast enhancement for
on-line portal imaging. Med Biol Eng Comput
1989;27:507–12.
13. Leszczynski K, Loose S, Dunscombe P. Segmented chamfer
matching for prescription-treatment image registration in
radiotherapy. Phys Med Biol 1995;40:83–94.
14. Borgefors G. Hierarchical chamfer matching: a parametric
edge matching algorithm. IEEE Trans Pattern Anal Mach
Intell 1988;10:849–65.
15. Leszczynski K, Loose S. A polygon matching algorithm and
its applications to verification of radiation field placement
in radiotherapy. Int J Biomed Comput 1995;40:59–67.
16. Stroom JC, de Boer HC, Huizenga H, et al. Inclusion of
geometrical uncertainties in radiotherapy treatment plan-
ning by means of coverage probability. Int J Radiat Oncol
Biol Phys 1999;43:905–19.
17. Bel A, Keus R, Vijlbrief R, Lebesque J. Setup deviations in
wedged pair irradiation of parotid gland and tonsillar
tumors, measured with an electronic portal imaging device.
Radiother Oncol 1995;37:153–9.
18. Gildersleve J, Dearnaley D, Evans P, Swindell W.
Reproducibility of patient positioning during routine radio-
therapy as assessed by an integrated megavoltage imaging
system. Radiother Oncol 1995;35:151–60.
Short communication: An evolution of two head and neck immobilization devices
The British Journal of Radiology, February 2006 161](https://image.slidesharecdn.com/026britishjournalofradiology-britishinstituteofradiology-2006-130913065550-phpapp02/75/British-Journal-of-Radiology-British-Institute-of-Radiology-2006-eng-166-2048.jpg)

![per hour and thus the maximum leakage for each
exposure had been calculated as 115 mR/1259.58 mR
(0.084 mGy). By assuming a tube loading of 200 mAs
(20 mA 6 10 s) per exposure, the manufacturer calcu-
lated that the maximum leakage would be (9.58 mR/
10 s) 6 (3600 s h21
)53448.8 mR h21
(30 mGy h21
). In
this way, the limits of 3.4 R h21
and 30 mGy h21
given in
the operator manual were derived. If the value of 3.4 R
h21
(30 mGy h21
) is multiplied by 120 s, that is the
cumulative exposure time in 1 h for the duty cycle
assumed, the limit of 115 mR (1 mGy) in 1 h is obtained
and, therefore, according to the manufacturer the X-ray
tube was complying with the relevant norms.
This methodology, although seeming reasonable at
first glance, is incorrect. It could lead to significant doses
being received by both employees and members of the
public, as is illustrated in the following discussion. For a
quick overview of the differences between the two
methodologies for calculating leakage radiation, the
results of the measurements made at the hospital and
the factory are summarized in Table 1.
Discussion
In the recently published report No. 147 of the NCRP
[1] it is stated that ‘‘manufacturers are currently required
by regulation to limit the leakage radiation to 0.876 mGy
h21
(100 mR h21
) at 1 m. Compliance with this require-
ment is evaluated using the maximum X-ray tube
potential and the maximum beam current at that
potential for continuous tube operation’’. These max-
imum tube potential and current ratings (kVpmax and
Imax, respectively) are usually quoted as leakage
technique factors. Imax depends on kVpmax and the
values typically assumed for Imax are 3.3 mA, 4 mA and
5 mA for kVpmax of 150 kVp, 125 kVp and ¡100 kVp,
respectively [1, 2].
Since in radiation protection a number of dosimetric
quantities are simultaneously used and often confused
(as it was seen in the manufacturer calculations where a
limit of 115 mR instead of 100 mR was used), their
relationships should be clarified. An exposure of 1 R
corresponds to an air kerma of 8.76 mGy that for
shielding calculations is traditionally assumed to result
in an absorbed dose in tissues of 10 mGy and an
equivalent dose of 10 mSv [1, 3, 4]. Within this context
the leakage limit is also given as 1 mSv h21
[1], in terms
of ambient dose equivalent. Thus, while the quantity
usually measured with dosemeters is the exposure (in R)
or the air kerma (in Gy), the aforementioned correspon-
dence between units is used to convert the measured or
theoretically estimated values of exposure and air kerma
to equivalent dose (ambient dose equivalent). To find the
required shielding thickness or assess the adequacy of
the existing shielding, the resulting value of ambient
dose equivalent is compared with the respective limits of
effective dose for the personnel and public and, in certain
cases, with the equivalent dose limits for the skin and the
lens of the eye.
To determine the shielding requirements of the given
diagnostic tube, the methodology of Tsalafoutas et al [4]
was employed, assuming leakage technique factors of
4 mA and 115 kVp and using published data on the X-
ray output [2] and the attenuation properties of lead [5].
To conform to the current limit for leakage, lead
shielding of 2.07 mm Pb is required, whereas according
to the manufacturer-derived limit of 30 mGy h21
the
respective value is only 0.72 mm Pb. According to
the measurements made at the hospital, the leakage for
the second unit was 3.5 mGy h21
and thus the shielding
of the tube should be about 1.44 mm Pb equivalent.
The implications of the duty cycle concept used by the
tube manufacturer to calculate the tube shielding require-
ments could be made obvious, if one were to initially
accept that the leakage limit is 1 mGy h21
(air kerma) and
only 12 exposures of 200 mAs can be realised in 1 h, and
then assume that the operator of this mobile unit was
performing only these 12 examinations within a ward
during a working day, standing at 1 m away from the
tube. Under these assumptions and even if the scattered
radiation from the patient is ignored, the operator would
be exposed to 1 mGy air kerma corresponding to an
equivalent dose of about 1.15 mSv. Assuming 22 working
days per month and 10 months per year, the cumulative
equivalent dose would be 25 mSv per month and 250 mSv
per year. It is obvious that these values are too high
compared with the annual effective dose limit for
occupationally exposed persons (20 mSv) and the annual
equivalent dose limits for the lens of the eye and the skin
(150 mSv and 500 mSv, respectively).
Good practice requires that the operator should wear a
protective lead apron and should be 2 m or more away
from the tube or behind a wall, while the tube potential
and tube loading routinely used are less than that
assumed and therefore the actual dose would be much
less. The above simplistic calculations, however,
illustrate that the duty cycle concept is by definition
dangerous since, except for the operator, one must also
take into account the patients on the nearby beds and the
other medical staff within the ward or within the nearby
unshielded rooms. It is worth also mentioning that since
a 400 speed class screen–film combination obtains a net
optical density of 1 with about 2.5 mGy, special care
Table 1. The measurement conditions and assumptions used at the hospital and the factory for calculating the leakage
radiation. Measured and calculated dose values are for a distance of 1 m from the tube focus
Mobile Unit Tube potential
(kVp)
Tube loading
(mAs)
Measured air
kerma (mGy)
Dose rate
(mGy h21
)
Tube current
and exposure
time used for
calculating leakage
radiation per hour
Leakage
radiation
(mGy h21
)
Unit 1 (at Hospital) 100 50 (25 mA62 s) 8.2 14.7 5 mA660 min 2.95
Unit 2 (at Hospital) 110 50 (20 mA62.5 s) 12.1 17.3 4 mA660 min 3.5
Unit 2 (at Factory) 115 200 (20 mA610 s) 43 15.3 20 mA62 min 0.52
Short communication: Excessive leakage radiation in mobile X-ray units
The British Journal of Radiology, February 2006 163](https://image.slidesharecdn.com/026britishjournalofradiology-britishinstituteofradiology-2006-130913065550-phpapp02/75/British-Journal-of-Radiology-British-Institute-of-Radiology-2006-eng-168-2048.jpg)
![would be required to shield the cassettes from leakage
radiation when transporting them with that mobile unit.
Since the radiographic and fluoroscopic mobile units
used in a fixed location or frequently in the same location
may also require structural shielding [1], the implications
of the duty cycle concept on the shielding requirements
should also be mentioned. Whilst stationary X-ray units
are able to operate at higher tube loadings than mobile
units, as far as the required structural shielding is
concerned there is no essential difference between
stationary and mobile units, if the weekly workload,
operating potential etc. are the same. This is because
when calculating the shielding requirements of a room
the weekly workload is assumed in mA min without
differentiating if a workload of 300 mA min, for
example, will be obtained with 1 h continuous fluoro-
scopy and 5 mA tube current, intermittent fluoros-
copy with tube current 1 mA and cumulative fluoro-
scopy time of 300 min, or with radiographic exposures of
300 mA and total beam-on time of 1 min made
up by many short exposures with duration of a few
milliseconds. Thus, it is easily understood that if a tube
were shielded according to the duty cycle concept, the
structural shielding requirements would be considerably
determined by the leakage radiation. Therefore, the tube
shielding should be designed for the maximum possible
duty cycle, not for a typical duty cycle.
Conclusion
Proper shielding of any X-ray tube, using the standard
methodology and leakage limit, is mandatory for the
radiation protection of the operators, medical personnel,
patients and public. Indeed, most tube manufacturers
shield their tubes so as to comply with stricter limits than
1 mSv h21
. Tubes with shielding calculated in ways
similar to that reported in this study should be
considered as a potential radiation hazard and should
be recalled in order to be properly shielded. The proper
shielding of the tube is imperative for mobile radio-
graphic units and fluoroscopic C-arm units used for
interventional procedures, as in these cases the operator
and the rest of the medical staff do not enjoy the
radiation protection offered by the shielded walls of a
common fluoroscopic or radiographic facility.
Concerning this specific mobile X-ray unit, it must be
mentioned that after negotiations the unit was recalled to
the factory in order to be properly shielded. After it was
returned to the hospital, the leakage radiation had been
reduced to about 1/8 of its previous value, thus
conforming to the current leakage radiation limit.
References
1. National Council on Radiation Protection and
Measurements. Structural shielding design for medical X-
ray imaging facilities. NCRP Report 147. Bethesda, MD:
NCRP, 2004.
2. Simpkin DJ, Dixon RL. Secondary shielding barriers for
diagnostic X-ray facilities: scatter and leakage revisited.
Health Phys 1998;74:350–65.
3. Archer BR, Fewell TR, Conway BJ, Quinn PW. Attenuation
properties of diagnostic X-ray shielding materials. Med Phys
1994;21:1499–507.
4. Tsalafoutas IA, Yakoumakis E, Sandilos P. A model for
calculating shielding requirements in diagnostic X-ray
facilities. Br J Radiol 2003;76:731–7.
5. Simpkin DJ. Transmission data for shielding diagnostic X-
ray facilities. Health Phys 1995;68:704–9.
I A Tsalafoutas
164 The British Journal of Radiology, February 2006](https://image.slidesharecdn.com/026britishjournalofradiology-britishinstituteofradiology-2006-130913065550-phpapp02/75/British-Journal-of-Radiology-British-Institute-of-Radiology-2006-eng-169-2048.jpg)
![SHORT COMMUNICATION
Improvements in dose homogeneity for tangential breast fields
from a selection of combinations of library compensators
1
R J WILKS, BSc, PhD, 1
T CAMMACK, MPhys, MSc and 2
P BLISS, MRCP, FRCR
Departments of 1
Medical Physics and 2
Clinical Oncology, Torbay Hospital, Newton Road, Torquay
TQ2 7AA, UK
ABSTRACT. Individually paired physical compensators are used in our centre to improve
dose homogeneity for radiotherapy to the whole breast. This technical note describes
the further improvements that may be achieved when all possible combinations of
individual compensators within the library are considered. A retrospective study of 78
patients using a total of 16 (left-sided) and 14 (right-sided) sets of library compensators
was evaluated, and the results expressed in terms of the standard deviation of the
differential dose–volume histogram and the dose range within the breast volume. The
mean of the standard deviations was 3.17% (uncompensated), 2.16% (paired
compensators) and 1.97% (combinations) and the mean homogeneity was 15.3%,
11.8% and 11.1%, respectively.
Received 9 June 2005
Revised 16 August 2005
Accepted 31 August 2005
DOI: 10.1259/bjr/53167057
’ 2006 The British Institute of
Radiology
Wilks and Bliss [1] showed that it was possible to use a
library of a relatively small number of reusable compen-
sators as a routine procedure in reducing the dose
variation to the whole breast from tangential field
radiotherapy. This approach reduced the number of
individual compensators requiring manufacture, thus
reducing the workload on the staff involved. It was
found that out of a 100 patients, approximately 50
required compensation and 45 could be treated with one
of the library compensator pairs. The percentage of
patients planned with a library compensator has subse-
quently increased to approximately 70% of all breast
patients. In an attempt to both improve treatment dose
variation and to reduce the number of individual
compensators requiring manufacture, it was decided to
evaluate the likely improvements to be gained from
using the library compensator plates in different combi-
nations. Accordingly, a retrospective study was under-
taken of 78 patients of whom 4 patients were treated with
their own individually made compensators, 15 were
treated without compensators and 59 were treated with
paired library compensators. When these patient treat-
ments were originally planned, a nominal threshold for
the standard deviation of the dose–volume histogram of
2.5% was used to decide whether the uncompensated
dose distribution was acceptable for treatment. Increased
computer processing speeds have since made it practic-
able to investigate compensation for all patients.
Method
Each patient treatment was re-planned using addi-
tional software on the Osiris planning system [1], which
allowed the individual library compensator plates to be
used in combination with all (or none) of the other
possible plates. Only those compensators whose dimen-
sions were the same or greater than the tangential fields
used to treat the patient were chosen for analysis. This
means that the smaller field sizes had more possible
combinations of plates than the larger field sizes. Of N
possible pairs of compensator plates, the number of
combinations was 2N (single plates) + N2
.
Results
It was found possible to select a mixed compensator
combination for all 78 patients, whereas only 73 patients’
plans were improved with respect to no compensation
when using the standard paired compensators. Of the
remaining five patients, four were treated using indivi-
dual compensators. The fifth was treated uncompen-
sated as the standard deviation of the dose–volume
histogram was below the nominal threshold (2.5%) for
production of individual compensators. For the other
three patients treated with individual compensators, in
two of them the standard deviations of the differential
dose–volume histograms were improved by 0.1%, using
mixed compensator combinations. The third resulted in
no change. Therefore, using mixed compensator combi-
nations would have meant that no additional individual
compensators would have needed to be made.
Overall, for the 78 mixed compensator combinations
chosen, the dose variation was unchanged for 18 (23%)
patients and improved (i.e. reduced) for 59 (76%)
patients. One patient showed a small increase in dose
variation for a mixed pair over an individually manu-
factured compensator pair. The compensator combina-
tion selected improved on the standard library pairsAddress correspondence to: T Cammack.
The British Journal of Radiology, 79 (2006), 165–166
The British Journal of Radiology, February 2006 165](https://image.slidesharecdn.com/026britishjournalofradiology-britishinstituteofradiology-2006-130913065550-phpapp02/75/British-Journal-of-Radiology-British-Institute-of-Radiology-2006-eng-170-2048.jpg)

![CASE REPORT
Ruptured spinal dermoid cyst with disseminated intracranial fat
droplets
J G CHA, MD, S-H PAIK, MD, J-S PARK, MD, S-J PARK, MD, D-H KIM, MD and H-K LEE, MD
Department of Radiology, Soonchunhyang University Bucheon Hospital, 1174, Jung-dong, Wonmi-
gu, Bucheon-St Gyeonggi-do, 420-021, Republic of Korea
ABSTRACT. Fat droplets in the cerebrospinal fluid (CSF) is a well-known complication of
ruptured intracranial dermoid tumours. We report an unusual case of a ruptured spinal
dermoid tumour. MR images showed a tethered spinal cord and an intramedullary
fat-containing mass. Fat droplets were revealed in the ventricles and the cisternal
spaces on brain CT and brain MR. In the English literature, a ruptured spinal dermoid
tumour accompanying a tethered spinal cord is extremely rare.
Received 25 February 2005
Revised 6 May 2005
Accepted 6 May 2005
DOI: 10.1259/bjr/17232685
’ 2006 The British Institute of
Radiology
Intraspinal dermoid tumours are rare benign, slow-
growing tumours and tend to extend to the subarachnoid
space. Dermoid tumours comprise 1.1% of intraspinal
tumours [1]. There is no communication between the cyst
and the subarachnoid space. Several causes including
spontaneous, iatrogenic or traumatic rupture have been
reported to result in dissemination of lipid material from
the dermoid tumours into the subarachnoid space or
ventricles. We report a case of spontaneously ruptured
spinal dermoid tumour with disseminated intracranial
fat droplets and tethered cord.
Case report
A 44-year-old man presented with a history of voiding
difficulty starting 10 years ago and exacerbation 3
months prior to admission. There was no history of
lumbar puncture or major operation. Physical examina-
tion revealed radiating pain down left S2 dermatome
level (hyperaesthesia). Laboratory findings were normal.
The patient underwent MRI of the spine using a 1.5 T
scanner. T1 weighted (660/10/4 [repetition time/echo
time/excitation]) (Figure 1a) and T2 weighted (4000/
123/4 [repetition time/echo time/excitation]) (Figure
1b) images showed a hyperintense intramedullary mass
at the level of L3–L5 and tethered cord. Brain CT
(Figure 1c) and brain MR (4000/9/4 [repetition time/
echo time/excitation]) (Figure 1d) demonstrated multi-
ple small fat droplets in the intraventricular and cisternal
space suggesting rupture of spinal dermoid cyst. The
patient underwent a laminectomy from L2 to L5.
Discussion
Spinal dermoids are dysontogenetic tumours arising
from inclusion of ectopic embryonic rests of the
ectoderm within the spinal canal at the time of neural
tube closure between the third and the fifth week of
embryonic development [2]. Dermoid tumours show a
slight male predominance, and most dermoid tumours
are revealed during the second and third decades.
Dermoid tumours may be related to bony malforma-
tions, myelomeningocele [3], hypertrichosis and/or a
dermal sinus tract. The lumbosacral region is most
common site (60%) involving the cauda equina and the
cornus medullaris followed by the upper thoracic (10%)
and cervical (5%) regions [4]. They have a thick wall
covered with stratified squamous epithelium containing
dermal appendages such as hair, sebaceous glands,
sweat glands and hair follicle and less commonly, teeth
and nails [5]. Dermoid tumours commonly have areas of
calcification. The relatively high signal from fat on MRI,
especially the bright signal on T1 weighted images,
makes identification of lipid droplets easy, particularly
within the cerebral sulci, fissures, the perimedullary
subarachnoid space and the central canal of the spinal
cord. MRI has also shown more frequent asymptomatic
spillage of lipid material [6].
Dermoid tumours may have two distinct portions, a
lipid one and a more solid or more fluid one [4] as in our
case, showing fat tissue in peripheral portion of the
tumour and fluid content in the central portion. In
addition, especially with leakage of lipid material, the
use of intravenous contrast medium makes diagnosis of
a meningeal inflammation easier.
Although dermoid tumours develop from the embryo-
nic period, symptoms may not occur until adulthood
due to their slow growth [1], symptoms and signs
secondary to the space-occupying lesion are location-
dependent and are due to the irritative effect on and/or
compression of the adjacent structures. When accompa-
nied by a tethered cord, particularly with small lesions,
neurological symptoms can be elicited without mass
effect.
The British Journal of Radiology, 79 (2006), 167–169
The British Journal of Radiology, February 2006 167](https://image.slidesharecdn.com/026britishjournalofradiology-britishinstituteofradiology-2006-130913065550-phpapp02/75/British-Journal-of-Radiology-British-Institute-of-Radiology-2006-eng-172-2048.jpg)

![Once rupture of the cyst occurs acute symptoms relate
to chemical or aseptic meningitis [3], headache or
seizures may be developed due to dissemination of lipid
droplets in the cerebrospinal fluid (CSF) pathways.
Lumbar arachnoiditis may be developed as a result of
leakage of fat and proteinaceous material into the
subarachnoid space. The highly irritative lipid content
of dermoid tumours may cause severe inflammatory
response, though spread of fat into the CSF may also be
clinically silent [7].
After rupture of dermoid tumour occurs, lipid
droplets float in the CSF and are passively conveyed
by CSF movement. It can therefore spread throughout
the subarachnoid space and ventricular system. Scearce
et al [8] insisted that fat droplets reach the ventricles
from the perimedullary subarachnoid space by retro-
grade flow through the foramina of Luschka and
Magendie. To our knowledge, few cases of rupture of
dermoid spinal tumours have been reported [8–12].
In conclusion, MRI is not only helpful in detecting
intraspinal dermoid tumours and the fat droplets in
CSF space even in an asymptomatic case of rupture of
the tumour, but also diagnosing the associated con-
genital anomalies such as tethered cord, as is seen in our
case.
References
1. Lunardi P, Missori P, Gagliardi FM, Fortuna A. Long-term
results of the surgical treatment of spinal dermoid and
epidermoid tumors. Neurosurgery 1989;25:860–4.
2. Netsky MG. Epidermoid tumors: review of the literature.
Surg Neurol 1988;29:477–83.
3. Quigley MR, Schinco F, Brown JT. Anterior sacral menin-
gocele with an unusual presentation: case report. J
Neurosurg 1984;61:790–2.
4. Graham DV, Tampieri D, Villemure JG. Intramedullary
dermoid tumor diagnosed with the assistance of magnetic
resonance imaging. Neurosurgery 1988;23:765–7.
5. Amirjamshidi A, Ghodsi M, Edraki K. Teeth in the
cerebellopontine angle: an unusual dermoid tumour. Br J
Neurosurg 1995;9:679–82.
6. Stephenson TF, Spitzer RM. MR and CT appearance of
ruptured intracranial dermoid tumors. Comput Radiol
1987;11:249–51.
7. Funke M. Ruptured intracranial dermoid as an incidental
finding. Aktuelle Radiol 1995;5:232–4.
8. Scearce TA, Shaw CM, Bronstein AD, Swanson PD.
Intraventricular fat from a ruptured sacral dermoid cyst:
clinical, radiographic, and pathological correlation: case
report. J Neurosurg 1993;78:666–8.
9. Calabro F, Capellini C, Jinkins JR. Rupture of spinal
dermoid tumors with spread of fatty droplets in the
cerebrospinal fluid pathways. Neuroradiology
2000;42:572–9.
10. Karadag D, Karagulle AT, Erden A, Erden I. MR imaging of
a ruptured intraspinal dermoid tumour with fat droplets in
the central spinal canal. Australas Radiol 2002;46:444–6.
11. Goyal A, Singh D, Singh AK, Gupta V, Sinha S.
Spontaneous rupture of spinal dermoid cyst with dissemi-
nated lipid droplets in central canal and ventricles. J
Neurosurg Sci 2004;48:63–5.
12. Garg A, Gupta V, Gaikwad S, Deol P, Mishra NK, Suri A,
et al. Isolated central canal rupture of spinal dermoid:
report of two cases. Australas Radiol 2003;47:194–7.
Case report: Ruptured spinal dermoid cyst
The British Journal of Radiology, February 2006 169](https://image.slidesharecdn.com/026britishjournalofradiology-britishinstituteofradiology-2006-130913065550-phpapp02/75/British-Journal-of-Radiology-British-Institute-of-Radiology-2006-eng-174-2048.jpg)
![CASE REPORT
Colobronchial fistula: a late complication of childhood
radiotherapy
G C MACKAY, MRCP, J HOWELLS, MRCP, FRCR and F W POON, FRCR
Department of Radiology, Glasgow Royal Infirmary, Queen Elizabeth Building, 16 Alexandra
Parade, Glasgow G31 2ER, UK
ABSTRACT. We present the case of a colobronchial fistula in a 41-year-old man who
underwent radiotherapy for nephroblastoma as an infant. He attended for barium
enema, which demonstrated a fistula between colon and bronchial tree. Following
right hemicolectomy and pathological examination of the resected bowel, no active
disease process was identified to explain the development of this rare fistula.
Radiotherapy was deemed the most probable aetiology. We are unaware of this having
been previously described.
Received 15 February 2005
Revised 9 May 2005
Accepted 11 May 2005
DOI: 10.1259/bjr/27258284
’ 2006 The British Institute of
Radiology
Colobronchial fistulae are rare, and have previously
been reported in adults secondary to Crohn’s disease [1],
colonic malignancy [2], tuberculosis [3] and as complica-
tions of gastrointestinal surgery [4–6]. We report the
relevant radiological and clinical findings in a case of
colobronchial fistula as a likely result of radiotherapy
40 years previously.
To the best of our knowledge, this aetiology has not
previously been described.
Case report
A 41-year-old man was referred to the surgical out-
patient department for investigation of a left sided dis-
charging perianal sinus. Colonoscopy had been normal.
99
Tcm
-hexamethylpropyleneamineoxime (HMPAO)
labelled white cell isotope scan demonstrated increased
tracer uptake in the subhepatic space and to the right of
the lumbar spine (Figure 1), the significance of which
was initially unclear. Subsequent examination under
anaesthetic (EUA) and endoanal ultrasound diagnosed a
complex extrasphincteric fistula. A barium enema was
arranged to try to demonstrate any fistulous connection
which may have been missed by previous colonoscopy.
His relevant past medical history included a right
nephrectomy and subsequent intensive radiotherapy
for nephroblastoma at the age of 1 year.
On presentation for barium enema, the patient
complained of a 6 week history of general malaise,
weight loss, right upper quadrant pain, dyspnoea and
cough with associated malodorous ‘‘chocolate-coloured’’
sputum.
Barium enema demonstrated a tract of extraluminal
barium arising from the proximal transverse colon which
extended superiorly towards the right subphrenic space
(Figure 2). The examination was immediately termi-
nated, although the patient remained haemodynamically
stable with no signs of peritonism. Appearances were
consistent with a localized colonic perforation, for which
an iatrogenic cause was not thought likely. The leak
appeared confined, with no evidence of free intra-
peritoneal air nor generalized barium contamination of
the peritoneal cavity.
Contrast-enhanced CT of abdomen and pelvis per-
formed on the same day confirmed a broad tract of
Address correspondence to: Dr Gillian MacKay, 7 Rosevale Road,
Bearsden, Glasgow G61 2RX, Scotland, UK.
Figure 1. 99
Tcm
hexamethylpropyleneamineoxime (HMPAO)
labelled isotope scan demonstrating high uptake in the right
paravertebral region (illustrated by arrow).
The British Journal of Radiology, 79 (2006), 170–172
170 The British Journal of Radiology, February 2006](https://image.slidesharecdn.com/026britishjournalofradiology-britishinstituteofradiology-2006-130913065550-phpapp02/75/British-Journal-of-Radiology-British-Institute-of-Radiology-2006-eng-175-2048.jpg)

![With regard to the patient’s symptoms on presenta-
tion, it now seems likely that the brown, malodorous
sputum he described was actually faeculent. The organ-
isms grown from the endotracheal tube secretions were
Coliform bacilli, consistent with this conclusion.
In retrospect, and with the benefit of further imaging,
it is likely that the area of high white cell uptake adjacent
to the right lumbar area represented inflammation at the
site of the fistulous track within the abdomen.
The patient has had a normal colonoscopy, negative
Gram-staining of sputum and blood cultures, and non-
specific pathology of the right hemicolon (in particular,
there is a lack of features to suggest Crohn’s disease). The
most likely aetiological conclusion has therefore been
reached by a process of elimination.
Colobronchial fistula is an uncommon finding. It has
been described in relation to Crohn’s disease, in which
fistula formation is a classical manifestation, as a late
complication of appendicitis, and following laparoscopic
biliary surgery. Colonic malignancy and tuberculosis are
other documented causes. However, we can find no
reference to a fistula of this nature ever having been
described secondary to abdominal radiotherapy. Not
only is the extent of this fistula highly unusual, but the
length of time taken for symptoms to develop is
exceptional.
Although it is extremely rare, fistula formation many
years following radiotherapy has been previously
described in a patient who developed an enterocuta-
neous fistula 27 years after radiotherapy for carcinoma of
the penis [7]. Given that the oncological treatment of this
patient took place in the early 1960s, the field of
radiotherapy would have been right-sided but wide,
with larger fractions being administered in comparison
with today’s treatment doses. Fistulae more localized to
the site of disease and area of treatment are known to be
potential direct complications of radiotherapy and have
been well-documented. However, one would expect the
onset of related symptoms to occur within a relatively
short timescale of treatment.
In treating this condition, surgical resection of the
colon is usual, with subsequent lung resection.
Unfortunately, the patient has not, as yet, been deemed
fit enough to undergo lobectomy, and so treatment has
been suboptimal. Long term clinical outcome is therefore
unclear.
References
1. Karmy-Jones R, Chagpar A, Vallieres E, Hamilton S.
Colobronchial fistula due to Crohn’s disease. Ann Thorac
Surg 1995;60:446–8.
2. Tenuchi S, Saku N, Ishii Y, et al. A case of colon cancer with
tension pneumothorax and empyema as a consequence
of colopleural fistula. Nikon Kokyuki Gakkai Zaashi
2000;38:865–9.
3. Crofts TJ, Dalrymple JO, Buhrmann JR. Tuberculous bronch-
ocolic fistula. S Afr Med J 1978;54:795–6.
4. Pochin R, Frizzelle F. Colonic-broncho fistula: a previously
unreported complication following laparoscopic cholecys-
tectomy. Case Rep Clin Pract Rev 2003;4:77–9.
5. Corlett SK, Windle R, Cookson JB. Colobronchial fistula: a
late complication of appendicitis. Thorax 1988;43:420–1.
6. Lucas TA, Reynolds HY. Diagnosis and management of a
colobronchial fistula in a 55 year old male with feculent
sputum. Chest 1999;116:395–6.
7. Chintamani, Badran R, Rk D, Singhal V, Bhatnagar D.
Spontaneous enterocutaneous fistula 27 years following
radiotherapy in a patient of carcinoma penis. World J Surg
Oncol 2003;1:23.
G C MacKay, J Howells and F W Poon
172 The British Journal of Radiology, February 2006](https://image.slidesharecdn.com/026britishjournalofradiology-britishinstituteofradiology-2006-130913065550-phpapp02/75/British-Journal-of-Radiology-British-Institute-of-Radiology-2006-eng-177-2048.jpg)

![Discussion
Depending on their nature, ingested foreign bodies
may have an uneventful course or be impacted in the
gastrointestinal tract. Most of the foreign bodies pass
through the gastrointestinal tract within a week [1]. The
reported incidence of bowel perforation is less than 1%,
the objects being pointed or sharp in most cases like tooth
picks, sewing needles, dental plates, fish bones and
chicken bones [1]. The most common sites of perforation
are the ileocecal junction and the rectosigmoid region.
There has been a single case report of plum pits in the
terminal ileum. This resulted in an inflammatory con-
glomerate tumour proximal to the ileocecal valve and
presented years later with intestinal bleeding [2]. Segal [3]
reported a case of ingestion of soft drink bottle top and
stones which resulted in chronic ileitis. Sclerosing
encapsulated peritonitis also called as calcifying peritoni-
tis appears as dilated bowel loops, air fluid levels and
peritoneal calcifications on plain films. Ultrasound reveals
dilated fixed bowel loops matted together and tethered
posteriorly, intraperitoneal echogenic strands and an
echogenic sandwich appearance of the membrane.
The child in our case had ingested stones and sand.
The wall of the terminal ileum was ulcerated either due
the direct action of the stones or due to the inflammation
or both with subsequent necrosis and perforation, and
the sand and small stones spilling out into the
peritoneum. The calcific opacities were not observed on
histology as one of the calcifications must have been
crushed by the microtome and the other could have
moved out of the operative field.
To conclude a common cause of a calcific opacity in the
right iliac fossa in a child who presents with signs and
symptoms of appendicitis would be an appendicolith. The
other differential diagnosis of a calcific opacity in the right
iliac fossa would include calculus in a vesical diverticula,
enterolith, phlebolith in a pelvic vein, ectopic gallstone,
calcification within a teratoma and calcification in a
mesenteric lymph node. A giant appendicolith measuring
3 cm has been reported [4]. Calculi located in urinary
bladder diverticula have a dumb-bell shape with one end
lodged in the diverticulum and the other projecting into
the lumen of the bladder. In a phlebolith usually a central
lucency can be seen. An ectopic gallstone was ruled out
since the gallbladder was normal on ultrasound. The
classic ultrasound appearance of teratoma is a prominent
cystic component and at least one contained mural nodule
that is often echogenic as a result of contained fat, hair,
sebum or calcium. The calcific opacity in our case was
located in a bowel loop on ultrasound.
Retrospective review of the radiographs revealed that
the calcification was very dense in our case and did not
have the typical laminated appearance of an appendico-
lith. The change in the position of the calcifications on
serial radiographs would also be a pointer against an
appendicolith. Rarely a foreign body may simulate
appendicitis with gut inflammation and a radiopacity
should be considered in the differential diagnosis.
References
1. Chintamani, Singhal V, Lubhana P, Durkhere R, Shabnam B.
Liver abscess secondary to a broken needle migration: a case
report. BMC Surgery 2003;3:8–13.
2. Lucker C, Schulte GA, Moldenhauertt. Plum pits in the
terminal ileum. Rontgenblatter 1987;40:191–2.
3. Segal I, Nouri MA, Hamliton DG, Ou Tim L, Giraud RM,
Mirwis J, et al. Foreign-body ileitis: a case report. S Afr Med J
1980;58:421–2.
4. Devalia H, Dhamdhere M, Horner J. A giant appendicolith:
miscellaneous case 2947. In: Gastrointestinal Imaging 2004.
Available via EURORAD. http://www.eurorad.org/case
[Accessed 5 February 2004].
Figure 3. Ultrasound of the right iliac fossa. A calcific
opacity is seen in the lumen of the bowel. The walls of the
loop are thickened.
Figure 4. Plain supine radiograph. A calcific opacity is still
seen in the right iliac fossa.
V Moorjani, C Wong and A Lam
174 The British Journal of Radiology, February 2006](https://image.slidesharecdn.com/026britishjournalofradiology-britishinstituteofradiology-2006-130913065550-phpapp02/75/British-Journal-of-Radiology-British-Institute-of-Radiology-2006-eng-179-2048.jpg)
![CASE REPORT
Misleading positioning of a Foley catheter balloon
1
S ABADI, MD, 1
O R BROOK, MD, 2
E SOLOMONOV, MD and 1
D FISCHER, MD
1
Department of Diagnostic Imaging, Rambam Medical Center, Haifa, Israel and
2
Department of Surgery, Rambam Medical Center, Haifa, Israel
ABSTRACT. Indwelling catheters in the urinary bladder are associated with numerous
and various complications, e.g. infection, haemorrhage, epididymo-orchitis and
perforation. Abdominopelvic CT is frequently performed in hospitalized patients, with
the bladder being included in the examination. Familiarity with the various bladder
pathologies and a routine and meticulous search for them are indicated in every case.
Moreover, an awareness of certain pitfalls may prevent over-diagnosis and over-
treatment. We present a case in which a Foley catheter balloon inflated in a bladder
diverticulum simulates sealed bladder perforation with extraluminal location of the
balloon. This potentially misleading diagnosis should be considered in the presence of
apparent extraluminal position of catheter tip or balloon not substantiated by the
clinical presentation.
Received 14 January 2005
Revised 9 June 2005
Accepted 9 June 2005
DOI: 10.1259/bjr/13576050
’ 2006 The British Institute of
Radiology
Indwelling catheters in the urinary bladder are
associated with numerous and various complications,
e.g. infection, periurethral abscess, urethral diverticulum,
perineal erosion, bladder atrophy, bladder stones,
haemorrhage, epididymo-orchitis or urinary fistula [1,
2]. Intraperitoneal or extraperitoneal perforation can
occur as a rare but life threatening complication [3]. CT
is a reliable method for evaluating the bladder and
demonstrating possible pathologies such as tumours,
calculi, fistulas or diverticula [4].
Case report
We present the case of an 80-year-old man who
underwent surgery for colon obstruction due to
adhesions. A bladder Foley catheter was placed for
drainage and haemodynamic monitoring.
A CT scan was performed 5 days following surgery,
because of fever, abdominal pain and tenderness. A
collection of fluid was observed in the left lower quadrant.
In addition, on the pelvic axial scan, the Foley catheter was
seen beyond the bladder wall, with the balloon outside its
boundaries (Figure 1). The Foley balloon was not
surrounded by urine and formed an acute angle with
the bladder walls. Two sequential scans were performed
with a 5 h interval between them; this was related to poor
bowel opacification on the initial scan. Both scans showed
the balloon at the same position with the only differences
being that the later scan (Figure 1b) was done with the
bladder more distended with urine than the first (Figure
1a) and opacified with contrast material.
(a) (b)
Figure 1. Axial CT scan of the pelvis at the level of the urinary bladder (a) before and (b) after opacification with contrast
material demonstrates a partially filled bladder with an inflated catheter balloon situated outside and close to its anterior wall.
The British Journal of Radiology, 79 (2006), 175–176
The British Journal of Radiology, February 2006 175](https://image.slidesharecdn.com/026britishjournalofradiology-britishinstituteofradiology-2006-130913065550-phpapp02/75/British-Journal-of-Radiology-British-Institute-of-Radiology-2006-eng-180-2048.jpg)


![Findings
Plain radiograph of the pelvis (Figure 1) showed a
large irregular, calcified, bony mass arsing from the right
ilium. A diagnosis of an osteochondroma was made.
Because of the size of the lesion, there was a concern that
the lesion may represent a malignant chondroid lesion.
MR of the pelvis (Figures 2 and 3) showed an 8 cm 6
7 cm 6 7 cm lesion arising from the right ilium with
typical features of an osteochondroma. There was a rim
of high signal on T2 weighted imaging in keeping with a
cartilage cap. The cartilage cap measured up to 1 cm in
thickness, but the iliac crests had not fused indicating
that the patient was not skeletally mature. There were no
sinister features to suggest malignant degeneration into a
chondrosarcoma, but nevertheless, with a lesion of this
size, malignancy could not be completely excluded.
Interestingly, the right kidney could not be visualized in
the MR images with some hypertrophy of the left kidney,
and the lesion itself was located close to the expected
anatomical site of the right kidney (Figure 3). Also, there
was hypoplasia of the ipsilateral hemipelvis (Figure 1)
with minor scoliosis concave to the right (Figure 3). At
this point, the possibility of previous right nephrectomy
and radiation to the renal bed causing this osteochon-
droma was invoked. Further history in fact revealed that
the patient did have a right nephrectomy and partial
right hepatectomy for stage 3 type Wilm’s tumour at the
age of 2 years, which was followed by chemotherapy
and radiation of 3000 cGy to the right hemiabdomen and
the tumour bed. Incision biopsy at a tertiary bone
tumour centre confirmed this lesion to be an osteochon-
droma with no pathological features to suggest malig-
nancy. The patient was offered excision of the lesion, but
since she was not symptomatic from the lesion itself, she
preferred to wait for a few years.
Discussion
Radiation-induced osteochondromas arise typically in
patients who received radiotherapy as children, and they
are indistinguishable radiologically and pathologically
from a spontaneous osteochondroma. In a series of 42
patients with Wilm’s tumour treated with radiotherapy
and a minimum follow-up of 5 years, there was a 4.8%
incidence of osteochondromas and a 2.4% incidence of
sarcomas [1]. In another series of 58 children who
received radiotherapy as part of therapy for bone
marrow transplantation, 5 developed osteochondromas
and all of these 5 children were less than 5 years of age at
the time of radiotherapy with no patient who underwent
radiotherapy after 5 years of age developing osteochon-
dromas [2]. There is an average latent period of about 5–
8 years before these lesions develop [2, 3] and they may
be found to be enlarging until normal growth ceases and
growth of tumour is maximal at times of patient’s
growth spurt [4]. Malignant degeneration in radiation-
induced osteochondromas is uncommon and the criteria
applied to spontaneous lesions such as increase in size of
the lesion after epiphyses closure, increasing soft tissue
mass and development of pain in the absence of an
alternative explanation should be used for these as well
[3, 5]. A thickened cartilage cap greater than 2 cm raises
the suspicion of malignant change in an osteochondroma
[5]. Only two cases have been adequately described
wherein radiation-induced osteochondromas underwent
malignant change [6]. Other complications of these
lesions include restriction of movement at adjacent
joints, bursitis and pressure on adjacent neurovascular
bundle [5]. In conclusion, this is a very unusual
presentation of a rare case of radiation-induced osteo-
chondroma of the right ilium in a 19-year-old female
secondary to radiotherapy, which had been performed
when the patient was 2 years old. Detection of mass
lesions in such young patients who are survivors of
childhood cancer causes significant anxiety and
psychological impact on the patients’ lives. The
current literature suggests very low incidence of
malignant degeneration in radiation-induced osteochon-
dromas, and awareness of this behaviour of these
lesions should help the clinicians to manage them
appropriately.
References
1. Paulino AC, Wen BC, Brown CK, Tannous R, Mayr NA,
Zehn WK, et al. Late effects in children treated with radiation
therapy for Wilm’s tumour. Int J Radiat Oncol Biol Phys
2000;46:1239–46.
2. Taitz J, Cohn RJ, White L, Russell SJ, Vowels MR.
Osteochondroma after total body irradiation: an age-
related complication. Pediatr Blood Cancer 2004;42:
225–9.
3. Libshitz HI, Cohen MA. Radiation-induced osteochondro-
mas. Radiology 1982;142:643–7.
4. DeSimone DP, Abdelwahab IF, Kenan S, Klein MJ, Lewis
MM. Radiation-induced osteochondroma of the ilium.
Skeletal Radiol 1993;22:289–91.
5. Lee KC, Davies AM, Cassar-Pullicino VN. Imaging the
complications of osteochondromas. Clin Radiol 2002;57:
18–28.
6. Mahboubi S, Dormans JP, D’Angio G. Malignant degenera-
tion of radiation-induced osteochondroma. Skeletal Radiol
1997;26:195–8.
S Harish, A Rehm and P W P Bearcroft
178 The British Journal of Radiology, February 2006](https://image.slidesharecdn.com/026britishjournalofradiology-britishinstituteofradiology-2006-130913065550-phpapp02/75/British-Journal-of-Radiology-British-Institute-of-Radiology-2006-eng-183-2048.jpg)


![EDITORIAL
BJR Review of the Year – 2005
DOI: 10.1259/bjr/63430650
’ 2006 The British Institute of
Radiology
Introduction
Following the successful launch of the ‘‘Review of the
Year’’ 12 months ago [1], the Editorial Board decided that
a similar review should be compiled for 2005. Once again
a selection of noteworthy papers on currently important
topics has been made by the Honorary and Deputy
Editors.
This has been a good year for the Journal with no
shortage of suitable papers from which to choose. One
of the reasons has been that since the Journal
introduced online submission towards the end of 2004,
there has been a sharp increase in the number of papers
received. Twice as many papers were submitted
during the first 6 months of 2005 as for the same period
in 2004.
This welcome shift has created some problems. The
Editorial Board has been expanded to deal with the
increased work-load and refereeing standards have been
tightened. In spite of this, the number of papers accepted
for publication each month has exceeded the number of
pages available in each issue and this has led to an
increasing interval between acceptance and publication.
We are currently looking at ways to address this
problem.
Another important development this year has been the
introduction of a Young Investigator Award. This Award
is made by the Honorary Editors for the best paper
submitted by an author, or first-named author, under
35 years of age at the time of submission. Only papers
that are accepted by both referees at the first submission,
either without change or with only minimal changes, are
eligible for consideration.
18 authors were eligible for the 2005 Award and
several of them reached the final short list. The Award is
made to Dr T Xiong for his paper entitled ‘‘Incidental
lesions found on CT colonography: their nature and
frequency’’ [2]. Compilation of this comprehensive,
systematic review required careful, painstaking
research and provides valuable data on the potential
benefits and pitfalls of CT colonography. It is always
enlightening to review published research and identify
at first hand some of the weaknesses in the published
data, despite the eminence of the authors and the
reputations of the journals in which they were published.
Hopefully the Award and the experience gained by
reviewing these data will stimulate Dr Xiong to
contribute more to the field of research. A summary of
the main findings of the paper appears in the next
section.
Diagnostic Radiology and the Young
Investigators Award
The difficulty of staying ‘‘up to date’’ in medicine is of
concern to most of us in practice, and this has been
reinforced this year in the Journal. Whilst our Young
Investigator Award winner Dr Xiong was reporting on
an analysis of published papers on CT colonography, just
2 months later Jardine et al [3] were perhaps showing us
the future of colonography in their report on the
potential problems using MR.
Xiong et al [2] identified additional abnormalities
reported in almost 40% of patients, with the total number
of abnormalities exceeding the number of patients
analysed. Furthermore, as would be expected, the
number of abnormalities and their potential significance
varied dependent on the age of the population studied,
and the definition of important abnormality. The
examination methodologies also varied, and it would
seem reasonable to expect the experts to agree a
standardized technique and reporting terminology for
the future. A more detailed discussion of the pros and
cons of CT colonography may be found in the commen-
tary by Ng and Freeman [4] that accompanied the
Award-winning paper. As a practising radiologist, the
significance and reliable detection of extracolonic disease
may be of critical importance in the future, regarding
decisions on who reports these scans. This is a topic of
increasing concern for UK based radiologists facing the
prospect of the ever increasing use of skill-mix.
Of the many other radiology articles published last
year in the BJR, the reader’s attention is drawn to the
article by Reuben et al [5]. This nicely conducted study
on the interpretation of facial trauma images by surgical
trainees, managed to justify the use of 3D reconstructions
and also suggested that there may still be a role for
conventional radiography. 17 trainee faciomaxillary
surgeons reviewed plain radiographs, conventional and
3D CT images of facial trauma patients. They were asked
to score their ease of interpretation of each type of image.
Their results were compared to the ‘‘subjective’’ gold
standard of a consultant radiologist and a faciomaxillary
surgeon. The trainee surgeons were best at interpreting
3D images, but were less good at interpreting conven-
tional axial CT images compared with plain radiographs.
Finally, in this section on diagnostic radiology, a
commentary by Munro [6] is noted. This article, although
written as a commentary on a radiotherapy paper, is a
‘‘must’’ for all those radiologists plying their trade in
research. This beautifully written piece, with quotations
from J K Galbraith and Francis Bacon, explains the need
The British Journal of Radiology, 79 (2006), 183–187
The British Journal of Radiology, March 2006 183](https://image.slidesharecdn.com/026britishjournalofradiology-britishinstituteofradiology-2006-130913065550-phpapp02/75/British-Journal-of-Radiology-British-Institute-of-Radiology-2006-eng-187-2048.jpg)
![for well-performed observational reporting, and will be a
fillip to all those who do not achieve the current research
nirvana of a randomized controlled trial.
Computer-aided diagnosis
With the increasing availability of digitized images,
computer-aided diagnosis (CAD) is currently a hot topic
and this was the subject of one of the two Special Issues
of the Journal in 2005. A good review article by Doi
entitled ‘‘Current status and future potential of compu-
ter-aided diagnosis in medical imaging’’ [7] was sup-
ported by six other contributions.
The basic concept is to provide a computer output as a
second opinion to assist image interpretation by radio-
logists by improving the accuracy and consistency of
radiological diagnosis and also by reducing the image
reading time. To achieve this goal it is necessary not only
to develop suitable algorithms but also to quantify and
maximize the effect of computer output on the perfor-
mance of radiologists. Research and development of
CAD has therefore involved a team effort by investi-
gators with different backgrounds – physicists, radiolo-
gists, computer scientists, engineers, psychologists and
statisticians.
The technique of receiver operator characteristic (ROC)
curve analysis can be very helpful in assessing the impact
of input from the computer. ROC methodology makes no
requirement of the positive/negative decision thresholds
of the observer, other than that they remain constant.
Results are readily understood ‘‘at a glance’’ – see, for
example, Figure 8 in the paper by Doi [7].
Potential clinical applications of CAD considered
included: detection of lung nodules on digital chest
radiographs; lung nodule detection based on morpho-
logy and sequential volume changes in CT images;
prompting techniques to assist in the reading of
mammograms and their impact; virtual colonoscopy as
a screening method for colorectal neoplasia.
The overall conclusion was that since CAD can be
applied to all imaging modalities, all body parts and all
kinds of examination, it is likely to have a major impact
on medical imaging and diagnostic radiology in the
21st century. However, further careful evaluation is
required and an awareness of on-going developments is
important.
Diagnostic ultrasound and ultrasound
measurement
A number of papers have been published during the
year on clinical applications of diagnostic ultrasound.
Some have illustrated the use of relatively new techni-
ques. For example Gorg et al [8] used quantitative colour
Doppler ultrasound to evaluate and characterize arterial
supply of chest wall lesions and Dietrich et al [9] used
microbubble contrast-enhanced phase inversion ultra-
sound to differentiate focal nodular hyperplasia and
hepatocellular adenoma.
A paper of particular clinical interest was ‘‘Ultrasound
evaluation of the fibrosis stage in chronic liver disease by
the simultaneous use of low and high frequency probes’’
by Nishiura et al [10]. Those involved in ultrasound will
realise that for more than 25 years innumerable attempts
have been made at tissue characterization by ultrasound
and whilst this article does not claim to do such it seems
to give useful clinical help which may reduce the
number of invasive liver biopsies required. The authors
looked at 103 patients, examining them with two probes,
one at 2–5 MHz and another at 5–12 MHz. They used a
scoring system evaluating the edge, surface and par-
enchymal texture of the liver. They found that the high
frequency probe was more sensitive for identifying
mildly abnormal changes, whereas the low frequency
probe was more useful for scoring advanced changes.
The accumulated scores of the three parameters was the
most reliable with 100% sensitivity for fibrosis stage 4
and results which were almost as impressive in mild
disease. The authors do not indicate whether this has had
any impact as yet in reducing the number of liver
biopsies but the hope must be that it will. They are
intending to extend the technique to other hepatic
diseases including the potentially more difficult ones
seen in children. Let us hope this proves a fruitful field of
endeavour.
Given the continuing diversification of the application
of diagnostic ultrasound in medicine, the Editorial by
Francis Duck entitled ‘‘Ultrasound exposure measure-
ment: a hidden science?’’ [11] was timely. Under the dual
pressures of clinical users asking for improved perfor-
mance and manufacturers competing to gain commercial
edge, there is evidence from long-term studies of a
general trend towards increased acoustic output.
Doppler techniques frequently use outputs that come
close to the limits set by the thermal (TI) and mechanical
(MI) safety indices [12]. Collapse cavitation of micro-
bubbles, with potentially harmful effects in vivo, can
occur at high intensities. In spite of the above, current
hospital practice makes little or no attempt to evaluate
the ultrasound radiation generated by their equipment
and there is little investment in measurement tools or
commitment of personnel time to such measurements.
Duck makes two general recommendations. First there
is a need for appropriate acoustic measurement devices,
suitable for both laboratory-based and field measure-
ments. For example a well-engineered, portable, com-
mercial power meter capable of measuring acoustic
power down to 10 mW or less would make available a
direct and simple means to confirm the accuracy of the
displayed TI for imaging and to identify critical condi-
tions for transducer heating. Similarly an integrated,
easy-to-use portable package including hydrophone,
positioning, data acquisition and output would enable
on-line measurement of pressure wave-form, acoustic
frequency, MI, and temporal-averaged intensity, all key
quantities for exposure measurement.
Second, there needs to be a culture change in NHS
trusts and hospitals. Measurement of ionizing radiation
is now part of the scientific ethos of all NHS trusts, who
are committed to a regimen of measurement support that
is integrated within their risk management policies. A
similar commitment to ultrasound measurement is
required, thereby ensuring accountability and the ability
to respond robustly to the question ‘‘What evidence do
you have that your ultrasound scanners are safe to use
on patients?’’
Editorial
184 The British Journal of Radiology, March 2006](https://image.slidesharecdn.com/026britishjournalofradiology-britishinstituteofradiology-2006-130913065550-phpapp02/75/British-Journal-of-Radiology-British-Institute-of-Radiology-2006-eng-188-2048.jpg)
![Radiobiology – low dose risk
The ‘‘holy grail’’ of radiation protection is ‘‘what
happens at low doses?’’ and the January issue opened
with a fascinating discussion of one of the longest
running debates in radiation biology: Is low dose
irradiation harmful or protective? [13–17]. This was not
simply a rehash of old information. It included the
presentation of previously unpublished data from a very
large cohort of US workers (28 000) on nuclear powered
ships over the period 1980–1988. Their death rates were
compared with a similar number of shipyard workers
who had not been exposed to abnormal radiation levels
and the results were intriguing. The death rate from
cancer of the occupationally exposed workers was
significantly lower than that of the controls and
dramatically lower for non-cancer deaths. This supple-
ments a significant body of epidemiological and radio-
biological data supporting the view that low doses may
indeed induce protective mechanisms including apopto-
sis and enhanced immune competence. Counter argu-
ments were also made and while they did not dispute the
evidence for a protective effect they relied on the
fundamental importance of the double strand break as
the dominant DNA lesion and its relationship to dose. It
is significant that the linear generation of double strand
breaks with dose is not incompatible with mechanisms
that enhance apoptosis and immune surveillance.
However, the undesirable implications of a change of
policy from assuming no safe dose of radiation to one
where low doses are desirable, was a compelling
argument for maintaining the status quo and the linear
no threshold hypothesis seems set to underpin the
legislative framework for the foreseeable future.
Notwithstanding, there is a genuine scientific debate
about mechanisms and risks at low doses, some of which
was aired in subsequent issues of the Journal [18–22].
There is a need for the scientific community to maintain a
truly open mind on this issue.
Another important outcome of low dose radiation
exposure is the delayed expression of chromosomal
aberrations as a consequence of genomic instability. This
phenomenon was first described 15 years ago [23] and
has since been associated with bystander effects [24, 25].
An interesting insight into these processes was reported
in the October issue [26]. The study showed that short
term repopulating cells in the bone marrow are capable
of fully repairing DNA damage, as manifest by chromo-
some aberrations, within a few cell generations, whereas
cells responsible for long term repopulation retain
damage in a form that can be expressed as aberrations
many months after irradiation. This reinforces the view
that radiation induced genomic instability is an early
event in multi-step carcinogenesis.
Patient doses and image quality
The subject of patient dosimetry – whether or not we
are confident about the risk magnitude – was promi-
nently discussed during the year. A screening pro-
gramme which involves the irradiation of asymptomatic
patients is always subject to particular scrutiny and a
comprehensive study of doses received in the UK breast
screening programme was reported by Young et al [27].
The radiation dose received by large breasts has been
reduced by the use of automatic beam quality selection
and large format film. However, this is offset to some
extent by an increase in the total dose per woman due to
the introduction of two view screening at every visit. The
authors call for a revised definition of the standard breast
used in the UK to reflect better the exposure factors and
doses received in clinical practice.
On the same subject, optically stimulated lumines-
cence was applied in a novel way for in vivo dose
measurements in mammography. The presence of the
small probes required did not significantly interfere with
the diagnostic quality of the images and good agreement
with ionization chamber dosimetry was reported [28]. A
further novel mammographic technique – near-infrared
optical transillumination spectroscopy – has been devel-
oped to determine physiological properties of the breast
tissue and thus hopefully to quantify differences
between women with low and high breast cancer risk
[29].
Because of the relatively high effective doses involved,
patient dose reduction in CT is a topical issue. Lewis and
Edyvean [30] considered the implications of multislice
CT scanners, whose ability to utilize long scan lengths
and narrow slices can lead to increased doses. Although
automatic exposure control and particularly for children
and smaller patients, tailoring of tube current to patient
size, can lead to dose reductions, the establishment of
acceptable levels of image quality for different examina-
tion types is the key to dose optimization.
The assessment of image quality raises many scientific
issues concerned with the perception and cognition of
images and these were outlined in a commentary by
Manning et al [31]. Two groups of factors which
influence the ability of the observer to interpret image
information are those which are image dependent and
relate to the visual conspicuity of relevant features and
those which are image independent and primarily
cognitive. The latter is particularly deserving of further
study. Further complications arise because of the
introduction of digital image technology, softcopy work-
stations and the phasing out of hardcopy images. There
are countless ways in which images may be processed
and manipulated and thus many opportunities to
optimize the link between the image and the visual
systems of the observers. But how can diagnostic
outcomes be measured and compared with hard copy?
Computer-aided detection tools may help here. A
comparison of full-field digital mammography and
film–screen mammography from the point of view of
image quality and lesion detection was reported this year
[32], demonstrating the superiority of the former.
We leave this subject by reflecting that after many
years of reporting patient dose measurements the point
has been reached where we need to think carefully
whether further data add to our overall understanding.
This means that the Journal will be more selective in the
studies accepted for publication and will favour work
which takes into account all aspects of the imaging
process (of which dose is only one component). As
Martin stated in his Editorial this year [33] ‘‘…finding the
appropriate level of image quality is the most important
Editorial
The British Journal of Radiology, March 2006 185](https://image.slidesharecdn.com/026britishjournalofradiology-britishinstituteofradiology-2006-130913065550-phpapp02/75/British-Journal-of-Radiology-British-Institute-of-Radiology-2006-eng-189-2048.jpg)
![objective. Keeping the dose low should always be
secondary’’.
Image quality, as noted above, is an often ill-defined
feature of the imaging process. In the November edition,
an international collaborative study [34] described a
comparison of conventional X-ray imaging of mice and
rabbit lungs with two types of phase-contrast imaging.
Phase contrast techniques highlight lung boundaries and
provide enhanced lung visibility compared with con-
ventional X-ray imaging, although the wider clinical
applications at present remain uncertain.
Procedures for the radiation protection of staff working
with X-rays are well understood, even if, at low doses, the
resultant risks are not. In general, the regulatory require-
ments for safe practice in this field are not too inhibiting.
Unfortunately, the same may not be the case for MRI, at
least in the European Union. Impending legislation on
electromagnetic field exposure to staff may cause serious
problems in the provision of clinical services, as gradient
field limits will inhibit work close to the magnet bore
during imaging. This has particularly serious conse-
quences for interventional MR procedures [35]. We hope
that the sparse evidence for deleterious effects will prompt
a future UKRC debate on the motion ‘‘There is no risk to
health at low current densities’’.
Radiotherapy and Oncology – adverse effects
of radiation treatment
This was a year for reminding us, if we needed
reminding, of the fundamental paradox that underlies
clinical radiotherapy. We treat a dread disease with an
intervention that is, itself, dangerous. Shakespeare was,
as so often, there before us:
‘‘……, and wish
To jump a body with a dangerous physic,
That’s sure of death without it’’
(Coriolanus: Act 3, Scene 1).
Two papers early in the year reminded us of the late
consequences of treatment [36, 37]. In the first Rowland
Payne et al [36] investigated the efficacy and tolerability of
the hyfrecator (Conmed, Utica, NY), a versatile office-
based electrosurgical instrument, as a treatment for
radiation-induced telangiectasia. The treatment was well
tolerated and generally resulted in a substantial reduction
in telangiectasia with a concomitant improvement
in quality of life. In the second, Power [37] reviewed
the proceedings of a meeting held at the BIR in May 2004 to
discuss issues regarding the recording and analysis of late
effects of radiotherapy treatments. The outcome was that
data on late effects are essential to assess the therapeutic
effect of treatment, but there is a need for international
consensus as to the best methods of data collection – which
should be validated, sensitive, reproducible and user-
friendly. In addition to these two papers, the BJR
Supplement on ‘‘Radiation-induced multi-organ involve-
ment and failure’’ [38] provided an excellent overview for
practising oncologists – keeping in mind that, with the
threat of terrorists bearing dirty bombs, we might be called
upon to deal with the casualties following the use of such a
weapon.
On the more hopeful side, the paper by Amemiya et al
[39] was reassuring, showing once again, that the
benefits offered by radiotherapy – treatment of early
squamous cell carcinoma of the head and neck in this
work – usually far outweigh the disadvantages (radia-
tion-induced second cancers in this study). Cominos et al
[40] showed that radiotherapeutic technique is important
in avoiding the adverse consequences of treatment.
Using a four-field technique for treating oesophageal
cancer significantly reduced the dose to the heart.
Finally, in a careful meta-analysis of clinical trials
Dayes et al [41] showed that there was no evidence to
support the use of nitroimidazoles as hypoxic cell
sensitizers in patients treated with radiotherapy for
carcinoma of the cervix but there was a significant
increase in the rate of neurotoxicity.
In view of the severe, and largely unexpected adverse
late effects of neutrons, two papers by Jones and others
on particle therapy deserve mention [42, 43]. The role
that particle therapy can, and should, play in the
management of cancer is a matter of some debate. We
hope that, in the coming months, the BJR will make a
useful and authoritative contribution to this debate. We
need informed discussions, based on facts. We cannot
afford to let the agenda be hijacked for political or
commercial reasons. To do so would be to fail in our
scientific obligations and more importantly, to fail in our
duty of care to patients with cancer.
References
1. BJR Review of the Year – 2004. Br J Radiol 2005;78:181–5.
2. Xiong T, Richardson M, Woodroffe R, Halligan S, Morton
D, Lilford RJ. Incidental lesions found on CT colonography:
their nature and frequency. Br J Radiol 2005;78:22–9.
3. Jardine VL, Sala E, Lomas DJ. MR colonography: baseline
appearance of the unprepared rectosigmoid. Br J Radiol
2005;78:202–6.
4. Ng CS, Freeman AH. Incidental lesions found on CT
colonography: their nature and frequency. Br J Radiol
2005;78:20–1.
5. Reuben AD, Watt-Smith SR, Dobson D, Golding SJ. A
comparative study of evaluation of radiographs, CT and 3D
reformatted CT in facial trauma: what is the role of 3D? Br J
Radiol 2005;78:198–201.
6. Munro AJ. The conventional wisdom and the activities of
the middle range. Br J Radiol 2005;78:381–3.
7. Doi K. Current status and future potential of computer-
aided diagnosis in medical imaging. Br J Radiol
2005;78:S3–S19.
8. Go¨rg C, Bert T, Go¨rg K, Heinzel-Gutenbrunner M. Colour
Doppler ultrasound mapping of chest wall lesions. Br J
Radiol 2005;78:303–7.
9. Dietrich CF, Schuessler G, Trojan J, Fellbaum C, Ignee A.
Differentiation of focal nodular hyperplasia and hepatocel-
lular adenoma by contrast-enhanced ultrasound. Br J Radiol
2005;78:704–7.
10. Nishiura T, Watanabe H, Ito M, Matsuoka Y, Yano K,
Daikoku M, et al. Ultrasound evaluation of the fibrosis
stage in chronic liver disease by the simultaneous use of
low and high frequency probes. Br J Radiol 2005;78:189–97.
11. Duck FA. Ultrasound exposure measurement: a hidden
science? Br J Radiol 2005;78:289–91.
12. IEC Standard 60601-2-37. Medical electrical equipment –
particular requirements for the safety of ultrasound medical
diagnostic and monitoring equipment. Geneva:
International Electrotechnical Commission, 2002.
13. Dendy P. Low dose radiation risk: UKRC 2004 debate. Br J
Radiol 2005;78:1–2.
Editorial
186 The British Journal of Radiology, March 2006](https://image.slidesharecdn.com/026britishjournalofradiology-britishinstituteofradiology-2006-130913065550-phpapp02/75/British-Journal-of-Radiology-British-Institute-of-Radiology-2006-eng-190-2048.jpg)

![COMMENTARY
New directions in ultrasound: microbubble contrast
V R STEWART, MRCP, FRCR and P S SIDHU, MRCP, FRCR
Department of Radiology, King’s College Hospital, Denmark Hill, London SE5 9RS, UK
Received 19 July 2005
Revised 23 September
2005
Accepted 5 October 2005
DOI: 10.1259/bjr/17790547
’ 2006 The British Institute of
Radiology
Ultrasound is the most frequently performed ‘‘tomo-
graphic’’ imaging technique which befits the perception
of ultrasound as being a low cost, safe and accessible
imaging modality. Widely used as a ‘‘screening’’ tool,
particularly in liver imaging, ultrasound is often per-
ceived as inferior to other imaging modalities such as CT
and MRI in diagnostically challenging clinical situations.
Both CT and MR imaging techniques make use of well
established contrast agents to improve the image and
hence the diagnostic potential, but with the burden of
increased radiation with CT and cost with both CT and
MRI. With such widespread utilization of ultrasound, it
remains an enigma that until recently ultrasound had no
effective contrast agent to improve imaging. The advent
of microbubble contrast has brought new possibilities
and, not surprisingly, recent advancement of ultrasound
has been driven by research into the properties and
clinical application of microbubble contrast agents.
An overview of the physical properties of microbubble
agents and the interaction of the microbubbles with
sound waves that produce image contrast improvement
is presented in this commentary. In addition, current
established clinical use is detailed and areas of potential
utilization are discussed.
Microbubble contrast properties
Ultrasound contrast as a concept was first observed in
cardiology practice, rather fortuitously, when it was noted
on echocardiography that small air bubbles surrounding a
catheter tip placed in the left ventricle during cardiac
catheterization produced transient high reflections [1].
Over the decades research into producing ‘‘bubbles’’ for
use as an ultrasound contrast agent was hampered by the
need to produce bubbles that were stable in the circulation,
traversed the pulmonary circulation to allow recirculation
and inert to the recipient. Technological advances over
the last 20 years have allowed microbubbles with the
necessary characteristics to be developed and, impor-
tantly, to be diagnostically useful [2].
In order to achieve transpulmonary recirculation and to
be an effective contrast agent, the microbubbles need to
pass through the smallest vascular component, the
capillary system, intact. The ideal diameter for this to
occur is between 2 mm and 8 mm, below that of red blood
cells. Enhancement life-time of the microbubble, often
several minutes in the circulation, is a manifestation of
microbubble design. Microbubble stability is increased by
external bubble encapsulation (galactose, phospholipids,
denatured albumin or poly-butyl-cyanoacrylate) with or
without surfactants and using gases with a low diffusion
coefficient (perfluorocarbons) or a combination of both [3].
The gas components of the microbubbles are normally
eliminated via the lungs whilst the stabilizing components
are eliminated via the hepato-renal route [4].
Currently the agents in clinical use are LevovistH
(Schering AG, Berlin, Germany; air with a galactose/
palmitic acid surfactant), SonoVueH
(Bracco SpA, Milan,
Italy; sulphur hexachloride with a phospholipid shell),
OptisonH
(Nycomed/Amersham, Oslo, Norway; octa-
fluoropropane with an albumin shell), ImagentH
(Alliance Pharmaceutical, CA; perflexane lipid micro-
sphere) and DefinityH
(Bristol-Meyers-Squibb, NY; octa-
fluoropropane with a lipid shell). A newer agent is
CARDIOsphereH
(Point Biomedical, CA; bilayer poly-
mer/albumin shell containing nitrogen) developed for
use in cardiology.
Ultrasound techniques to exploit microbubble
contrast properties
Microbubbles behave as echo enhancers, by expanding
and contracting to create backscatter, on exposure to an
ultrasound beam of any frequency. Microbubbles perform
this task supremely well and increase the backscatter by
.300 fold. Resonance of the microbubble will occur when
there is a specific relationship between the bubble size
and the ultrasound frequency (about 3 MHz). At lowAddress correspondence to Dr Paul S Sidhu
The British Journal of Radiology, 79 (2006), 188–194
188 The British Journal of Radiology, March 2006](https://image.slidesharecdn.com/026britishjournalofradiology-britishinstituteofradiology-2006-130913065550-phpapp02/75/British-Journal-of-Radiology-British-Institute-of-Radiology-2006-eng-192-2048.jpg)
![ultrasound beam power the expansion and contraction is
symmetrical, therefore the bubbles oscillate in a ‘‘linear’’
fashion and the frequency of the scattered signal is
unaltered. At higher power the microbubbles behave in
‘‘non-linear’’ fashion as they resist contraction under
positive pressures more than expansion under negative
pressures. The ‘‘non-linear’’ response results in emission of
harmonics which are specific to the microbubbles. These
harmonics occur within the range 1–20 MHz. The micro-
bubble vibration may include both higher harmonics of the
fundamental ultrasound frequency (2f, 3f, 4f etc.) and sub-
harmonics (mostly f/2). The lower limit of 1 MHz relates to
sub-harmonic generation when operating at 2 MHz. The
upper limit is arbitrary, and could in principle extend
much higher than 20 MHz. In practice the upper limit is
constrained by the working bandwidth of the transducer.
The bandwidth extends over a sufficient range of frequen-
cies to enable the generated harmonics to be detected. This
is typically not broad enough to detect more than the
second harmonic (and sub-harmonics if needed), although
other harmonics certainly exist in the backscattered signal.
However, this will enable preferential imaging of micro-
bubbles compared with the surrounding tissues.
Further increases in pressure cause the microbubbles to
burst resulting in a strong non-linear echo, but this effect is
transient and no further diagnostic information can be
obtained until there is reperfusion of the area by intact
microbubbles [2, 5, 6]. By imaging with a low mechanical
index (MI) that allows for a non-linear response the
amount of microbubble destruction is minimized, prolong-
ing the effective period for diagnostic imaging. The MI
(scaled by pulse amplitude and calculated from the peak
rarefaction acoustic pressure and centre frequency) was
conceived as a safety indicator of the potential for
cavitation. It has been found useful as an approximate
indicator to distinguish between high MI and low MI
regimens of microbubble contrast use, although there are
quantitative deficiencies for this application.
To process the resultant signal from the microbubbles,
new techniques are necessary which selectively display
the non-linear response from the contrast microbubbles
preferentially. Pulse inversion harmonic imaging relies
on the different behaviour of microbubbles exposed to
consecutive pulses of inverted phase; linear signals from
normal tissue cancel out whilst non-linear signals from
microbubbles summate to produce an image [7]. Pulse
inversion harmonic imaging requires the use of a
broader transmit and receive bandwidth [8].
Another phenomenon observed with certain microbub-
ble contrast agents (LevovistH and SonazoidH, an agent not
licensed) is the display of a late delayed phase in the liver,
with signal displayed from stationary microbubbles.
Uncertainty surrounds the exact reason for the persistence
of microbubbles in the liver (and in the spleen, where
SonoVueH also demonstrates this phenomenon [9]); spec-
ulation is that the microbubbles are trapped in the liver
sinusoids [10] or actively taken up by the reticuloendothe-
lial system [11]. This phase occurs at approximately 2 min
and lasts for a variable period of time; about 3 further
minutes with LevovistH and is best imaged with a
‘‘destructive’’ mode using high machine power with
velocity 2D colour Doppler. This method, known as
stimulated acoustic emission (or loss of correlation mode),
results in a transient colour mosaic in liver tissue contain-
ing normal cells and a ‘‘black-hole’’ in malignant tissue
containing no normal liver cells [12, 13]. This method of
imaging microbubble contrast in the liver, excellent for
detecting the presence of liver metastasis, is less favoured
by radiologists in comparison with low mechanical MI
techniques (Figure 1).
Clinical applications of microbubble contrast
All the licensed microbubble agents are injected
intravenously and do not cross cell membranes, remaining
in the intravascular compartment, a distinct difference
from other radiological contrast media. Microbubbles
therefore give information on the vascularity and enhance-
ment characteristics of a tissue rather than the functional
properties; application is directed towards this unique
feature. As microbubble contrast can be delivered under
(a) (b)
Figure 1. (a) A B-mode image of the right lobe of the liver obtained at 3 min 6 s following the administration of LevovistH.
There is an indeterminate heterogeneous area (between arrows) that is poorly defined but suspicious of malignancy in a patient
with a known primary tumour outside the liver. (b) Using a late-phase destructive mode (Agent Detection Imaging, ADIH;
Siemens, Mountain View, CA), there is transient destruction of the microbubble contrast agent in normal liver tissue, but
absence of microbubble contrast in the tumour appears as ‘‘two-black holes’’ (arrow).
Commentary: Microbubble contrast
The British Journal of Radiology, March 2006 189](https://image.slidesharecdn.com/026britishjournalofradiology-britishinstituteofradiology-2006-130913065550-phpapp02/75/British-Journal-of-Radiology-British-Institute-of-Radiology-2006-eng-193-2048.jpg)
![real time ultrasound observation it may provide additional
information to CT and MRI.
Established clinical applications
The first applications for the use of microbubble
contrast were cardiac, where there are established
clinical practices; these applications are outside the remit
of the current review and will not be discussed.
Microbubble contrast has been widely used in imaging
of solid organs, particularly the liver where it has a
number of established applications. The original applica-
tion for these agents was in ‘‘Doppler rescue’’, with
improvement in detection of colour Doppler signal from
large vessels, particularly the portal vein and hepatic
artery in transplantation [14–16] and in documentation of
abnormal vessels in liver tumours [17]. With the advent
of low MI imaging coupled with pulse inversion
techniques, liver tumour imaging is now relatively
sophisticated, precipitating a consensus publication of
guidelines for identifying contrast enhancement patterns
in various focal liver tumours [18].
In lesions where there are distinctive enhancement
patterns, microbubble contrast enables accurate characteri-
zation of lesions so that more expensive, time-consuming
examinations do not need to be performed. Recent
studies have demonstrated characterization of liver
lesions to be accurate in 85–96% of cases in distinguishing
benign from malignant lesions [13, 19, 20]. Benign lesions
tend to enhance in the arterial phase and retain micro-
bubble contrast through the different vascular phases
(arterial 10–35 s, early portal-venous 30–120 s and late
portal-venous phases .120 s after administration)
(Figure 2) [20].
(a)
(c)
(b)
Figure 2. (a) A well demarcated tumour in the right lobe of the liver (arrow) on B-mode imaging. (b) Image of the same tumour
obtained at 18 s (arterial phase) following the administration of SonoVueH
, and using a low mechanical index imaging
technique (Cadence Contrast Pulse Sequencing, CPSH
; Siemens, Mountain View, CA), demonstrates prominent arterial signal
within the tumour. (c) Image of the same tumour at 60 s (portal-venous phase) demonstrating complete in-filling; the
appearances are in keeping with a benign tumour and representative of an area of focal nodular hyperplasia.
V R Stewart and P S Sidhu
190 The British Journal of Radiology, March 2006](https://image.slidesharecdn.com/026britishjournalofradiology-britishinstituteofradiology-2006-130913065550-phpapp02/75/British-Journal-of-Radiology-British-Institute-of-Radiology-2006-eng-194-2048.jpg)
![Benign lesions often have characteristic enhancement
patterns, such as peripheral nodular enhancement in
haemangioma and homogeneous arterial enhancement
with a central ‘‘spoke wheel’’ arterial pattern in focal
nodular hyperplasia [20]. Metastases have variable
enhancement patterns and may be hypovascular or
hypervascular on the arterial phase following micro-
bubble contrast administration, often displaying periph-
eral rim enhancement. On the portal-venous phase
images, the enhancement fades and the metastases
become of decreased reflectivity compared with normal
hepatic parenchyma [19]. This appearance is accentuated
by those microbubble contrast agents which display the
late delayed phase of imaging in the liver when, at
between 2 min and 5 min, increased conspicuity of focal
lesions against the enhancing normal liver tissue is
observed with a ‘‘destructive’’ mode using high machine
power [13, 19]. However, confusion may arise if imaging
is performed in the late delayed phase only. Multiple
hepatic abscesses [21] or the rare biliary hamartomas [22]
may present as focal areas of low reflectivity, mimicking
metastases on a microbubble contrast ultrasound study;
the only difference being a complete absence of vessels
centrally in these two conditions if imaged with low MI
techniques through all the vascular phases.
The application of intraoperative ultrasound during
surgery for resection of metastases identifies metastases
that were not seen on any form of pre-operative imaging,
and changes management in 50% of cases [23]. Any
further improvement on this would be useful; prelimin-
ary results suggest that microbubble contrast ultrasound
demonstrates increased sensitivity and a capability of
detecting lesions as small as 2–3 mm in diameter
allowing improved outcome of patients undergoing
‘‘curative’’ metastasis resection [23, 24].
A number of ablation treatments (including ethanol,
cryotherapy, high-intensity focused ultrasound and
radiofrequency ablation) are employed in the manage-
ment of malignant disease within the liver when the
patient is not suitable for surgical resection or transplan-
tation. Currently, radiofrequency ablation is receiving
the most attention. In most situations ultrasound is the
modality of choice for implementing this therapy,
predominantly as it allows real time visualization of
electrode placement. The outcome of radiofrequency
ablation is dependent on attaining a successful ‘‘tumour-
free’’ margin and complete necrosis of the tumour itself
[25]. Performing biphasic CT or contrast enhanced MRI
periprocedure is relatively impractical in delineating this
margin, but microbubble contrast readily demonstrates
residual tumour enhancement. Ablation therapy fol-
lowed by imaging 10 min post-procedure will demon-
strate residual tumour as an irregular margin that
maintains the enhancement pattern seen prior to ablative
therapy, different to the rim of enhancement seen post-
ablation on CT thought to represent reactive hyperaemia
[26]. If performed following ablation, microbubble
contrast allows immediate further therapy if required,
decreasing the number of treatment sessions.
Microbubble contrast originally developed for Doppler
rescue remains invaluable in demonstrating vessel patency,
firmly established in such diverse areas as transcranial
Doppler, echocardiography, liver transplantation and in
the diagnosis of renal artery stenosis [5, 6, 16, 27, 28].
Microbubble contrast has also found a niche outside
the vascular compartment in the setting of vesico-
ureteric reflux in children where a high sensitivity and
specificity compared with conventional micturating
cystourography (MCUG) has been demonstrated [29].
In a study comparing conventional MCUG with a
microbubble contrast examination, a significant number
of children were up-graded from a grade 1 reflux on
MCUG to a grade 2; with management and prognostic
implications [30]. The advantage of avoiding ionizing
radiation is obvious, although the procedure remains
invasive.
Potential clinical applications
Whilst most applications for ultrasound contrast are
established in the liver, further uses are developing in
other areas.
A number of groups have investigated the utility of
microbubble contrast as an adjuvant to the FAST scan
(Focused Assessment Sonography in Trauma) in blunt
abdominal trauma [31–34]. Non-enhanced FAST scan-
ning is able to ‘‘triage’’ patients with blunt abdominal
trauma accurately; patients with negative imaging
virtually never need surgical intervention [35]. The
addition of microbubble contrast to the examination
would increase the confidence of the operator in the face
of a negative examination. The most likely role of
microbubble contrast in blunt abdominal trauma would
be the ability to assess patients more accurately in order
to expedite the most appropriate management whether
this is surgery, further imaging with CT or observation
alone.
The role of ultrasound, colour Doppler ultrasound and
microbubble contrast ultrasound in detecting breast
carcinomas is yet to be fully established. There is a
suggested role for colour Doppler ultrasound in the
differential diagnosis of breast disease [36, 37]. Studies
have demonstrated an increased sensitivity in vascular-
ity with microbubble contrast, but with conflicting views
on the specificity of differentiating benign and malignant
lesions [38, 39]. These studies were performed with
conventional machine settings, but as the newer harmo-
nic and phase inversion techniques develop, analysis of
breast masses with microbubble contrast may become a
useful tool. A study used microbubble contrast in the
evaluation of radiofrequency ablation in breast tumours
with some success, a similar use as with radiofrequency
ablation of liver tumours [40].
One of the goals of treatment of any cancer is the
identification of disease involvement of the sentinel node
– the first node to drain a tumour into the lymphatic
system. This predicts the need to remove the regional
lymph nodes. Microbubble contrast may play a role in
this scenario; sentinel nodes in swine models with
melanoma demonstrated sentinel node enhancement in
28 of 31 sentinel lymph nodes, some within seconds of
peritumour injection of microbubble contrast. The
authors, using low MI greyscale pulse-inversion imag-
ing, also demonstrated signal voids within the lymph
nodes representative of intranodal metastasis with 95%
sensitivity [41]. This method of sentinel node detection is
as good as alternative techniques without the adverse
Commentary: Microbubble contrast
The British Journal of Radiology, March 2006 191](https://image.slidesharecdn.com/026britishjournalofradiology-britishinstituteofradiology-2006-130913065550-phpapp02/75/British-Journal-of-Radiology-British-Institute-of-Radiology-2006-eng-195-2048.jpg)
![effects of these established techniques; blue dye is
invasive, has a relatively high rate of allergic reaction
and a technical failure rate of 20%, whereas technetium
99m scintigraphy has a reported failure rate of 12% [42].
Both these techniques may detect non-sentinel nodes
(false-positive), leading to unnecessarily extensive nodal
dissection. Another group have successfully developed a
specific microbubble that targets lymph nodes, using the
stimulated acoustic emission ultrasound imaging
method [43]. Further studies are required to fully
evaluate these techniques with application, particularly
within the axilla of breast cancer patients, an important
potential clinical use [44].
Another interesting area for clinical use of microbub-
ble contrast is in musculoskeletal ultrasound for the
demonstration of synovitis. MRI of joints, although
informative and accurate, is not readily accessible to
provide an ‘‘on-demand’’ clinical service that patients
with inflammatory synovitis require for rapid diagnosis
and disease management. More pertinent is the better
resolution capability of ultrasound in comparison with
MRI especially in the smaller joints. Ultrasound can
accurately differentiate between joint fluid and syno-
vium, except in the presence of echogenic joint fluid,
when the addition of microbubble contrast may help
[45]. The addition of microbubble contrast to the
ultrasound examination of the synovium will demon-
strate ongoing or recurrence of inflammation by asses-
sing the increase of vascular enhancement; which may be
of promise in the small joints of the hand [46].
A further important clinical use for microbubble
contrast is in vascular ultrasound, applicable in parti-
cular to the carotid circulation in the management of
cerebrovascular disease. Numerous studies have estab-
lished the importance of assessing the degree of
narrowing of the internal carotid artery in relation to
symptoms in order to ascertain the need for surgical or
increasingly radiological intervention [47, 48].
Ultrasound is highly accurate in assessing the degree of
stenosis of the internal carotid artery, far more cost-
effective than other imaging modalities and much more
‘‘patient-friendly’’. However, there remain instances of
ultrasound limitation. Ordinary colour Doppler micro-
bubble contrast enhanced examinations are problematic
as a consequence of artefacts, most notably ‘‘blooming’’
[49]. Technical advances with high frequency linear
transducers, coupled with the newer harmonic imaging
techniques, has allowed improvements in lumen deli-
neation without the need to use colour Doppler ultra-
sound. The images produced are likened to ‘‘ultrasound
angiograms’’ as they clearly display the outer and inner
luminal margins of the vessel allowing precise assess-
ment of intima-media thickening, atheromatous plaques,
ulceration and areas of marked stenosis [50].
The use of microbubble contrast in gene therapy and
targeted delivery of drugs is an area of active research,
where microbubbles are engineered to carry antibodies
or DNA to target tissues [51]. With gene therapy, a
particular area that shows promise is skeletal muscle [52,
53]. Ultrasound enhances gene transfer by increasing cell
permeability, termed ‘‘sonoporation’’ a process enabled
by microbubble contrast, believed to occur by lowering
the threshold for ultrasound bioeffects [54]. Interestingly
the type of microbubble may influence the rate of gene
transfection, with the perfluorocarbon microbubbles
(OptisonH
in this study) the most efficient [55]. There is
even a suggestion that perfluorocarbon microbubbles
may promote gene transfection without the need for
ultrasound [56].
Safety
Microbubble contrast agents approved for clinical use
are well tolerated with serious side-effects rarely
observed, predominantly minor in nature (headache,
nausea) which are invariably self limiting [57].
Generalized allergy-like reactions occur rarely [58].
There is the possibility of bioeffects arising from the
use of microbubble agents; microvascular rupture can
occur where gas bodies are insonated [18]. This may be
problematic in areas of sensitivity such as the retina and
the brain when imaged through the open fontanelle. A
further concern is the development of premature
ventricular contractions when high MI end systolic
triggering is specifically used in echocardiography but
not with other applications [59].
Conclusion
Ultrasound microbubble contrast already has estab-
lished uses in the liver as a Doppler rescue agent and
further applications are constantly being developed. It is
likely that administration will eventually become routine
in day to day practice as is the situation in a number of
European countries (Italy, Germany and Spain) and
Japan (soon to be followed by China) where the
microbubble agents are licensed and there is enthusiasm
among the ‘‘imagers’’. The UK has been slower in the
uptake of using microbubble contrast for a number of
reasons [60]. However, the imagers in the USA can only
admire from a distance the advances made in the clinical
application of microbubble contrast agents by their
European and Asian counterparts; only limited off-
licence use of these agents for abdominal imaging is
endorsed.
References
1. Gramiak R, Shah PM. Echocardiography of the aortic root.
Invest Radiol 1968;3:356–66.
2. Harvey CJ, Blomley MJK, Eckersley RJ, Cosgrove DO.
Developments in ultrasound contrast media. Eur Radiol
2001;11:675–89.
3. Correas JM, Bridal L, Lesavre A, Mejean A, Claudon M,
Helenon O. Ultrasound contrast agents: properties, princi-
ples of action, tolerance, and artifacts. Eur Radiol
2001;11:1316–28.
4. Greis C. Technology overview: SonoVue. Eur Radiol Suppl
2004;14:P11–P15.
5. Blomley MJK, Cooke JC, Unger EC, Monaghan MJ,
Cosgrove DO. Microbubble contrast agents; a new era in
ultrasound. BMJ 2001;322:1222–5.
6. Leen E. Ultrasound contrast harmonic imaging of abdom-
inal organs. Semin Ultrasound CT MRI 2001;22:11–24.
7. Simpson DH, Chin CT, Burns PN. Pulse inversion Doppler:
a new method for detecting nonlinear echoes from
microbubble contrast agents. IEEE Trans Biomed Engin
1999;46:372–82.
V R Stewart and P S Sidhu
192 The British Journal of Radiology, March 2006](https://image.slidesharecdn.com/026britishjournalofradiology-britishinstituteofradiology-2006-130913065550-phpapp02/75/British-Journal-of-Radiology-British-Institute-of-Radiology-2006-eng-196-2048.jpg)


![Enhanced biological effectiveness of low energy X-rays and
implications for the UK breast screening programme
1
G J HEYES, PhD, 2
A J MILL, PhD and 2
M W CHARLES, PhD, DSc
1
Department of Medical Physics, University Hospital Birmingham NHS Foundation Trust,
Birmingham B15 2TH and 2
Radiation Biophysics Group, School of Physics and Astronomy, The
University of Birmingham, Birmingham B15 2TT, UK
ABSTRACT. Recent radiobiological studies have provided compelling evidence that the
low energy X-rays as used in mammography are approximately four times – but possibly
as much as six times – more effective in causing mutational damage than higher energy
X-rays. Since current radiation risk estimates are based on the effects of high energy
gamma radiation, this implies that the risks of radiation-induced breast cancers for
mammography X-rays are underestimated by the same factor. The balance of risk and
benefit for breast screening have been re-analysed for relative biological effectiveness
(RBE) values between 1 and 6 for mammography X-rays. Also considered in the analysis
is a change in the dose and dose-rate effectiveness factor (DDREF) from 2 to 1, women
with larger than average breasts and implications for women with a family history of
breast cancer. A potential increase in RBE to 6 and the adoption of a DDREF of unity
does not have any impact on the breast screening programme for women aged 50–
70 years screened on a 3 yearly basis. Situations for which breast screening is not
justified due to the potential cancers induced relative to those detected (the detection-
to-induction ratio (DIR)) are given for a range of RBE and DDREF values. It is concluded
that great caution is needed if a programme of early regular screening with X-rays is to
be used for women with a family history of breast cancer since DIR values are below 10
(the lowest value considered acceptable for women below 40 years) even for modest
increases in the RBE for mammography X-rays.
Received 19 April 2005
Revised 23 June 2005
Accepted 24 June 2005
DOI: 10.1259/bjr/21958628
’ 2006 The British Institute of
Radiology
There is increasing evidence from radiobiology studies
[1–3] that the low energy X-rays used for mammography
breast screening are more effective in inducing biological
damage than higher energy X-rays. Risk estimates for
radiation-induced cancer – principally derived from the
atomic bomb survivor study (ABSS) – are based on the
effects of high energy c-rays and thus the implication is
that the risks of radiation-induced breast cancer arising
from mammography may be higher than that assumed
based on standard risks estimates. As with any clinical
examination, the radiological breast screening pro-
gramme must be justified, in that the risk associated
with the exposure must be greatly outweighed by the
potential gain to a patient as a result of a the procedure.
This is particularly so for breast screening since the
large majority of women undergoing mammography
are asymptomatic. Thus, while the radiation dose to
the breast can be accurately measured and kept as low
as reasonably practicable, the risk associated with this
dose, and therefore the risk-benefit ratio is less well
known.
The most recent and relevant radiobiology studies
have utilized the immortalized human cell line desig-
nated CGL1 in which the transformation frequencies
induced by low energy X-rays were compared with
the effects of higher energy X-rays, c-rays and electrons.
In particular, in one study [1] a direct comparison
between 29 kVp X-rays, generated using a clinical
mammography unit, and radiation simulating the atomic
bomb spectrum at Nagasaki was made. The best estimate
of the limiting (low-dose) relative biological effectiveness
(RBEM) of 29 kVp X-rays compared with the atomic
bomb spectrum radiation was found to be 4.42¡2.02.
While it is recognized that there can be limitations in
directly extrapolating data obtained in vitro to carcino-
genesis in vivo, these results provide strong evidence that
the radiation risks from mammography may be under-
estimated by a factor of approximately four, and possibly
as high as six. In this paper we re-analyse the balance
of risk and benefit for breast screening using the methods
of Law and Faulkner [4, 5] based on these higher values
of the RBE of mammography energy X-rays.
The National Health Service Breast Screening
Programme
The National Health Service Breast Screening
Programme (NHSBSP) was started in the UK in 1988 in
an attempt to reduce mortality from breast cancer. The
programme has been largely successful, with the
International Agency for Research on Cancer (IARC)
concluding that breast screening by mammography of
women aged between 50 years and 69 years reduces
mortality from breast cancer by 35% [6]. It is clear that aThis work was supported by EPSRC grant RRAH07673.
The British Journal of Radiology, 79 (2006), 195–200
The British Journal of Radiology, March 2006 195](https://image.slidesharecdn.com/026britishjournalofradiology-britishinstituteofradiology-2006-130913065550-phpapp02/75/British-Journal-of-Radiology-British-Institute-of-Radiology-2006-eng-199-2048.jpg)
![breast screening programme does save lives. However,
such a widespread (two million women screened per
year in the UK in seven screening rounds) use of a
radiological examination in asymptomatic women needs
to be treated with some caution. The risks associated
with such a programme need to be properly evaluated,
especially since there are moves both in the UK and
elsewhere to extend the use of mammography to a wider
section of the population. Current guidelines for the
NHSBSP in the UK are for two-view radiological
examinations for women aged between 50 years and
70 years with a frequency of every 3 years [7]. An
average mean glandular dose (per two-view screening
examination) of 4.5 mGy is used for the purpose of
benefit-risk analysis [8]. The UK is considering expand-
ing the screening programme to include younger
women (currently considering a minimum age of
40 years). The intention of this NHSBSP ‘‘UK Age-trial’’
with women without family history [8] is to screen
women annually from 40 years to 47 years. Such an
increase in the screening lifetime will clearly increase
the cumulative dose. The frequency of this age trial
means that women will in fact receive a higher dose in
the age trial (10 screening rounds) than they would in
the normal screening programme (seven screening
rounds). Just by attending this age trial, women will
therefore more than double the lifetime absorbed dose
to the breast. The effect is magnified, since the
screening of younger, denser breasts can increase the
dose required to produce the required film exposure by
approximately 15–20% [9]. Since the risks of radiation-
induced breast cancer are age-dependent [9], younger
breasts are also more susceptible to radiation-induced
cancers, thus compounding the increased risk even
further.
The NHSBSP report [8] also highlights a ‘‘high dose
subgroup’’ population: a proportion of women who
receive a higher than average mean glandular dose. This
increase in dose may be due to the use of difficulties
with imaging equipment or to higher than average
breast tissue thickness under compression. The mean
glandular dose for this subgroup is 21.4 mGy per two-
view examination [8]. This high dose subgroup is
estimated to account for 0.1% of the screened population.
However, this figure is set to increase with increasing
breast size of the UK population. Over the course of the
screening programme (seven two-view sessions) a
woman in the high dose subgroup can expect to receive
a mean glandular dose of more than 170 mGy. It is likely
that an age trial will be targeted at women who are
judged to be at an increased risk of breast cancer. Such
women are identified if (amongst other reasons) there is
a family history of breast cancer (thought to be the most
important factor) or if they are obese (and are therefore
also likely to be in the high-dose subgroup). Women
with a family history of breast cancer are thought
most at risk of developing the disease, since about 10%
of breast cancers are thought to have a genetic basis.
These women may be deficient in one of the known
breast cancer suppressor genes, BRCA1 and BRCA2.
Such a gene deficiency may well increase the suscepti-
bility of a woman to develop a radiation-induced
tumour, since the number of targets in each cell requiring
damage is reduced. The radiation risk for this sensitive
subgroup may therefore be significantly greater than the
risks associated with the average UK population.
Currently these risks are poorly understood, and this
paper seeks to highlight the need for caution if
mammography breast screening is to be used in this
subgroup.
In the NHSBSP, the risks associated with mammo-
graphy doses are calculated from various epidemiologi-
cal sources [8]. The source includes data from North
American women who were given high doses of
radiation for medical reasons (e.g. X-ray therapy for
acute post-partum mastitis and multiple sessions of
direct fluoroscopy for tuberculosis, mostly during the
1930s and 1940s). In addition to being a high-dose
population, the North American women were exposed to
therapy energies of X-rays, highlighting the importance
of calculating the efficacy in inducing cell damage by
lower energy X-ray radiation. ABSS data are considered,
but not used in the calculations of risk. The justification
for the omission of the ABSS is [8] that since Japanese
women ‘‘have a markedly lower natural incidence of
breast cancer than women from western counties such as
the UK and USA…’’ it is ‘‘difficult to transfer radiation
risks between these two populations.’’ Published risk
figures for potential cancer inductions varying with age
of exposure to X-rays are available [4]. Using these data,
with the published values of breast cancers detected in
the UK screening programme (NHS report) the ratio of
cancers detected to those induced by the mammography
dose (detection to induction ratio (DIR)) can be calcu-
lated. The use of the DIR is not a true measure of the
benefit-risk ratio, but it is an indication of its likely
magnitude. An examination of the relationship of these
two ratios [4] has shown that the difference between
them is likely to be as little as 15–20%. A DIR of 100 is
considered to be ample, whilst a ratio of 10 is considered
to be sufficient in terms of justifying the use of a
radiological exposure [5].
The effect of a higher RBE for mammography
X-rays
The in vitro cell transformation data from Heyes and
Mill [1] suggest a best estimate for the RBE of
mammography X-rays of approximately 4 with 90%
confidence intervals in the range 2 to 6. Table 1 presents
the cancer induction-rates for the UK population that are
assumed in the NHSBSP. Table 2 then presents the
number of induced cancers for a range of RBE values
from 1 (as assumed in the NHSBSP) to 6 (an approximate
upper limit based on the latest in vitro data). In Table 3
the DIR values are given. The data given in Tables 2 and
3 are for women screened once every 3 years in the UK
NHSBSP and include those in the high dose sub group as
well as the ‘‘normal’’ group of women. Using an RBE of 1
for mammography X-rays, as used by the NHSBSP, the
DIR falls below 100 only when the screening age is below
55 years. With an RBE value of 2, the DIR falls below 100
for all screening ages below 65 years. For higher values
of the RBE, all values of DIR lie below 100. For women in
the high dose sub group DIR values are clearly much
lower.
G J Heyes, A J Mill and M W Charles
196 The British Journal of Radiology, March 2006](https://image.slidesharecdn.com/026britishjournalofradiology-britishinstituteofradiology-2006-130913065550-phpapp02/75/British-Journal-of-Radiology-British-Institute-of-Radiology-2006-eng-200-2048.jpg)
![Dose and dose-rate effectiveness and the breast
screening programmes in the UK and USA
According to the dual action theory of radiation
damage, the dose response should be linear at low
doses. At higher doses and dose-rates, multiple track
events become important, thereby bending the dose
response upwards. As a result, the response per unit
dose at low doses will be overestimated if a linear
extrapolation is made from observations at high doses.
The degree of overestimation is expressed in terms of a
dose and dose-rate effectiveness factor (DDREF). A
DDREF of 2 is used in the NHSBSP [6]. However, the
US Environmental Protection Agency (EPA) advocates a
DDREF value of 1 for breast cancer [10] and risks based
on a DDREF of 1 are twice those calculated by the
NHSBSP. The EPA states that there is epidemiological
evidence that dose-fractionation has little or no effect on
risk to the breast [10], and that a DDREF of unity should
be adopted.
If the DDREF for breast cancer is unity, as advocated
by the American EPA, the DIR falls below 100 with an
RBE of 1 for all screening ages below 65 years. If the RBE
is increased, the DIR is below 100 for all ages, and would
even fall below 10 for a screening age of 50–54 years if a
‘‘worst case scenario’’ RBE of 6 is considered. DIR values
for a DDREF of unity are exactly one half of the values
given in Table 3.
Screening of women with a family history of
breast cancer
The National Institute for Clinical Excellence (NICE)
[11] considers the efficacy of early screening of women
with a family history of breast cancer. Whilst most of the
studies listed as research literature evidence (section
7.2.2 of [11]) conclude regular, early screening sessions
would lead to an increase in tumour detection, very little
mention is made to the potential of women with a
genetic disorder being more susceptible to radiation-
induced breast tumour. One study [12] even concluded
that mammography was relatively insensitive to detect-
ing tumours in women with BRCA1/2 mutations, and
that other forms of detection were likely to be more
beneficial to this high risk group.
Law et al [4] have published the detection/incidence
ratio for younger women (aged 25–49 years) with a
Table 1. Total number of breast cancers induced per million
women screened per mGy absorbed for women of different
ages (after Law et al [4])
Age (years) Total breast cancers induced per million
women exposed per mGy
25–29 18.4
30–34 18.2
35–39 17.8
40–44 16.6
45–49 15.0
50–54 13.2
55–59 11.5
60–64 9.4
65–70 7.4
Table 3. Estimated ratio of cancer detection to induction (DIR) for women in the normal (N) and high dose (H) groups screened
3 yearly in the NHSBSP
Age (years) Ratio detected/induced (DIR)
Normal group (N) High dose subgroup (H)
RBE51 RBE52 RBE54 RBE56 RBE51 RBE52 RBE54 RBE56
50–54 89 45 22 15 18.3 9.1 4.6 3.0
55–59 120 60 30 20 24.5 12.3 6.1 4.1
60–64 182 91 46 30 37.2 18.6 9.3 6.2
65–70 300 150 75 50 61.4 30.7 15.4 10.2
RBE, relative biological effectiveness; DIR, detection to induction ratio; N, normal population; H, high dose subgroup;
NHSBSP, National Health Service Breast Screening Programme.
Table 2. Estimated numbers of cancers detected and induced for women in the normal (N) and high dose (H) groups screened
three-yearly in the NHSBSP
Age (years) Group (N5normal; H5high-dose) Number of cancers per 106
women
detected induced for
RBE51 RBE52 RBE54 RBE56
50–54 N 5.36103
59 119 238 356
H 290 581 1162 1742
55–59 N 6.26103
52 104 208 311
H 253 506 1012 1518
60–64 N 7.76103
42 85 169 254
H 207 414 827 1241
65–70 N 106103
33 67 133 200
H 163 326 651 977
RBE, relative biological effectiveness; N, normal population; H, high dose subgroup; NHSBSP, National Health Service Breast
Screening Programme.
Implications of an increased RBE for UK mammography screening
The British Journal of Radiology, March 2006 197](https://image.slidesharecdn.com/026britishjournalofradiology-britishinstituteofradiology-2006-130913065550-phpapp02/75/British-Journal-of-Radiology-British-Institute-of-Radiology-2006-eng-201-2048.jpg)
![family history of breast cancer screened annually with
two-view mammography. The cancer induction-rates
upon which these values are calculated are shown here
in Table 4. The DIR for women with two index ages are
given in Table 5. When the index patient (mother, sister,
daughter) age is 30–39 years, the ratio of detection to
induction falls below 10 for women with such a family
history if they are screened below the age of 30 years
using an RBE of 2, and below 35 years when the RBE is 4.
The screening age of a woman with a family history
(index age 30–39 years) where the DIR falls below 10 is
45 years for an RBE of 6.
If benefit is to exceed radiation risk in a screening
programme, the ratio of detection to induction (DIR)
should exceed a factor of about 5 [13]. This may not
apply to women below the age of 40 years, for whom the
DIR should exceed 10.
If the index patient is 40–49 years old the detection-
rate is less, and this means the DIR falls below 10 at
higher ages than for the index patient age of 30–39 years.
The DIR falls below 10 in this case if the screening age is
less than 30 years for an RBE of 1, an age less than
35 years for an RBE of 2 and does not exceed 10 for any
screening age if the RBE is greater than or equal to 4.
These results therefore imply that the caution should be
used when considering mammography screening for
women with a history of breast cancer, especially if the
index patient age is greater than 40 years old. Such
women may be carriers of BRCA1 and BRCA2 gene
mutations, and as such may be more susceptible to a
radiation induced tumour.
Discussion
Using a DDREF of 2 and an RBE of unity in the normal
screening programme, only women aged between
50 years and 54 years will have a DIR of less than 100.
If an RBE of 2 is used then the DIR for women in the 50–
54 year range falls to 45 years, and women up to and
including the 60–64 year age range have a DIR of less
than 100. If an RBE of 4 is considered (as suggested from
the in vitro radiobiology results [1]), the DIR is below 100
for women of all ages considered, and has a minimum
value of 22 for women aged between 50 years and
54 years.
Considering a change in DDREF to unity, such as that
used by the American system, the DIR would fall to 11
for the youngest women with an RBE of 4. In the worst
case scenario (RBE56) the DIR falls below 10 for women
between 50 years and 59 years (Table 3).
If the risk of radiation induced tumours can be
justified in terms of maintaining the DIR above 5 for
women over 40 years, then an increase in RBE, even to 6
and a DDREF of unity, would not therefore have an
impact on the use of mammography as a breast screen-
ing tool for the normal 3 yearly screened population of
women aged between 50 years and 70 years since the
lowest DIR calculated in these cases is 7.4 for women
aged between 50 years and 54 years. Younger (50–
54 years) women in the high-dose subgroup are likely
to have a DIR less than 5 if the RBE is significantly
increased from unity. Unfortunately, there are no cancer
detection data upon which to accurately calculate the
DIR for this population. In these calculations the
detection-rates for the high dose subgroup population
have been assumed to be the same as those in the normal
screened population.
In the cases of women with a family history of breast
cancer, women screened annually with two-views from
the age of 25 years are considered. The DIR for such a
population is already reduced, even with a DDREF of 2
and an RBE of unity. The lowest DIR is 6 for the youngest
age range (25–29 years). The effect on a change to the
RBE is most dramatic in this screening group. For these
younger women, the DIR should exceed 10 if the benefit
is to exceed the radiation risk [13]. In fact, an increase in
Table 4. Estimated cancer induction for women in the age
range 25–49 years with a family history of breast cancer
(after Law et al [4]). Annual 2-view screening
Age (years) Total breast cancers induced per 106
women exposed per mGy
25–29 82.8
30–34 81.9
35–39 80.1
40–44 74.7
45–49 67.5
Table 5. Effect of an increase in RBE on the cancer detection/induction ratio for UK women screened annually (two views) with
a family history of breast cancer (values in parenthesis are for a DDREF of 1)
Age (years) Number of cancers detected per 106
women Ratio detected/induced (DIR)
RBE51 RBE52 RBE54 RBE56
(a) Patient Index age530–39
25–29 0.506103
6.0 (3.0) 3.0 (1.5) 1.5 (0.8) 1.0 (0.5)
30–34 1.656103
20.1 (10.1) 10.1 (5.0) 5.0 (2.5) 3.4 (1.7)
35–39 3.356103
41.8 (20.9) 20.9 (10.5) 10.5 (5.2) 7.0 (3.5)
40–44 4.106103
54.9 (27.1) 27.4 (13.7) 13.7 (6.9) 9.1 (4.6)
45–49 4.106103
60.7 (30.4) 30.4 (15.2) 15.2 (7.6) 10.1 (5.1)
(b) Patient Index age540–49
25–29 0.506103
6.0 (3.0) 3.0 (1.5) 1.5 (0.8) 1.0 (0.5)
30–34 0.996103
12.1 (6.0) 6.0 (3.0) 3.0 (1.5) 2.0 (1.0)
35–39 1.656103
20.6 (10.3) 10.3 (5.1) 5.1 (2.6) 3.4 (1.7)
40–44 2.506103
33.5 (16.7) 16.7 (8.4) 8.4 (4.2) 5.6 (2.8)
45–49 2.506103
37.0 (18.5) 18.5 (9.3) 9.3 (4.6) 6.2 (3.1)
RBE, relative biological effectiveness; DDREF, dose and dose rate reduction factor; DIR, detection to induction ratio.
G J Heyes, A J Mill and M W Charles
198 The British Journal of Radiology, March 2006](https://image.slidesharecdn.com/026britishjournalofradiology-britishinstituteofradiology-2006-130913065550-phpapp02/75/British-Journal-of-Radiology-British-Institute-of-Radiology-2006-eng-202-2048.jpg)
![the RBE to just 2 means that women aged 25–34 years
have a DIR less than 10 (with a DDREF of 2). If the RBE
of mammography X-rays is 4, then the entire age range
(25–49 years) of women with a family history of breast
cancer (index age 40–49 years) will have a DIR less than
10 (DDREF52). In this case, the youngest women (age
range 25–29 years) have a DIR of less than 2.0. It is still
only 3.0 (i.e. not justifiable) for this age range if the RBE is
decreased to 2.0.
These comments are summarized in Table 6, where a
DIR of 5 is chosen to be a cut-off, below which a
screening programme could not be justified due to the
potential cancers induced relative to those detected. (For
women under the age of 40 years, a DIR of 10 is used as
the cut-off [13]).
Conclusion
This work suggests great caution should be exercised
if a programme of early, regular screening using X-rays,
is to be used in women with a family history of breast
cancer. The effect of an increase in RBE or DDREF is
most pronounced in younger women screened due to a
family history and women in the high-dose subgroup.
Other methods for detecting tumours at an early stage
are available, and have been considered by NICE [11].
Many studies [14–16] have shown that MRI is more
accurate than mammography in screening young women
with a family history of breast cancer. Such a widespread
use of MRI would, however, place a high burden on
limited NHS resources in the UK, due to the significant
increase in screening cost. A number of studies [12, 17]
have observed that mammography surveillance is less
sensitive in younger women, women with a family
history and BRCA1/2 mutant carrier, a point noted by
NICE [11].
It is recognized that in vitro radiobiological experi-
ments using immortalized cell lines cannot be considered
in isolation or used directly as a basis for reviewing the
breast screening programme. The recently observed high
values of RBE for cancer-related in vitro end-points do,
however, strengthen the long accepted evidence, based
largely on non-cancer end-points, that low energy X-
radiations have larger RBE values than higher energy
photons. Such findings have long been accepted by the
International Commission on Radiological Protection
(ICRP). For general radiological protection situations
the ICRP has, however, maintained a radiation weight-
ing factor of 1 for all low LET radiations (including
electrons and photons of all energies). In specific
situations the ICRP recommends the use of more
appropriate assumptions. The possibility of RBE values
for mammography exposures which are in excess of
the ICRP radiation weighting factors focuses attention on
the results of related epidemiology studies. It widens the
range of possible assumptions which can be used in cost-
benefit analyses to inform the debate regarding exten-
sions to existing screening programmes.
References
1. Heyes GJ, Mill AJ. The neoplastic transformation potential
of mammography X rays and atomic bomb spectrum
radiation. Radiat Res 2004;162:120–7.
2. Frankenberg D, Kelnhofer K, Bar K, Frankenberg-Schwager
M. ERRATA: Enhanced neoplastic transformation by
mammography X rays relative to 200 kVp X rays:
Indication for a strong dependence on photon energy of
Table 6. Situations when breast screening should not be carried out for different RBE and DDREF values – based on a cut-off DIR
value of 5 (10 for women aged 40 years and under) below which screening should not occur
DDREF RBE Breast screening should not occur in women
2 (as assumed in the
UK programme)
2 with a family history of breast cancer and aged between 25 years and 29 years where
the patient index age is 30–39 years; aged between 25 years and 34 years where
the patient index age is 40–49 years
4 (a) with a family history of breast cancer and aged between 25 years and 34 years
where the patient index age is 30–39 years; aged between 25 years and 49 years
where the patient index age is 40–49 years
(b) in the high dose subgroup below 55 years of age
6 (a) with a family history of breast cancer and aged between 25 years and 39 years
where the patient index age is 30–39 years; aged below 44 years where the patient
index age is 40–49 years
(b) in the high dose subgroup below 60 years of age
1 (as used in the USA) 2 (a) with a family history of breast cancer and aged between 25 years and 34 years
where the patient index age is 30–39 years; aged between 25 years and 39 years
where the patient index age is 40–49 years
(b) in the high dose subgroup below 55 years of age
4 (a) with a family history of breast cancer and aged between 25 years and 39 years
where the patient index age is 30–39 years; aged below 49 years where the patient
index age is 40–49 years
(b) in the high dose subgroup below 65 years of age
6 (a) with a family history of breast cancer and aged between 25 years and 44 years
where the patient index age is 30–39 years; aged below 49 years where the patient
index age is 40–49 years
(b) in the high dose subgroup below 65 years of age. (and with caution for older
women, since the DIR is 5.1 for women 65–70 years old)
(c) screened annually from the age of 40 years with two-view mammography
RBE, relative biological effectiveness; DDREF, dose and dose rate reduction factor; DIR, detection to induction ratio.
Implications of an increased RBE for UK mammography screening
The British Journal of Radiology, March 2006 199](https://image.slidesharecdn.com/026britishjournalofradiology-britishinstituteofradiology-2006-130913065550-phpapp02/75/British-Journal-of-Radiology-British-Institute-of-Radiology-2006-eng-203-2048.jpg)

![Comparison of image quality, diagnostic confidence and
interobserver variability in contrast enhanced MR angiography and
2D time of flight angiography in evaluation of carotid stenosis
1
D MITRA, FRCR, 1
D CONNOLLY, FRCR, 1
S JENKINS, FRCR, 1
P ENGLISH, DCR, 1
D BIRCHALL, FRCR,
1
C MANDEL, FRCR, 1
K SHRIKANTH, MD, 2
B GREGSON, PhD and 1
A GHOLKAR, FRCR
1
Department of Neuroradiology, Regional Neurosciences Centre, Newcastle General Hospital,
Westgate Road, Newcastle upon Tyne NE4 6BE and 2
Academic Department of Neurosurgery, School
of Surgical and Reproductive Sciences, University of Newcastle upon Tyne NE1 7RU, UK
ABSTRACT. The aim of this study was to compare image quality, level of diagnostic
confidence and interobserver agreement in assessment of carotid stenosis with contrast
enhanced MR angiography (CE MRA) in comparison with 2D time of flight MR
angiography (2D TOF MRA). 60 carotid arteries in 30 patients were examined by three
observers. Image quality and diagnostic confidence were assessed on the basis of a
visual analogue scale. Interobserver variability was assessed with the help of intraclass
correlation coefficient. Median values on the visual analogue scale for image quality
and diagnostic confidence were higher for CE MRA compared with 2D TOF MRA for all
three observers. Higher intraclass correlation values were recorded for interobserver
variability for CE MRA compared with 2D TOF MRA both for visual estimation of carotid
stenosis as well as for measurement of carotid stenosis on the basis of North American
Symptomatic Carotid Endarterectomy Trial (NASCET) and European Carotid Surgery
Trial (ECST) criteria. CE MRA provides better image quality, higher level of diagnostic
confidence and more interobserver agreement compared with 2D TOF MRA.
Received 3 February 2005
Revised 14 June 2005
Accepted 15 July 2005
DOI: 10.1259/bjr/72842752
’ 2006 The British Institute of
Radiology
An atherosclerotic lesion at the carotid bifurcation is
one of the major causes of ischaemic strokes. The North
American Symptomatic Carotid Endarterectomy Trial [1]
(NASCET) and European Carotid Surgery Trial [2]
(ECST) have demonstrated that surgical intervention is
more beneficial compared with medical management in
symptomatic patients with more that 70% carotid
stenosis. The value of carotid endarterectomy has been
extended to include asymptomatic carotid stenosis
greater than 60% after the Asymptomatic Carotid
Atherosclerosis Study [3] (ACAS). Accurate pre-opera-
tive assessment of the degree of carotid stenosis is
therefore of crucial importance as the benefit of surgery
is not proven in lesser degrees of stenosis.
Conventional catheter angiography (CA) is accepted as
the gold standard in assessment of carotid stenosis and is
the modality used in the measurement of stenosis in
NASCET and ECST trials. However, due to the known
risks of CA (overall 1–2% risk of thromboembolic
complication, risks increasing with age and presence of
generalized atherosclerosis), increasing numbers of
centres are using non-invasive methods for pre-operative
evaluation of carotid stenosis. Doppler ultrasound (DUS)
is routinely used as the screening technique in many
centres. MR angiography (MRA) is another technique,
which is used either to confirm or supplement DUS
findings.
Time of flight MRA (TOF MRA) uses inflow of
unsaturated protons in blood to generate signal within
a blood vessel. However, due to dependence on flow,
TOF MRA is prone to flow related artefacts such as
signal dropout caused by turbulence in a severely
stenosed artery. The technique is also prone to move-
ment artefacts due to relatively long scan time.
Contrast enhanced MRA (CE MRA) uses the T1
shortening effect of intravenous paramagnetic contrast
agent gadolinium to generate the signal. It is, therefore,
less prone to, although not completely free of, the flow
related artefacts in TOF MRA. CE MRA also requires less
scan time and covers a wider field of view, which allows
assessment of the aortic arch and proximal common
carotid arteries.
A number of studies have been carried out to evaluate
specificity and sensitivity of CE MRA using CA as the
gold standard [4–12]. However, there are relatively few
studies [13, 14], which have compared TOF and CE MRA
directly. These latter studies have looked at the compar-
ison of the two techniques in terms of delineation of
morphological details and observer confidence but have
not included interobserver variability assessment. The
aim of the current study is to evaluate the image quality,
diagnostic confidence of the observer and interobserver
variability of the two techniques.
Materials and methods
30 consecutive patients with suspected carotid bifur-
cation disease were prospectively included in this study.
A DUS study was performed in all the patients. DUS
The British Journal of Radiology, 79 (2006), 201–207
The British Journal of Radiology, March 2006 201](https://image.slidesharecdn.com/026britishjournalofradiology-britishinstituteofradiology-2006-130913065550-phpapp02/75/British-Journal-of-Radiology-British-Institute-of-Radiology-2006-eng-205-2048.jpg)


![The presence of signal dropouts were analysed
separately as this particular artefact caused significant
problems in the accurate assessment of the degree of
stenosis (Table 4). Lower incidence of signal dropout
was noted with CE MRA both at the level of stenosis
(46.7% with TOF MRA, 18.3% with CE MRA) as well as
beyond the level of stenosis (58.3% with TOF MRA, 15%
with CE MRA).
13 patients had normal carotid bulbs. Five of these
patients demonstrated signal dropout in TOF MRA but
none showed signal dropout in CE MRA.
Plaque ulceration was detected more frequently with
CE MRA compared with TOF MRA. An average of 18.6
plaque ulcers in 60 carotids were detected with CE MRA
compared with 12.3 plaque ulcers in 60 carotids with
TOF MRA by the three observers.
Interobserver variability
Interobserver agreement was measured with the help
of intraclass correlation using a two way mixed effect
model for absolute agreement. Measurements were
made for visual evaluation of stenosis, NASCET grading
of stenosis and ECST grading of stenosis (Table 5). The
intraclass correlation values for CE MRA (0.893 for visual
estimation, 0.890 for NASCET grading and 0.800 for
ECST grading) were consistently higher compared with
TOF MRA (0.730, 0.758 and 0.737, respectively).
Discussion
The morbidity associated with carotid endarterectomy
is dependent on the complication rate of surgery as well
as any complication from pre-operative investigation.
Therefore, if CA is used in the pre-operative evaluation
of carotid stenosis, a complication rate of 1–2% is added
to the surgical complication rate of 1–2%. Reducing the
risk related to CA would, therefore, improve patient
outcome. Furthermore, although CA was used as a gold
standard in NASCET and ECST, its position as a gold
standard investigation for carotid stenosis is no longer
incontrovertible. The limited projections of carotid
bifurcation obtained in CA can underestimate the degree
of stenosis caused by eccentric plaques. This may be one
of the factors causing the reported overestimation of
stenosis by MRA compared with CA [11]. Current
practice is moving towards non-invasive evaluation of
degree of stenosis, with CA reserved only for selected
cases. In this scenario, it is of utmost importance to
optimize the modality of the non-invasive investigation
to prevent misclassification of patients and the resultant
inappropriate treatment.
DUS has been advocated by some investigators [15] as
a method of evaluating carotid stenosis prior to
endarterectomy. However, DUS is limited by operator
dependency, difficulty in identifying sub-total occlusion
with very slow flow as well as difficulty in clearly
defining the morphology of lesions in the carotid
bifurcation. In many centres, therefore, DUS is used in
tandem with MRA, with the latter often being the
confirmatory investigation [9].
Time of flight imaging is a well-established MRA
technique. This is based on the signal generated from the
inflowing unsaturated protons. As this technique does
not require external contrast injection, the image quality
does not depend on factors such as the timing of the
bolus injection, volume of contrast injected, etc. This
technique also has improved sensitivity to slow flow [16]
and is more accurate in defining the morphology of the
proximal internal carotid artery compared with DUS. We
have used 2D TOF technique as it has been validated as
an accurate method [9, 17] in this context and was the
standardized technique used in our department at the
time of the study.
Both 2D and 3D TOF MRA, however, have limitations.
The most serious limitation is the loss of signal caused by
complex flow pattern in the stenotic segment of the
artery causing over-estimation of the degree of stenosis.
In order to produce a signal the inflowing blood should
be perpendicular to the scan plane. However, severe
stenosis results in turbulent flow where many of the
protons in the arterial blood are no longer flowing
perpendicular to the scan plane and therefore do not
produce a signal. Furthermore, signal is only produced
by fresh protons flowing into the scan-plane, which have
not received saturation pulses. If, as in a subtotal
occlusion, the flow is slow enough, these protons lose
their signal due to in-plane saturation. Long scan times
also result in movement artefacts (mostly due to
swallowing) (Figure 4) as well as slice misregistration.
In the present study, problematic slice misregistration
was seen in 17 carotids with TOF MRA technique but
none with CE MRA technique.
Table 3. MR artefacts in the two techniques
TOF MRA CE MRA
Slice misregistration 32 NA
Problematic slice
misregistration
17 NA
Pulsation artefact 29 0
Venous signal 3 23
Problematic venous signal 0 1
NA, not applicable; TOF MRA, time of flight MR angiogra-
phy; CE MRA, contrast enhanced MR angiography.
Table 4. Incidence of signal dropouts in the two techniques
(all values out of 60)
TOF MRA CE MRA
At stenosis 28 11
Beyond stenosis 35 9
Tortuosity 32 0
TOF MRA, time of flight MR angiography; CE MRA, contrast
enhanced MR angiography.
Table 5. Intraclass correlation values for agreement
between observers
TOF MRA CE MRA
Visual estimation 0.730 0.893
NASCET grading 0.758 0.890
ECST grading 0.737 0.800
TOF MRA, time of flight MR angiography; CE MRA, contrast
enhanced MR angiography; NASCET, North American
Symptomatic Carotid Endarterectomy Trial; ECST,
European Carotid Surgery Trial.
D Mitra, D Connolly, S Jenkins et al
204 The British Journal of Radiology, March 2006](https://image.slidesharecdn.com/026britishjournalofradiology-britishinstituteofradiology-2006-130913065550-phpapp02/75/British-Journal-of-Radiology-British-Institute-of-Radiology-2006-eng-208-2048.jpg)
![CE MRA uses the T1 shortening effect of gadolinium to
produce signal from a vessel. It is, therefore, not directly
dependent on flow to produce a signal and has less of the
flow related artefacts described above. However, as an
external contrast agent is administered, the timing of the
injection, volume injected and the flow rate are of crucial
importance. One of the major problems in CE MRA
technique is presence of venous signal, which can cause
difficulty in image interpretation (Figure 5). Venous
signal was seen in three carotids with TOF MRA
technique compared with 23 carotids with CE MRA in
this study. However, in only 1 out of the 23 carotids did
the venous signal prove to be a problem in image
interpretation. This is in variance with another study [14]
(a) (b)
Figure 4. (a) Time of flight MR angiography (TOF MRA) and (b) contrast enhanced MR angiography (CE MRA) showing oblique
projections of the carotid arteries. Note the significant degradation of the image in TOF MRA (arrows) due to movement, which
is not seen in the CE MRA image.
(a) (b)
Figure 5. (a) Anteroposterior (AP) and (b) oblique projections of contrast enhanced MR angiography (CE MRA) of carotid
arteries showing presence of venous signal (arrows). Note that despite the presence of venous signal the visualization of the
carotid arteries is not significantly impaired.
CE MRA and TOF MRA in carotid stenosis
The British Journal of Radiology, March 2006 205](https://image.slidesharecdn.com/026britishjournalofradiology-britishinstituteofradiology-2006-130913065550-phpapp02/75/British-Journal-of-Radiology-British-Institute-of-Radiology-2006-eng-209-2048.jpg)
![where 27% of the contrast enhanced MRA images of the
carotid bifurcation was deemed non-diagnostic due to
masking of the carotid bifurcation by veins.
Specific techniques have been used in order to avoid
this phenomenon and to optimize signal from the
arteries imaged. One such technique is called time
resolved CE MRA where image is acquired repeatedly
at a certain rate in a method akin to DSA (hence the
technique is also known as MR DSA). In this technique
the timing of the bolus injection is not critically
important. In the present study, a bolus-tracking
technique was used in order to optimize the timing of
the injection. This technique is considered to be an
improvement on the time resolved CE MRA [4].
Furthermore, the central k-space data (i.e. the high
amplitude and low resolution data) was acquired first,
to make sure that high contrast information was acquired
while gadolinium was still in the arterial phase.
CE MRA provides a much wider field of view
compared with TOF MRA (Figure 6) and allows assess-
ment from the arch to the base of the skull and if
necessary up to the circle of Willis. This allows the
coverage from CE MRA to be on par with CA and helps
detect any concomitant intracranial disease, which may
alter the decision to proceed to end-arterectomy.
QualityofimagesinbothTOFMRAandCEMRAdepend
on the spatial and contrast resolution as well as on the
presence or absence of artefacts. Loss of signal caused by
non-linear flow and in-plane saturation can result in poor
resolution in TOF MRA. Signal dropouts in the stenotic and
post-stenotic segments were also seen more frequently with
the TOF technique than with the CE MRA technique
(Table 4). Signal voids were also seen in some normal bulbs
as well as a significant number of tortuous carotid arteriesin
TOF MRA but not seen with CE MRA (Table 4).
The higher spatial resolution of CE MRA compared
with TOF MRA is also indicated by the better ability to
demonstrate branches of the external carotid artery
(Table 1 and Figure 6). In addition, plaque ulceration
was also seen more frequently by CE MRA technique
than TOF MRA. This is consistent with findings of an
earlier study comparing the two techniques [13].
Slice misregistration, another known problem of 2D
TOF MRA [16], resulted in difficulty in image inter-
pretation in 17 out of 60 carotid bifurcations in this study.
This problem is not encountered with CE MRA, as it is a
volume acquisition technique. With all the factors
described above, it is not surprising that the level of
diagnostic confidence of all three raters have been
consistently higher with CE MRA than TOF MRA, both
for visual estimation and estimation based on measure-
ment (Figures 2 and 3). This is in keeping with the
findings of a similar study [13] where on a scale of 1 to 3
(1 being the best and 3 being the worst technique) the
mean diagnostic confidence score was 1.10 for CE MRA
1.90 for pooled 2D and 3D TOF images (p,0.01).
Any imaging technique also needs to be assessed for
interobserver variability, particularly a relatively new
technique such as CE MRA. High observer variability in
some imaging techniques such as DUS has resulted in
criticism and lack of wide acceptance. Low observer
variability of DSA [18] on the other hand is one of the
factors favouring the use of this technique for pre-
operative carotid stenosis assessment. In the present
study, interobserver variability has been studied
between all three observers as well as for all three
methods of assessment of stenosis, i.e. visual assessment,
calliper measurement by NASCET and calliper measure-
ment by ECST criteria. Interobserver variability was
measured with the help of the intraclass correlation
(a) (b)
Figure 6. (a) Time of flight MR angiography (TOF MRA) and (b) contrast enhanced MR angiography (CE MRA) showing oblique
projections of the carotid arteries. Note the much larger field of view of CE MRA demonstrating vessels from the arch of the
aorta to the base of the skull and the better demonstration of the external carotid branches on CE MRA (long arrows) compared
with TOF MRA (short arrows).
D Mitra, D Connolly, S Jenkins et al
206 The British Journal of Radiology, March 2006](https://image.slidesharecdn.com/026britishjournalofradiology-britishinstituteofradiology-2006-130913065550-phpapp02/75/British-Journal-of-Radiology-British-Institute-of-Radiology-2006-eng-210-2048.jpg)

![Comparison of Radiologists’ confidence in excluding significant
colorectal neoplasia with multidetector-row CT colonography
compared with double contrast barium enema
S A TAYLOR, MD, MRCP, FRCR, S HALLIGAN, MD, MRCP, FRCR, A SLATER, MRCP, FRCR, M MARSHALL, MRCP,
FRCR and C I BARTRAM, FRCP, FRCS, FRCR
Department of Intestinal Imaging, St Mark’s and Northwick Park Hospitals, Harrow, London HA1
3UJ, UK
ABSTRACT. The aim of this study was to compare the confidence of experienced
radiologists in excluding colonic neoplasia with CT colonography (CTC) compared with
barium enema. 78 patients (median age 70 years, range 61–87 years, 44 women)
underwent same day CTC and barium enema. Two radiologists experienced in
reporting barium enema assessed whether the examination had excluded a polyp 6 mm
or greater as ‘‘yes’’, ‘‘probably’’ or ‘‘no’’ for each of 6 colonic segments. Two different
radiologists experienced in CTC independently performed the same assessment on the
CT datasets. Responses were compared using a paired exact test. Formal barium enema
and CT reports were compared with any endoscopic examination performed within
1 year. Studies reporting polyps 6 mm+ in patients not subsequently undergoing
endoscopy were reviewed by two independent observers. Radiologists stated they had
confidently excluded a significant lesion in 314 (71%) and 382 (86%) of 444 segments
with barium enema and CTC, respectively (p,0.001). Confidence was significantly
higher with CTC in the in the descending and ascending colon (p50.02 and p,0.001,
respectively), and caecum (p,0.001). 22 patients underwent some form of endoscopy.
Of five patients with proven colorectal neoplasia (including two with cancer), CTC and
barium enema correctly identified five and three, respectively. In 56 patients not
undergoing endoscopy, CTC reported 17 polyps 6 mm+, of which 16 were
retrospectively classified as definite or probable. 11 could not be identified on the
barium enema, even in retrospect. Confidence in excluding polyps 6 mm or larger is
significantly greater with CT colonography particularly in the proximal colon.
Received 6 June 2005
Revised 13 July 2005
Accepted 15 July 2005
DOI: 10.1259/bjr/99126323
’ 2006 The British Institute of
Radiology
Symptoms of colorectal neoplasia are notoriously non-
specific with the result that the majority of patients
investigated do not harbour significant pathology. Even
when applying defined symptom complexes, such as
those specified in the recent ‘‘2 week wait’’ initiative [1],
the prevalence of significant pathology is increased to no
more than 10–15% [2]. Colonoscopy remains the refer-
ence standard whole colon examination but is technically
demanding, invasive, and associated with a small
morbidity and even mortality. Adverse effects are well
documented, largely related to the cardiorespiratory
effects of sedation [3–6], with some evidence of increased
susceptibility amongst the elderly [7].
Radiological alternatives to colonoscopy, including
both CT colonography and barium enema, are generally
viewed as safer, less invasive investigations [8]. Barium
enema remains the standard radiological investigation,
although the day-to-day diagnostic performance in
comparison with CT colonography has not been assessed
in large-scale clinical trials of symptomatic patients.
Advocates of CT colonography point to increased patient
acceptability [9, 10] and extrapolated higher sensitivity
for significant colonic pathology [11, 12]. However, given
that most symptomatic patients will not harbour
significant colonic neoplasia, one important, but often
neglected, consideration is the degree of confidence with
which the reporting radiologist can confirm normality
and thus spare the patient further expensive and
invasive investigations. If CT colonography is to become
the standard radiological investigation, the incidence of
inconclusive examinations should therefore be at least
equal to, and preferably less than that of the barium
enema in elderly symptomatic patients.
The purpose of this study was to compare the
confidence of experienced radiologists in excluding
significant colonic neoplasia with both CT colono-
graphy and barium enema in patients undergoing both
examinations.
Materials and methods
Our local ethical review committee approved the
study and all subjects gave informed written consent.
Address correspondence to: Dr Stuart Taylor, Department of
Specialist X-ray, Level 2, University College Hospital, 235 Euston
Road, London NW1 2BU, UK.
This research was supported by a research fellowship from the
Royal College of Radiologists.
The British Journal of Radiology, 79 (2006), 208–215
208 The British Journal of Radiology, March 2006](https://image.slidesharecdn.com/026britishjournalofradiology-britishinstituteofradiology-2006-130913065550-phpapp02/75/British-Journal-of-Radiology-British-Institute-of-Radiology-2006-eng-212-2048.jpg)
![All patients 60 years of age or older referred for double
contrast barium enema between July 2002 and December
2003 were identified from clinical request cards sent to
the Department of Radiology. Only those referred
because of a clinical suspicion of colorectal neoplasia
were eligible for inclusion. All eligible patients were then
invited by letter to additionally undergo CT colonogra-
phy immediately before barium enema. A total of 78
patients (median age 70 years, range 61–87 years, 44
women) were recruited. Reasons for referral were as
follows: change in bowel habit (n560); iron deficiency
anaemia (n510); palpable abdominal mass (n58).
CT colonography
CT colonography was performed immediately prior to
same day barium enema. Patients underwent the standard
bowel purgation regimen used at our institution, consist-
ing of 24 h of a clear liquid diet together with two sachets
of sodium picosulphate/magnesium citrate (Picolax;
Ferring Pharmaceuticals, Berkshire, UK). No tagging
agents were used. All but two patients received 20 mg of
intravenous hyoscine butylbromide (Buscopan;
Boehringer Ingelheim, Bracknell, UK) prior to gas insuf-
flation. The remaining two patients received intravenous
glucagon (Nova Nordisk Pharmaceuticals, Crawley, UK)
because of a contraindication to hyoscine butylbromide
(both due to recent acute cardiovascular events). Colonic
insufflation was performed with carbon dioxide using an
automatic insufflator (Protocol; E-Z-EM, Westbury, NY).
Insufflation occurred at a rate of 1–2 l min21
with a
maximum intracolonic pressure of 25 mmHg, set using the
pump controls, and was continued until patient discom-
fort, or if distension was deemed adequate by the
supervising radiologist from the CT scout image.
Patients were then scanned in the supine position using
a four detector row CT scanner (Lightspeed plus; General
Electric Medical Systems, Milwaukee, WI) and the follow-
ing parameters: 2.5 mm collimation; pitch of 1.5; 120 kVp;
50 mA; 50% slice overlap. Patients were turned prone and
further gas insufflated if a second scout image suggested
areas of collapse. A scan in the prone position was then
performed using identical CT parameters. Intravenous
contrast was not administered.
Barium enema
After CT colonography was complete, patients were
escorted from the CT scanner to the fluoroscopy suite.
Appointment times were such that there was at least 1 h
between completion of CT colonography and commence-
ment of barium enema. Barium enemas were performed
by either one of three experienced radiographers (68
patients), or by a radiology trainee (10 patients) according
to a standard protocol consisting of multiple digital
fluoroscopic spot views of the double-contrasted colon
followed by two lateral decubitus over-couch radiographs.
The barium preparation (94% w/w, PolibarTM
; E-Z-EM,
Westbury, NY) was diluted with 700 ml water and
instilled via a rectal catheter. Colonic distension was
achieved with carbon dioxide introduced by manual
compression of the gas-filled enema bag. Patients received
a second identical dose of the spasmolytic that had been
administered for CT colonography (either hyoscine butyl-
bromide or glucagon) prior to the barium enema.
Image analysis: CT colonography
Image analysis was performed using a dedicated
workstation with proprietary software (Advantage
Windows 4.0 and Colonography; GE Medical Systems,
Milwaukee, WI). Two radiologists experienced in CT
colonography (defined by prior reading of at least 150 CT
colonographic datasets with full endoscopic correlation)
independently analysed the CT datasets. Reader one
read the first 36 patients and reader two the second 42
patients. Analysis was performed using primary analysis
of two-dimensional (2D) axial supine and prone images
with multiplanar reformats and 3D endoluminal views
reserved for problem solving. For the purpose of the
study the colon was divided into six segments using
previously published criteria [13]. Readers noted the
presence of diverticular disease or colonic neoplasia in
each of the six segments on a study sheet designed for
the trial. Colorectal neoplasia and diverticular disease
were defined using previously well-established criteria
[14, 15]. A formal CT report was also generated for the
referring clinician as per usual practice.
Readers additionally independently assessed each
colonic segment as to whether they could answer the
clinical question ‘‘has the test excluded a significant
colonic lesion?’’ For the purposes of the trial, a significant
colonic lesion was defined as a polyp 6 mm or larger.
The readers graded their response for excluding a
significant lesion as ‘‘yes’’, ‘‘probably’’ or ‘‘no’’. If the
response was ‘‘probably’’ or ‘‘no’’, readers listed reason
for non-exclusion as ‘‘fluid’’, ‘‘poor distension’’ or
‘‘faecal residue’’. A significant lesion was by definition
not excluded (i.e. ‘‘no’’) if such a lesion was reported as
being present in that particular segment.
Image analysis: barium enema
All barium enemas were reported on the day they
were performed by one of two experienced readers
(defined as a radiologist with a declared subspecialty
interest in gastrointestinal radiology with at least 5 years
experience of reporting more than 4 barium enema
examinations per week). These readers were different
from the radiologists analysing the CT scans and were
blinded to the CT report. Individual readers single read
the barium enema studies as they appeared on their
clinical lists and a formal report was generated for the
referring clinician as per usual practice. Readers one and
two read 40 and 38 studies, respectively.
For the purposes of the trial, the colon was again divided
into six segments using the same criteria as for CT
colonography. Readers noted the presence of diverticular
disease or colonic neoplasia in each of the six segments on a
study sheet designed for the trial, identical to that for the CT
readers. As for the CT, readers additionally independently
assessed each colonic segment as to whether they could
answer the clinical question ‘‘has the test excluded a
significant colonic lesion?’’ (polyp 6 mm or larger), listing
Radiologists’ confidence in excluding significant colorectal neoplasia
The British Journal of Radiology, March 2006 209](https://image.slidesharecdn.com/026britishjournalofradiology-britishinstituteofradiology-2006-130913065550-phpapp02/75/British-Journal-of-Radiology-British-Institute-of-Radiology-2006-eng-213-2048.jpg)
![their response as ‘‘yes’’, ‘‘probably’’ or ‘‘no’’. If the response
was ‘‘probably’’ or ‘‘no’’, readers listed reason for non-
exclusion as ‘‘poor barium coating’’, ‘‘poor distension’’,
‘‘barium pool’’ or ‘‘faecal residue’’. Again, a significant
lesion was by definition not excluded (i.e. ‘‘no’’) if such a
lesion was reported by the radiologist for that particular
segment.
Endoscopic correlation
After trial completion, a non-observer searched the local
endoscopic database to ascertain if patients had undergone
any form of endoscopy within 1 year of the barium enema
and CT scan (either before or after). There was a time
period of 6 months between the CT/barium enema of the
last patient recruited and the database search. The trial
study sheets were then correlated with the endoscopic
report to derive the CT and barium enema sensitivity and
false positive rate for colorectal neoplasia. A radiologically
detected polyp was deemed true positive if a correspond-
ing polyp was found in the same segment at endoscopy
and if the estimated size of the polyp agreed as follows; for
polyps less than 6 mm at endoscopy radiological measure-
ment was within ¡90%, for polyps 6–9 mm radiological
measurement was within ¡70%, and for polyps 10 mm or
greater radiological measurement was within ¡50%. A
radiologically detected polyp was deemed false positive if
either no polyp was found in the corresponding segment
during subsequent endoscopy or if the measured size fell
outside the above criteria. If endoscopy had preceded
imaging, endoscopically removed polyps were excluded
from the comparison. All readers were blinded to the
endoscopic data.
Radiological review
All cases where a lesion at least 6 mm had been reported
on either the CT colonography, or barium enema and yet
the patient had not subsequently been referred for
endoscopy were identified and reviewed. An independent
observer, experienced in CT colonography with audited
performance in line with the published literature, reviewed
the CT colonography datasets, and another expert gastro-
intestinal radiologist reviewed the barium enema, both
unblinded to the original study reports. If the lesion(s) had
been reported on CT colonography alone, the abnormality
was found in the CT colonography dataset and classified as
‘‘definite’’, ‘‘probable’’ or ‘‘likely false positive’’ by the
independent CT observer. The barium enema was then
carefully reviewed to see if the lesion was in retrospect
‘‘definitely present’’, ‘‘probably present’’ or ‘‘not identi-
fied’’. If the lesion(s) was identified on barium enema
alone, the same process was undertaken in reverse. Lesions
reported on both CT colonography and barium enema
were classified as ‘‘definite’’, ‘‘probable’’ or ‘‘likely false
positive’’ by the independent observers for each modality.
Statistical analysis
For the purposes of analysis of radiologist confidence at
excluding a significant colonic lesion, the ‘‘no’’ and
‘‘probably’’ responses were combined into a single group
and compared with the ‘‘yes’’ responses. The first set of
analyses were performed for each segment of the colon
separately using a paired exact test (binomial based exact
test).
The effect of patient age (categorised into 65 or less versus
greater than 65) upon radiologist confidence was also
examined using Fisher’s Exact test separately for the two
procedures. The effects of individual readers on confidence
scores were then compared for both barium enema and CT,
and any effect on who had performed the barium enema
(radiographer or radiology registrar) was sought.
Confidence scores from all six segments were then
combined into a single analysis. Because segments in
individual patients are not wholly independent of each
other, logistic regression with robust standard errors was
used for the analysis and any effect of patient age, who
performed test and who reported the test was sought by
adding each factor to the basic regression model.
Results
Radiologist confidence
A total of four patients did not tolerate one of the two
tests (four failed barium enema and one also failed CT
colonography) and were excluded. Two of the four
patients were intolerant of colonic distension (including
the one who failed CT colonography) and two were
insufficiently mobile to undergo barium enema. A total
of 74 patients were thus left for analysis.
Overall, the reporting radiologists stated they had
confidently excluded a significant lesion in 314 of 444
segments (71%) with barium enema and in 382 of 444
segments (86%) with CT colonography (p,0.001).
Reasons for non-exclusion (other than reporting a
lesion) with barium enema were residue: 41%, poor
coating: 12%, barium pools: 32% and poor distension:
15%. Reasons for non-exclusion (other than reporting a
lesion) with CT colonography were residue: 35%, fluid
pools: 20% and poor distension: 45%.
The number of individual segments in which a lesion
was confidently excluded is shown in Table 1.
Radiologists reporting CT colonography were signifi-
cantly more likely to confidently exclude a significant
lesion in the descending and ascending colon (p50.02
Table 1. Radiologist confidence at excluding a significant
colonic lesion for barium enema and CT colonography
according to colonic segment
Segment Lesion excluded
on barium enema
[patients (%)]a
Lesion excluded
on CT
[patients (%)]a
p-value
Rectum 64 (86) 69 (93) 0.27
Sigmoid 49 (67) 52 (71) 0.69
Descending 63 (85) 70 (94) 0.02
Transverse 53 (72) 61 (82) 0.13
Ascending 44 (59) 65 (87) ,0.001
Caecum 41 (55) 65 (88) ,0.001
n574.
a
Figure refers to the number of ‘‘yes’’ responses to whether a
significant lesion was confidently excluded.
S A Taylor, S Halligan, A Slater et al
210 The British Journal of Radiology, March 2006](https://image.slidesharecdn.com/026britishjournalofradiology-britishinstituteofradiology-2006-130913065550-phpapp02/75/British-Journal-of-Radiology-British-Institute-of-Radiology-2006-eng-214-2048.jpg)


![of any particular technique, the ability of the test to
confidently confirm normality is also an important
consideration given that most symptomatic patients do
not harbour significant pathology. Assuming it is
technically complete, a normal barium enema or CT
colonography is usually sufficient to spare the cost and
risks of additional total colonoscopy in most patients
with non-specific symptoms.
We found that experienced radiologists had signifi-
cantly greater confidence in excluding a lesion 6 mm or
larger with CT colonography than with barium enema,
particularly in the proximal colon. Adequate visualiza-
tion of the ascending colon and caecum is often difficult
with barium enema, particularly in frail, immobile
patients, mainly due to difficulties in barium filling
and achieving the correct balance between adequate
coating and unwanted liquid pools. Incomplete exam-
inations are therefore relatively frequent in this patient
group [16]. This difficultly is less apparent during CT
colonography, when all that is required is gaseous
distension of the proximal colon, something that can
usually be achieved reliably [13, 17, 18]. The data suggest
therefore that CT colonography is technically more
‘‘forgiving’’ than barium enema in older symptomatic
patients. This has direct clinical implications, particularly
as a combination of flexible sigmoidoscopy and barium
enema has frequently been advocated in symptomatic
patients [19, 20]. Our results suggest that experienced
radiologists may be more confident when excluding
significant pathology with CT colonography rather than
barium enema in those undergoing limited endoscopy.
Diagnostic confidence was almost identical in the
sigmoid for barium enema and CT, suggesting this
segment remains problematic, although recent data
suggest CT colonography is as effective as flexible
sigmoidoscopy for detecting significant lesions in
patients presenting with rectal bleeding [21].
Residual fluid/barium or faecal residue generally
decreased diagnostic confidence for CT and barium
enema in similar proportion, although this affected more
patients during barium enema overall. Interestingly,
poor distension was the most common reason for
inability to confidently exclude a significant lesion with
CT colonography. The use of supine and prone imaging
[17, 18] and spasmolytic [13] have all been shown to
improve distension during CT colonography, but it is
clear that any further improvements would still have
significant impact on diagnostic confidence.
We did find evidence that referring clinicians consider
a negative radiological test sufficiently reassuring to halt
colonic investigation in symptomatic patients: no patient
with a normal CT or barium enema went on to
subsequent endoscopy. Indeed, 19 patients with abnor-
mal CT reports (including 6 with suspected lesions at
least 10 mm in size) have had no further colonic
investigation. By way of explanation, all these patients
had normal barium enema reports and the clinician may
be more comfortable with this rather than the newer
technology. However, it seems likely that two radiologi-
cal investigations negative for cancer was enough to halt
further investigation in elderly patients who were often
frail.
The number of patients undergoing full colonoscopy
was insufficient for any meaningful analysis of the
diagnostic performance of CT colonography versus
barium enema. CT identified all patients with colonic
neoplasia on endoscopy whereas barium enema missed
two (albeit with small and clinically insignificant
polyps). However, of the two patients proven to have
colorectal cancer (one of which was diagnosed only after
incomplete colonoscopy), CT diagnosed both (and
confirmed metastatic spread in one), whereas barium
enema incorrectly classified a rectal cancer as a polyp. CT
colonography did raise the possibility of a cancer in a
patient with a Crohn’s stricture, which was confidently
reported as benign on barium enema, emphasising the
benefit of barium enema for visualizing mucosal detail
and the problems of using CT colonography in patients
with inflammatory bowel disease.
CT colonography reported polyps in 29 (37%) patients
compared with just 4 (5%) on barium enema. Although
four patients had a subsequent normal colonoscopy
suggesting CT false positives (although colonoscopy is
an imperfect reference standard [22, 23]), the majority
have not undergone endoscopic examination to confirm
or refute the CT findings. All but one of the 17 polyps
6 mm plus initially reported on CT colonography in
patients not undergoing endoscopy were classified as
definite or probable on review by an independent
observer, although only 4 were seen in retrospect on
the barium enema. It could be argued that some of these
additional polyps are false positives and if CT colono-
graphy were used alone could trigger unnecessary
endoscopy. However, the prevalence of polyps even in
an asymptomatic screening cohort over 50 is around 30–
40% [24, 25], which perhaps gives some weight to the
assertion that CT colonography was more sensitive than
barium enema. Furthermore, there is increasing evidence
of CT colonography’s superior performance in polyp
detection compared with barium enema [26]. Of course
in the elderly symptomatic population, even sizeable
polyps (over 1 cm) are likely incidental and a more
sensitive test, such as CT colonography, does not always
improve the outcome for patients (and indeed may
worsen it if clinicians feel duty bound to ‘‘chase’’
incidental polyps reported on CT colonography in this
vulnerable patient group). Conversely a 12 mm caecal
polyp in a fit 70-year-old for example may well be highly
significant for that individual. There needs to be a clear
understanding between radiologist and referring clini-
cian as to the lesion size threshold reported and the
significance of findings in individual patients.
Our study does have weaknesses. It is possible that the
prior CT colonography adversely affected the quality of
Table 3. Retrospective independent observer classification
of polyps 6 mm plus seen exclusively on CT colonography in
patients without subsequent endoscopy
Polyp size CT classificationa
Barium enema classification
Definite Probable Not seen Total
6–9 mm Definite 0 1 4 5
Probable 0 1 3 4
10 mm+ Definite 1 0 4 5
Probable 2 0 0 2
a
Excluding one 7 mm polyp re-classified as a false positive on
CT colonography.
Radiologists’ confidence in excluding significant colorectal neoplasia
The British Journal of Radiology, March 2006 213](https://image.slidesharecdn.com/026britishjournalofradiology-britishinstituteofradiology-2006-130913065550-phpapp02/75/British-Journal-of-Radiology-British-Institute-of-Radiology-2006-eng-217-2048.jpg)
![subsequent barium enema. However carbon dioxide
(which is readily absorbed through colonic mucosa) was
used for CT colonography and there was at least 1 h
between the two tests. Anecdotally those performing the
enemas did not report additional problems in study
patients, but we cannot exclude negative effects on the
quality of the barium enemas. Different radiologists
graded the barium enema and CT colonographic studies
and it is possible that the confidence scores for excluding
neoplasia were merely a reflection of the personalities of
the individual radiologist rather than a comparison
between the two tests. However, all radiologists had
good experience of the technique they were reporting
and importantly there were no statistically significant
differences between levels of confidence for each of the
two separate readers for each test, suggesting the scores
reflected the procedure more than the radiologist. It
would, however, be useful for further work to investi-
gate intraobserver confidence in those trained in both CT
colonography and barium enema. Although within the
context of a trial we demonstrated greater confidence for
excluding lesions 6 mm and over with CT colonography,
it is clear that any level of uncertainty was often not
reflected in the formal report sent to the referring
clinician. In other words, even if the radiologist
reported on the trial sheet that a significant lesion could
not be excluded in, say, the caecum, this reduced
confidence was not portrayed in the issued report. It is
therefore questionable whether improved confidence
with CT colonography would necessarily have a direct
clinical impact in reducing unnecessary colonoscopy
after technically imperfect barium enema. Such data
will come from larger randomized trials currently in
progress.
It is acknowledged that our definition of a significant
lesion as anything 6 mm or larger is relatively wide and
accept that there is a significant difference in not being
able to exclude, say, an 8 mm polyp, compared with a
20 mm polyp. In essence our definition required the
radiologist to be confident he/she could exclude a 6 mm
lesion. However, detection of relatively small lesions is a
reflection of the overall capabilities of the examination,
especially when compared with endoscopy. Finally, as
discussed above, CT colonography reported polyps in
many more patients than barium enema and theoreti-
cally could actually act to increase endoscopic referral if
the results are not viewed wisely in clinical context by
clinicians. However, it must be remembered that a small
but significant number of polyps around the centimetre
mark will harbour cancer [27] and as life expectancy
increases such lesions will assume greater importance in
older individuals.
In conclusion, radiologist confidence in excluding
polyps 6 mm or larger is significantly greater with CT
colonography than barium enema, particularly in the
proximal colon.
Acknowledgments
This research was supported by a research fellowship
from the Royal College of Radiologists.
The authors would like to thank Paul Bassett for his
statistical advice.
References
1. Thompson M. ACPGBI Referral guidelines for colorectal
cancer. Colorectal Dis 2002;4:287–97.
2. Flashman K, Faux W, O’Leary D, Senapati A, Thompson M.
Diagnostic yields of the six Department of Health (DOH)
higher risk criteria for the ‘‘two week standard’’ clinic
(TWSC). Colorectal Dis 2002;3 (Suppl.) poster 41.
3. Eckardt VF, Kanzler G, Schmitt T, Eckardt AJ, Bernhard G.
Complications and adverse effects of colonoscopy with
selective sedation. Gastrointest Endosc 1999;49:560–5.
4. Holm C, Christensen M, Rasmussen V, Schulze S,
Rosenberg J. Hypoxaemia and myocardial ischaemia dur-
ing colonoscopy. Scand J Gastroenterol 1998;33:769–72.
5. Ristikankare M, Julkunen R, Mattila M, et al. Conscious
sedation and cardiorespiratory safety during colonoscopy.
Gastrointest Endosc 2000;52:48–54.
6. Thompson AM, Park KG, Kerr F, Munro A. Safety of
fibreoptic endoscopy: analysis of cardiorespiratory events.
Br J Surg 1992;79:1046–9.
7. Yano H, Iishi H, Tatsuta M, Sakai N, Narahara H, Omori M.
Oxygen desaturation during sedation for colonoscopy in
elderly patients. Hepatogastroenterology 1998;45:2138–41.
8. Taylor SA, Halligan S, O’Donnell C, et al. Cardiovascular
effects at multi-detector row CT colonography compared
with those at conventional endoscopy of the colon.
Radiology 2003;229:782–90.
9. Gluecker TM, Johnson CD, Harmsen WS, et al. Colorectal
cancer screening with CT colonography, colonoscopy, and
double-contrast barium enema examination: prospective
assessment of patient perceptions and preferences.
Radiology 2003;227:378–84.
10. Taylor SA, Halligan S, Saunders BP, Bassett P, Vance M,
Bartram CI. Acceptance by patients of multidetector CT
colonography compared with barium enema examinations,
flexible sigmoidoscopy, and colonoscopy. AJR Am J
Roentgenol 2003;181:913–21.
11. Sosna J, Morrin MM, Kruskal JB, Lavin PT, Rosen MP,
Raptopoulos V. CT colonography of colorectal polyps: a
metaanalysis. AJR Am J Roentgenol 2003;181:1593–8.
12. de Zwart IM, Griffioen G, Shaw MP, Lamers CB, de Roos A.
Barium enema and endoscopy for the detection of colorectal
neoplasia: sensitivity, specificity, complications and its
determinants. Clin Radiol 2001;56:401–9.
13. Taylor SA, Halligan S, Goh V, et al. Optimizing colonic
distention for multi-detector row CT colonography: effect of
hyoscine butylbromide and rectal balloon catheter.
Radiology 2003;229:99–108.
14. Fenlon HM, Clarke PD, Ferrucci JT. Virtual colonoscopy:
imaging features with colonoscopic correlation. AJR Am J
Roentgenol 1998;170:1303–9.
15. Fletcher JG, Johnson CD, MacCarty RL, Welch TJ, Reed JE,
Hara AK. CT colonography: potential pitfalls and problem-
solving techniques. AJR Am J Roentgenol 1999;172:1271–8.
16. Tinetti ME, Stone L, Cooney L, Kapp MC. Inadequate
barium enemas in hospitalized elderly patients. Incidence
and risk factors. Arch Intern Med 1989;149:2014–6.
17. Chen SC, Lu DS, Hecht JR, Kadell BM. CT colonography:
value of scanning in both the supine and prone positions.
AJR Am J Roentgenol 1999;172:595–9.
18. Yee J, Kumar NN, Hung RK, Akerkar GA, Kumar PR, Wall
SD. Comparison of supine and prone scanning separately
and in combination at CT colonography. Radiology
2003;226:653–61.
19. Mendelson RM, Kelsey PJ, Chakera T. A combined flexible
sigmoidoscopy and double-contrast barium enema service:
initial experience. Abdom Imaging 1995;20:238–41.
20. Rex DK, Mark D, Clarke B, Lappas JC, Lehman GA. Flexible
sigmoidoscopy plus air-contrast barium enema versus
colonoscopy for evaluation of symptomatic patients without
evidence of bleeding. Gastrointest Endosc 1995;42:132–8.
S A Taylor, S Halligan, A Slater et al
214 The British Journal of Radiology, March 2006](https://image.slidesharecdn.com/026britishjournalofradiology-britishinstituteofradiology-2006-130913065550-phpapp02/75/British-Journal-of-Radiology-British-Institute-of-Radiology-2006-eng-218-2048.jpg)


![Sub-capital
A significantly out-performed B, C and D (p,0.001)
and B, C, D were not significantly different (p,0.05).
Mid-cervical
A performed similarly to C (p,0.13) and both were
significantly better than B and D (p,0.001).
Intratrochanteric
All films performed similarly with no statistical
variation (Figure 4). The fracture sharpness was better
demonstrated on W and Z than X and Y (p,0.001). Y
represented the traditional AP pelvis performed most
commonly (Figure 5). Z out-performed W by a similar
statistical difference (p,0.001).
The CT data for femoral neck angles relative to the
AIIS baseline showed wide variation and overlap with
no statistical relationship for foot external rotation. A
random sample of scans was re-measured showing
agreement in the measurements.
Discussion
The reported incidence of occult femoral neck fractures
on plain radiographs is approximately 4% [1]. There is
very little in the recent literature regarding optimizing
plain radiography to decrease the incidence of occult
femoral neck fractures. The authors hope that by including
this further radiographic view it will decrease the numbers
of patients requiring further investigation.
When plain radiographs are negative, and there is a
high index of suspicion, MRI has been shown to be
sensitive and specific in diagnosis of occult femoral
fractures.
Studies have shown that in radiographic negative
cases, where clinical concern is high, MRI showed
femoral neck fractures in 23–50% [1–3, 6]. Fractures
other than those of the femoral neck were demonstrated
in 11–33% of cases [2, 3, 6]. Most commonly these were
insufficiency fractures of the pubic rami or sacrum.
A further modality for diagnosis is radionuclide bone
scans. The sensitivity has been reported as 93–100% [4,
5], the specificity as 96%, and the positive predictive
value as 97%. This was regardless of patient age, and
time from presentation to scanning [4]. However, there
have been reported cases of a negative bone scan in a
fractured neck of femur [7], and false positive results due
to ligamentous avulsion and periosteal injury [8].
Fluoroscopy has been used with success. By gently
internally rotating the femur and obtaining high quality
exposures the diagnosis of femoral fractures was made
in 8 out of 16 patients in whom the initial radiographs
were negative [9]. Internal rotation elongates the femoral
neck and hence improves visualization of fractures. Our
study used the same principle, having the X-ray beam
closer to 90˚to the femoral neck making the fracture line
more obvious.
The observers ranked A and C as the preferred choice
for anatomy in 71%. C (Z), however, was significantly
better for fracture clarity than A (W), and both were
superior to the standard views. C (Z) tended to elongate
the femoral neck, for the same reasons as to the 40˚
angled scaphoid view now widely used routinely for
trauma, i.e. the central ray is no longer at right angles to
the bone, creating geometric distortion. The observers
were not used to looking at the femoral neck with this
elongated appearance and so this may explain why A
was ranked higher than C for the anatomical demonstra-
tion. The 40˚angled scaphoid view is a good corollary as
to why the authors expect the angled hip view to out
perform the normal view for a fracture at right angles to
the femoral neck. It is recognized, however, that not all
femoral neck fractures will lie at 90˚, but it is proposed
that it is these fractures that are difficult to see on
standard views and therefore may be better demon-
strated on the new view.
Specialist investigations are both expensive and time
consuming, and if there is a quick and cheap method of
Figure 4. Graphic representation of the radiographs A, B, C,
D showing the observers’ results by region. This shows
increased performance of A and C.
Figure 5. Graphic representation of the fracture sharpness.
This shows increased clarity of the fracture in film Z, out
performing the traditional views X and Y (p,0.001).
The Bristol Hip View
The British Journal of Radiology, March 2006 219](https://image.slidesharecdn.com/026britishjournalofradiology-britishinstituteofradiology-2006-130913065550-phpapp02/75/British-Journal-of-Radiology-British-Institute-of-Radiology-2006-eng-223-2048.jpg)
![obtaining the diagnosis when the initial radiographs are
negative, then this will undoubtedly benefit both the
patient and institution.
Conclusion
Suspected fractured femoral necks are common clin-
ical problems. We have demonstrated that radiographs
angled at 15˚ and 30˚ towards the femoral head show
greater clarity of both the subcapital and the midcervical
areas than the standard views used in current clinical
practice. The femoral neck fracture was also better
demonstrated using these two views, but best on C (30˚
angulation).
The authors now intend to conduct a prospective trial
to evaluate this in clinical practice, to evaluate whether in
equivocal cases a radiograph angled 30˚ to the femoral
head (the Bristol view) should be considered to aid the
diagnosis of fracture.
References
1. Lee YP, Griffith JF, Antonio GE, Tang N, Leung KS. Early
magnetic resonance imaging of radiographically occult
osteoporotic fractures of the femoral neck. Hong Kong
Med J 2004;10:271–5.
2. Pandey R, McNally E, Ali A, Bulstrode C. The role of MRI in
the diagnosis of occult hip fractures. Injury 1998;29:61–3.
3. Lim KB, Eng AK, Chng SM, Tan AG, Thoo FL, Low CO.
Limited magnetic resonance imaging (MRI) and the occult
hip fracture. Ann Acad Med Singapore 2002;31:607–10.
4. Holder LE, Schwarz C, Wernicke PG, Michael RH.
Radionuclide bone imaging in the early detection of fractures
of the proximal femur (hip): multifactorial analysis.
Radiology 1990;174:509–15.
5. Fairclough J, Colhoun E, Johnston D, Williams LA. Bone
scanning for suspected hip fractures. A prospective study in
elderly patients. J Bone Joint Surg Br 1987;69:251–3.
6. Galloway HR, Meikle GR, Despois M. Patterns of injury in
patients with radiographic occult fracture of neck of femur as
determined by magnetic resonance imaging. Australas
Radiol 2004;48:21–4.
7. Mulcahy D, O’Malley M. Negative radioisotope bone scan in
a patient with a fractured neck of femur. Ir J Med Sci
1995;164:42–4.
8. Schmidt C, Deininger HK. [The occult fracture in the
roentgen picture and its detection using bone scintigraphy].
Radiologe 1985;25:104–7 [In German].
9. Helland EB, Tollefsen I, Reksten G. Radiographic diagnosis
of the occult hip fracture: experience in 16 patients. Acta
Orthop Scand 2000;71:639–41.
M Bradley, M Shaw and D Fox
220 The British Journal of Radiology, March 2006](https://image.slidesharecdn.com/026britishjournalofradiology-britishinstituteofradiology-2006-130913065550-phpapp02/75/British-Journal-of-Radiology-British-Institute-of-Radiology-2006-eng-224-2048.jpg)
![Visceral and testicular calcifications as part of the phenotype in
pseudoxanthoma elasticum: ultrasound findings in Belgian
patients and healthy carriers
1
O M VANAKKER, MD, 2
D VOET, MD, PhD, 2
M PETROVIC, MD, PhD, 3
F VAN ROBAEYS, MD, 1
B P LEROY,
MD, 1
P COUCKE, PhD and 1
A DE PAEPE, MD, PhD
1
Center for Medical Genetics , 2
Department of Sonography and 3
Department of Radiology and
Medical Imaging, Ghent University, Hospital, De Pintelaan 185, 9000 Ghent, Belgium
ABSTRACT. Occasionally calcifications in abdominal organs, breasts and testicles have
been reported in pseudoxanthoma elasticum (PXE) patients. In the present study, an
ultrasound evaluation was performed of the abdomen and – in male patients – of the
testicles in 17 PXE patients and 17 heterozygous carriers. Blood samples were taken to
evaluate calcium load, liver and kidney function. Calcifications in liver, kidneys and
spleen were detected in 59% of the patients and in 23.5% of healthy carriers.
Parameters of kidney and liver function were normal in both groups, suggesting that
the calcifications have no direct effect on organ function. Testicular ultrasound
revealed parenchymous calcifications in all males investigated. Widespread, small
hyperechogenic foci resembling testicular microlithiasis were seen. In some carriers,
focal calcifications were identified. The current data suggest that visceral and testicular
calcifications are part of the phenotype of PXE patients. Their presence in some of the
healthy carriers are suggestive of subclinical manifestations in these relatives. The
natural history and long-term effects of the parenchymal calcifications remain to be
elucidated. As testicular microlithiasis may be associated with a higher risk for
malignancy, regular clinical and ultrasound follow-up seems indicated in these
patients.
Received 1 February 2005
Revised 4 May 2005
Accepted 15 July 2005
DOI: 10.1259/bjr/20801330
’ 2006 The British Institute of
Radiology
Pseudoxanthoma elasticum (PXE – OMIM [Online
Mendelian Inheritance in Man]# 264800) is an autosomal
recessive connective tissue disorder with multiple
systemic manifestations. The phenotype consists of a
triad of papular lesions and increased skin laxity in the
flexural areas of the body, angioid streaks in the ocular
fundus with eventually retinal haemorrhages and loss of
central vision, and accelerated atherosclerosis leading to
cardiovascular complications [1–5]. The incidence of this
rare disease has recently been estimated to be 1:75 000
[6], although this may be an underestimation due to the
high variability of the phenotype. Clinical manifestations
of the disease are attributed to alterations of elastic fibres
within the extracellular matrix of the affected organs.
These fibres undergo progressive fragmentation and
mineralization, which is the histopathological hallmark
of the disease [2]. Nevertheless, other components of the
extracellular matrix, such as collagen, fibrillins and
proteoglycans have either an abnormal morphology or
distribution [7, 8].
The gene responsible for PXE (ABCC6 - MIM# 603234)
is located on chromosome 16p13.1. It encodes an
ATP-dependent transporter the substrate of which is
as yet unknown. The relationship between this protein
and the phenotype also remains to be elucidated
[9–11].
It has been shown that healthy carriers of PXE have
similar cutaneous abnormalities at the ultrastructural
level, suggesting that a mild phenotype may be seen in
these individuals [12]. Although a higher incidence of
cardiovascular disease has been reported, carriers do not
develop other manifestations of PXE such as cutaneous
and/or retinal disease [12–14].
Occasionally, PXE patients have been reported in which
calcifications in several organs, including kidney, pancreas,
spleen and breasts have been observed [15–21].
Additionally, one case report has described the presence
of multiple calcifications in the testicles of a
14-year-old PXE-patient [22]. These reports suggest a
possible association of organ calcifications and PXE. To our
knowledge, no systematic screening of patients nor of
healthy carriers has been performed. We present a
comprehensive ultrasound study of 17 PXE patients in
whom the association between visceral and/or testicular
calcifications and PXE was established. Furthermore, 17
heterozygous relatives were screened to detect whether
similar lesions could be found.
Patients and methods
Sixteen patients with clinical, molecular and biopsy-
proven PXE were examined. Informed consent was
Address correspondence to: Anne De Paepe, Center for Medical
Genetics, Ghent University Hospital, De Pintelaan 185, B-9000
Ghent, Belgium.
The British Journal of Radiology, 79 (2006), 221–225
The British Journal of Radiology, March 2006 221](https://image.slidesharecdn.com/026britishjournalofradiology-britishinstituteofradiology-2006-130913065550-phpapp02/75/British-Journal-of-Radiology-British-Institute-of-Radiology-2006-eng-225-2048.jpg)
![obtained from all patients and the study was approved
by the Ethical Committee of the Faculty of Medicine of
the Ghent University Hospital. Our patient population
consisted of 5 men and 12 women. Ages ranged from
18 years to 80 years with an average of 54 years.
The group of 17 heterozygous carriers included
offspring as well as parents of patients (obligate carriers).
Additionally, siblings of patients proven to be hetero-
zygous carriers of an ABCC6 mutation were included.
The carrier group consisted of 11 men and 6 women.
Ages ranged from 16 years to 76 years with an average
age of 39 years.
All index-patients and carriers were personally exam-
ined at the PXE clinic of the Center for Medical Genetics
at the Ghent University Hospital. Thorough patient
histories were recorded in all individuals with special
consideration for signs and symptoms indicating hepatic,
renal or splenic dysfunction.
The full clinical protocol used at the PXE clinic of the
Center for Medical Genetics at the Ghent University
Hospital, including careful dermatological, ophthalmo-
logical and cardiovascular examinations and ultrasound
of the abdomen and testicles, was applied in both
groups. Ultrasound examinations were performed at
the Department of Sonography using a HDI 5000 system
(Philips, Brussels, Belgium) with a C5-2 and a L12-5
scanhead for the examination of the abdomen and
scrotum, respectively. To minimize interobserver varia-
tion three ultrasonographers performed the examina-
tions were blinded to patient information. Serum
analysis was performed to evaluate calcium load, liver
and kidney function in order to exclude other aetiologies
of parenchymal calcifications and to assess the possible
functional effect of the lesions. Parameters measured in
all individuals included serum concentrations of aspar-
tate amino transferase (AST), amino alanine transferase
(ALT), alkaline phosphatase (AF), gamma-glutamyl
transpeptidase (cGT), creatinine, urea, calcium and
phosphorus.
Skin biopsies were taken either in an affected skin area
or at the back of the neck when no lesion was
macroscopically apparent. Histological confirmation of
PXE was obtained with haematoxylin and eosin, van
Giesson and Von Kossa stains to detect the typical
anomalies of the elastic fibre.
Molecular screening of the ABCC6 gene was per-
formed using dHPLC (denaturing high performance
liquid chromatography) (Transgenomics, Cheshire, UK)
and subsequent sequencing of all ABCC6 exons in those
that showed abnormal dHPLC-patterns.
Results
Abdominal ultrasounds
Abdominal ultrasound revealed calcifications scat-
tered throughout the parenchyma of the kidneys (8
patients), liver (4 patients) or spleen (3 patients) in 10/17
(59%) of PXE patients (Figure 1a–d). In those with
visceral calcifications, kidneys were most frequently
affected (80%). In 3 out of 10 (30%) patients, two or
more organs were involved. The number of calcified
lesions ranged from a few in the spleen to widely
disseminated in the liver parenchyma. Calcifications
were seen as hyperechogenic foci with acoustic shadow-
ing, measuring 2–3 mm in diameter. Renal calcifications
were localized in the corticomedullary junction, but also
within the cortical tissue. Similar lesions could be
observed in 4 out of 17 healthy carriers. Two of those
had kidney calcifications while the others had lesions in
the liver. Other ultrasound findings included hepatic
haemangiomas and steatosis.
Serum tests to evaluate kidney and liver function were
performed in all patients and carriers examined. No
abnormalities of either liver enzymes nor serum creati-
nine and urea were observed. Calcium levels were
always within normal limits. None of the individuals
in this study had signs or symptoms indicative of
abnormal function of the liver, spleen or kidneys.
Testicular ultrasounds
Ultrasound of the scrotum was performed in four PXE
patients. In three multiple widespread, small hyperecho-
genic foci resembling a ‘‘heaven full of stars’’ were
identified throughout the parenchyma of both testicles
(Figure 2). This appearance matches the criteria of
classical testicular microlithiasis as described by
Dell’Acqua et al [23]. One patient had only few of these
lesions, compatible with limited testicular microlithiasis.
However, no histological confirmation of this diag-
nosis was obtained since none of the patients had any
complaint warranting a biopsy. No testicular tumours
were detected during the examination.
In two out of 11 healthy carriers examined, focal
calcifications of the testicular capsule or parenchyma
were observed. The parenchymatous calcification was a
small unilateral focus without acoustic shadowing. These
individuals were asymptomatic. Two carriers were
found to have a hyperechogenic mediastinum testis,
which can be considered a normal variant.
Discussion
PXE is a rare autosomal recessive disease character-
ized by fragmentation and calcification of the elastic
fibres. Clinical manifestations mainly consist of cuta-
neous, ophthalmological and cardiovascular lesions.
Case reports have mentioned the occurrence of calcifica-
tions in the visceral organs, breasts and testicles in some
individuals [15–21]. In this study, a standardized
examination protocol comprising abdominal and testi-
cular ultrasounds was used in 17 PXE patients to observe
whether calcified lesions in these organs could be
detected.
Due to the autosomal recessive inheritance of PXE,
parents and children of probands are obligate carriers of
one mutation in the ABCC6 gene. Previous ultrastruc-
tural studies in relatives of PXE patients have revealed
cutaneous morphologic alterations similar to those seen
in patients, although less severe in nature [12]. Trip et al
described a higher risk of coronary artery disease in
carriers of the frequent R1141X nonsense mutation [13].
These observations indicate that heterozygous carriers
may have mild PXE manifestations, albeit without
O M Vanakker, D Voet, M Petrovic et al
222 The British Journal of Radiology, March 2006](https://image.slidesharecdn.com/026britishjournalofradiology-britishinstituteofradiology-2006-130913065550-phpapp02/75/British-Journal-of-Radiology-British-Institute-of-Radiology-2006-eng-226-2048.jpg)

![As serum tests for liver and kidney function revealed
no abnormalities and none of the individuals examined
suffered from any disturbances of renal, hepatic or
splenic function, the calcified foci probably do not
interfere with liver, kidney or splenic function.
However, their natural history and long-term effects
remain to be elucidated.
Therefore an abdominal ultrasound at the time of
diagnosis may be indicated. Furthermore, regular
re-evaluation with serum tests and ultrasound are
advisable.
It has been previously reported that both abdominal
plain radiographs and CT are unable to visualize these
lesions [18]. In the only patient with renal foci in whom
abdominal radiographs were performed in this study, no
calcifications were visible. We did not perform CT
imaging in our population and can therefore not rule
out that, due to technical improvements and new
developments, these lesions can now be visualized.
However, since ultrasound proved to give sufficient
data and comparing the costs and radiation load of both
examinations, we feel that at present CT is not an added
value in the work-up of a PXE patient in a clinical setting.
In a research setting, however, it would be interesting to
find out if these lesions are indeed visible with modern
CT techniques and to evaluate their extent and char-
acteristics in comparison with ultrasound findings. Thus,
in view of all known aspects, ultrasound should be
considered the investigation of first choice for detection
of these calcifications on a routine basis.
Testicular ultrasounds
Testicular parenchymal calcifications were identified
in all male patients so far examined. These lesions,
described as bilateral, small, hyperechogenic foci, meet
the ultrasound criteria of testicular microlithiasis (TM).
The TM pattern is defined as usually bilateral hyper-
echogenic multiple small foci without acoustic shadow
and with complete or partial extension to the paren-
chyma. Cases in which five or more foci can be
demonstrated are defined as classical TM [24–27].
Cases that do not meet this criterion are designated as
limited TM. The imaging diagnosis can be confirmed by
showing intratubular microliths on biopsy [24–27]. Since
none of our patients had either complaints or fertility
problems testicular biopsies were considered unethical.
TM is of special interest due to its reported association
with testicular malignancy [29–36]. Nevertheless, it
remains unclear whether primary testicular tumours
actually occur more frequently in patients with pre-
existing TM. Large prospective studies are needed to
further clarify this issue. Until further data are available,
it seems cautious to consider patients with a TM-like
ultrasound image as having a potentially increased risk
of developing a testicular malignancy and to offer
regular ultrasound screening [28–34, 36].
The findings in healthy carriers were different from
those in patients in their extent and/or location within
the testicle. Multiple hyperechogenic foci confined to
the capsule or the mediastinum testis were detected,
the latter probably being a normal variant. Although
anatomically this could also be compatible with
calcifications in the rete testis [37], we cannot be sure
of this without a biopsy which is unjustifiable in these
patients.
In another carrier, we observed one parenchymatous
calcification which could be considered as limited TM.
The remaining parenchyma, however, was completely
normal and we cannot exclude that these findings are
fortuitous. Since they have, to our knowledge, not
previously been described in PXE, further study on a
larger group of carriers would be of interest.
Acknowledgments
The authors are very grateful to all PXE patients and
families for their kind collaboration. This work was
supported by a grant from the Ghent University (GOA-
12051203). O Vanakker is a research assistant supported
by the Fund for Scientific Research – Flanders (Belgium).
References
1. Bercovitch L, Terry P. Pseudoxanthoma Elasticum 2004. J
Am Acad Dermatol 2004;51(1 Suppl.):S13–4.
2. Hu X, Plomp AS, van Soest A, Wijnholds J, de Jong PTVM,
Bergen A, et al. Pseudoxanthoma Elasticum: a clinical,
histopathological and molecular update. Surv Ophthalmol
2003;48:424–38.
3. Neldner KH. Pseudoxanthoma Elasticum. Clin Dermatol
1988;6:83–92.
4. Scherer DW, Sapadin AN, Lebwohl MG. Pseudoxanthoma
Elasticum: an update. Dermatology 1999;199:3.
5. Ringpfeil F. Selected disorders of connective tissue: pseudo-
xanthoma elasticum, cutis laxa and lipoid proteinosis. Clin
Dermatol 2005;23:41–6.
6. Bergen A, Plomp AS, Gorgels T, De Jong P. Van gen naar
ziekte; pseudoxanthoma elasticum en het ABCC6-gen. Ned
Tijdschr Geneeskd 2004;148:1586–9.
7. Baccarani-Contri M, Vincenzi D, Cicchetti F, Mori G,
Pasquali-Ronchetti I. Immunochemical identification of
abnormal constituents in the dermis of pseudoxanthoma
elasticum patients. Eur J Histochem 1994;38:111–23.
8. Longas MO, Wisch P, Lebwohl MG, Fleischmajer R.
Glycosaminoglycans of skin and urine in pseudoxanthoma
elasticum: evidence for chondroitin 6-sulfate alteration. Clin
Chem Acta 1986;155:227–36.
9. Ilias A, Urban Z, Seidl T, Le Saux O, Sinko E, Boyd C, et al.
Loss of ATP-dependent transport activity in Pseudo-
xanthoma Elasticum-associated mutants of human ABCC6
(MRP6). J Biol Chem 2002;277:16860–7.
10. Le Saux O, Beck K, Sachsinger C, Silvestri C, Treiber C,
Go¨ring HHH, et al. A spectrum of ABCC6 mutations is
responsible for pseudoxanthoma elasticum. Am J Hum
Genet 2001;69:749–64.
11. Le Saux O, Urban Z, Tschuch C, Csiszar K, Bacchelli B,
Quaglino D, et al. Mutations in a gene encoding an ABC
transporter cause pseudoxanthoma elasticum. Nat Genet
2000;25:223–7.
12. Bacchelli B, Quaglino D, Gheduzzi D, Taparelli F, Boraldi F,
Trolli B, et al. Identification of heterozygote carriers in
families with a recessive form of pseudoxanthoma elasti-
cum (PXE). Mod Pathol 1999;12:1112–23.
13. Trip MD, Smulders YM, Wegman JJ, Hu X, Boer JMA,
ten Brink JB, et al. Frequent mutation in the ABCC6 gene
(R1141X) is associated with a strong increase in the preva-
lence of coronary artery disease. Circulation 2002;160:773–5.
14. van Soest S, Swart J, Tijmes N, Sandkuijl LA, Rommers J,
Bergen AAB. A locus for autosomal recessive
O M Vanakker, D Voet, M Petrovic et al
224 The British Journal of Radiology, March 2006](https://image.slidesharecdn.com/026britishjournalofradiology-britishinstituteofradiology-2006-130913065550-phpapp02/75/British-Journal-of-Radiology-British-Institute-of-Radiology-2006-eng-228-2048.jpg)

![Life-threatening common carotid artery blowout: rescue
treatment with a newly designed self-expanding covered nitinol
stent
1
H S KIM, MD, 1
D H LEE, MD, PhD, 4
H J KIM, MD, 1
S J KIM, MD, PhD, 2
W KIM, MD, 3
S Y KIM, MD, PhD
and 1
D C SUH, MD, PhD
1
Department of Radiology, 2
Emergency Medicine and 3
Otorhinolaryngology, Asan Medical Center,
University of Ulsan, College of Medicine, 388-1 Poongnap Dong, Songpa-Gu, Seoul, 138-736 and
4
Department of Radiology, DaeJeon Catholic Hospital, Republic of Korea
ABSTRACT. Carotid blowout is a devastating complication in patients with head and
neck malignancy. A covered stent offers an alternative to treatment of a carotid
blowout patient thought to be at high risk for surgery or carotid occlusion. Stent
placement in the common carotid artery or carotid bulb is a technical challenge
because of large luminal diameter and luminal calibre discrepancy between internal
carotid artery and common carotid artery. We present four patients with common
carotid rupture and massive bleeding who were treated with self-expanding covered
stents, among them, two cases were treated with newly designed self-expanding
polytetrafluoroethylene (PTFE)-covered nitinol stents.
Received 1 June 2005
Accepted 15 July 2005
DOI: 10.1259/bjr/66917189
’ 2006 The British Institute of
Radiology
Endovascular management of acute bleeding in the
head and neck by occlusion of the offending vessel with
coils or detachable balloons has been the alternative to
surgical exploration [1]. However, these procedures have
the potential for producing delayed cerebral ischaemic
complications in 15–20% of patients [2]. Covered stent
deployment has been developed as an effective treat-
ment option in carotid blowout patients thought to be at
high risk for surgery or carotid occlusion [2]. However,
stent placement for the management of carotid blowout
is not always effective in cases of head and neck
malignancy involving extensive segment of the common
carotid artery (CCA) with relatively large calibre or
carotid bulb with luminal calibre discrepancy between
internal carotid artery (ICA) and CCA.
We report four cases of CCA rupture with massive
bleeding in patients with head and neck malignancies
and a history of long-term radiation treatment who were
treated using self-expanding covered stents. Among
these patients, two cases were treated by a newly
designed covered stents which have a bare area in both
their proximal and distal portions.
Patients and methods
During a 5-year period between May 1999 and June
2004, we treated four patients (four males, aged 57–
68 years) with common carotid rupture, who had head
and neck malignancies, and who had histories of
radiation therapy alone or combined with chemotherapy.
The patients’ characteristics are listed in Table 1. All of
these patients presented with life-threatening massive
neck or oral bleedings, unstable vital signs and altered
mental changes. The procedures were performed under
local anaesthesia with 1% lidocaine and conscious
sedation with intravenously administered midazolam
hydrochloride (Versed; Roche Laboratories, Nutley, NJ).
A 9-F introducer sheath was positioned in the right
common femoral artery. The patients did not have
systemic heparinization as they were having massive
bleeding. Using digital roadmap guidance, a 0.0350
hydrophilic guidewire (Terumo, Tokyo, Japan) was
carefully manoeuvred into the ICA. A 4-F catheter
(Terumo, Tokyo, Japan) was then advanced over the
wire. After obtaining an angiogram with a 4 F catheter, a
steep 0.0350 exchange length wire (Terumo, Tokyo,
Japan) was introduced beyond the diseased segment
into ICA. A self-expanding covered nitinol stent (NITI-S
Stent; Taewoong Medical, Seoul, Korea) was then passed
over the exchange guidewire and carefully positioned at
the level of the bleeding site including pseudoaneurysm.
The stent was then deployed across the corresponding
segment of the pseudoaneurysm. 300 mg of oral clopi-
dogrel (Plavix; Bristol Myers-Squibb, New York, NY)
were given after deploying the stents to minimize
the risk of stent thrombosis resulting from platelet
aggregation.
Profile of PTFE covered nitinol stent
NITI-S stent is based on the longitudinal wire mesh
design (Figure 1). Nitinol wire with 0.0070 in diameter
Address correspondence to: Dae Chul Suh, Department of
Radiology, Asan Medical Center, University of Ulsan College of
Medicine, 388-1 Poongnap-dong, Songpa-gu, Seoul 138-736, Korea.
This study was supported by a grant of the Korea Health 21 RD
Project, Ministry of Health Welfare, Republic of Korea (03-PJ1-
PG1-CH06-0001).
The British Journal of Radiology, 79 (2006), 226–231
226 The British Journal of Radiology, March 2006](https://image.slidesharecdn.com/026britishjournalofradiology-britishinstituteofradiology-2006-130913065550-phpapp02/75/British-Journal-of-Radiology-British-Institute-of-Radiology-2006-eng-230-2048.jpg)
![was used for the single-wire woven stent making the
stent cells in the both ends closed. Three gold tip markers
were attached at each end of the stent margin to enhance
fluoroscopic visibility. Because the stent is adhered onto
the PTFE graft by polyurethane, the stent is disposed
between polyurethane at its outer surface and the PTFE
sheet at its inner surface. Polyurethane would also give
PTFE more durability.
The diameters and lengths of the stents were 10 mm
and 70 mm in all cases, and additional 10 mm 6 50 mm
stents placements were performed in cases 1 (Figure 2)
and 2 (Figure 3). The 10 mm 6 70 mm stent which was
designed for transjugular intrahepatic portosystemic
shunt (TIPS) consisted of a proximal covered area
(50 mm in length) and a distal bare area (20 mm in
length). The newly designed 10 mm 6 50 mm stent
consisted of a middle PTFE covered segment (40 mm)
and a 5 mm bare segment at both proximal and distal
ends (Figure 1).
Results
The stent delivery and placement were all success-
ful. Immediately after the procedure, vital sign and
neurological status of the patients became normalized
and follow-up angiogram showed occlusion of pseudoa-
neurysm and preservation of the parent arterial flow in
all cases. Re-bleeding at the proximal margin of the
stented segment, suggesting extension of the disease
beyond the stent margin, required another covered stent
deployment in two patients (case 1 and 2). In these two
patients, an additional newly designed 10 mm 6 50 mm
stent was placed in the lower portion of the previous
stent and no recurrent haemorrhage was found on
follow-up for 2 months and 5 months, respectively.
Discrepancy of vessel lumen size between the ICA and
the CCA required bare stenting within the covered stent
in a patient with carotid bulb blowout (case 2). Treatment
device, clinical course, and follow-up results for study
patients were listed in Table 1.
Discussion
The reported incidence of carotid rupture in patients
who have had a neck dissection with or without tumour
resection is 3–4% [3]. Carotid blowout is associated with
approximately 60% neurological morbidity and 40%
mortality in patients with associated conditions such as
Table 1. Summary of patients with covered stent placements in the common carotid artery
No. of
cases
Age/Gender Presentation Underlying
disease
Bleeding
location
Treatment device
(diameter6length)
Clinical course
Case 1 62/M Massive bleeding
at neck open wound
Oesophageal
carcinoma
Mid-CCA 10670 mm CS
10650 mm CS
Re-bleeding after 11 days,
stable for 2 months
Case 2 57/M Massive oral bleeding Nasopharyngeal
carcinoma
Carotid bulb 10670 mm CS
9.0640 mm BS
10650 mm CS
Re-bleeding after 6
weeks, stable for 5
months, died because
of massive infarcts due
to contralateral ICA
invasion
Case 3 68/M Massive oral bleeding Laryngeal
carcinoma
Distal CCA 10670 mm CS Discharged in stable con-
dition 1 day later and
lost follow-up
Case 4 61/M Massive oral bleeding Hypopharyngeal
carcinoma
Carotid bulb 10670 mm CS Discharged in stable con-
dition 1 day later and
transferred to other
hospital
CCA, common carotid artery; CS, covered stent; BS, bare stent; ICA, internal carotid artery.
(a) (b)
Figure 1. Photographs of the covered stent (Taewoong Medical, Seoul, Korea) composed of a self-expanding nitinol wire
covered with PTFE. (a) The 10 mm 6 50 mm stent used secondarily in cases 1 and 2 consists of proximal and distal bare segments
of 5 mm and a middle covered area of 40 mm. (b) Note the structural relationship of the stent wire and PTFE graft. Outer
polyurethane layer connects the stent wire and PTFE graft. Stent wire thickness is 0.0070 in size.
Life-threatening common carotid artery blowout
The British Journal of Radiology, March 2006 227](https://image.slidesharecdn.com/026britishjournalofradiology-britishinstituteofradiology-2006-130913065550-phpapp02/75/British-Journal-of-Radiology-British-Institute-of-Radiology-2006-eng-231-2048.jpg)

![pharyngocutaneous fistula, recurrent tumour, or radia-
tion necrosis [4]. The history of irradiation therapy adds
a 7.6-fold increased risk of developing carotid blowout in
patients with head and neck malignancy [5].
Treatment of extracranial carotid artery pseudoaneu-
rysm has been open surgery with resection and
reconstruction or carotid artery ligation. However, this
condition often makes patient haemodynamically
unstable and causes significantly decreased cerebral
perfusion. Pseudoaneurysm is composed only of fibrous
tissue and contains no normal vessel wall elements:
neither do these aneurysms have a real neck. Therefore,
the dissection and preparation of the aneurysmal sac for
clipping involves an extremely high risk of perioperative
rupture [6].
The advent of various endovascular treatments includ-
ing permanent balloon occlusion or coil embolisation has
expanded the therapeutic options for patient with
rupture and pseudoaneurysm of ICA or CCA [3].
However, as many as 15–20% of patients whose carotid
blowout is managed with permanent balloon occlusion
may develop immediate or delayed cerebral ischaemia
[2]. In all of our patients, as their vital signs and mental
status were unstable and the examinations for the
cerebral perfusion before the procedure such as the
balloon occlusion test were impossible, it was not known
whether the occlusion procedure of the CCA would have
further compromised cerebral perfusion. Thus, endovas-
cular sacrifice of the CCA was not reliable. The choice of
endovascular carotid stent placement combined with
Guglielmi detachable coils (GDC) has been reported [7].
However, long-term radiation therapy in patients with
head and neck cancer could injure normal head and neck
structures, thus, the surrounding radiation induced soft
tissue changes cannot offer enough support to the parent
artery and to the pseudoaneurysmal sac. In case 2, the
patient was initially treated with coil embolisation
because stent placement was considered difficult due
to a discrepancy in the size of vessel lumen between the
ICA and the CCA. However, as coil embolisation alone
did not occlude the pseudoaneurysm of the CCA,
additional stent placement was then performed.
Kiyosue et al, reported dispersion and migration of coils
in carotid blowout patient treated by parent-artery
occlusion with coils [8].
Covered stents are already in clinical use for treating
occlusive, aneurysmal, and traumatic peripheral arterial
disease, for repairing aortic aneurysm, and in transju-
gular portosystemic shunting [9]. In several previous
reports, covered stents had been used in the treatment of
ICA pseudoaneurysm [10–12]. However, the stent place-
ment for the management of carotid blowout is not
always effective in case of head and neck malignancy
involving extensive segment of the CCA with relatively
large calibre or carotid bulb with luminal calibre
discrepancy between the ICA and the CCA. In general
treatment of ICA and CCA pseudoaneurysm, either
5 mm or 7 mm diameter stents consistent with the CCA
or ICA lumen were usually used as well as 9-F arterial
sheaths to accommodate the outer diameter as its
delivery system. In our cases, we used large-bore
10 mm diameter self-expanding stents via exchange
guidewire through a 9-F arterial sheath as its delivery
system. With these methods on the realtime roadmap
fluoroscopy, there was no difficulty in exact positioning
and deployment.
Additional pseudoaneurysm formation at the lower
end of the covered stented margin of the CCA can be due
to the radiation-induced surrounding soft tissue weak-
ness or due to the rigid lower end of the covered stent
structure because the covered stent used at the initial
attempt in our patients did not have a bare portion at the
lower end. The newly designed 10 mm 6 50 mm stents
were used in cases 1 and 2. It consisted of a covered
segment (40 mm) and 5 mm bare segments at proximal
and distal ends. Although the long-term patency rates of
these stents and their risk of thromboembolic or other
complications in the treatment of the CCA rupture and
pseudoaneurysm formation are unknown, the vital signs
and neurological status of these patients became stable
after these procedures and there were no complications
(c)
Figure 2. (Cont.) (c) After placement of an additional stent,
angiography shows no recurrent haemorrhage.
Life-threatening common carotid artery blowout
The British Journal of Radiology, March 2006 229](https://image.slidesharecdn.com/026britishjournalofradiology-britishinstituteofradiology-2006-130913065550-phpapp02/75/British-Journal-of-Radiology-British-Institute-of-Radiology-2006-eng-233-2048.jpg)


![Quantitative assessment of hip osteoarthritis based on image
texture analysis
1
I S BONIATIS, MSc, 1
L I COSTARIDOU, PhD, 2
D A CAVOURAS, PhD, 3
E C PANAGIOTOPOULOS, MD, PhD
and 1
G S PANAYIOTAKIS, PhD
1
University of Patras, School of Medicine, Department of Medical Physics, 265 00 Patras,
2
Technological Educational Institute of Athens, Department of Medical Instrumentation
Technology, 122 10 Athens and 3
University of Patras, School of Medicine, Department of
Orthopaedics, 265 00 Patras, Greece
ABSTRACT. A non-invasive method was developed to investigate the potential capacity
of digital image texture analysis in evaluating the severity of hip osteoarthritis (OA)
and in monitoring its progression. 19 textural features evaluating patterns of pixel
intensity fluctuations were extracted from 64 images of radiographic hip joint spaces
(HJS), corresponding to 32 patients with verified unilateral or bilateral OA. Images were
enhanced employing custom developed software for the delineation of the articular
margins on digitized pelvic radiographs. The severity of OA for each patient was
assessed by expert orthopaedists employing the Kellgren and Lawrence (KL) scale.
Additionally, an index expressing HJS-narrowing was computed considering patients
from the unilateral OA-group. A textural feature that quantified pixel distribution non-
uniformity (grey level non-uniformity, GLNU) demonstrated the strongest correlation
with the HJS-narrowing index among all extracted features and utilized in further
analysis. Classification rules employing GLNU feature were introduced to characterize a
hip as normal or osteoarthritic and to assign it to one of three severity categories,
formed in accordance with the KL scale. Application of the proposed rules resulted in
relatively high classification accuracies in characterizing a hip as normal or
osteoarthritic (90.6%) and in assigning it to the correct KL scale category (88.9%).
Furthermore, the strong correlation between the HJS-narrowing index and the
pathological GLNU (r520.9, p,0.001) was utilized to provide percentages quantifying
hip OA-severity. Texture analysis may contribute in the quantitative assessment of OA-
severity, in the monitoring of OA-progression and in the evaluation of a
chondroprotective therapy.
Received 13 December
2004
Revised 8 June 2005
Accepted 1 July 2005
DOI: 10.1259/bjr/87956832
’ 2006 The British Institute of
Radiology
Osteoarthritis (OA) is a common joint disease that
causes degenerative alterations in the hip as well as other
joints [1]. Characteristic radiological manifestation of hip
OA includes irregular superolateral, superior or super-
omedial hip joint space (HJS) narrowing, femoral and
acetabular subchondral bone sclerosis, development of
marginal osteophytes, as well as femoral and acetabular
subchondral cysts formation [2].
Plain film radiography remains the most prevalent
imaging modality for diagnosis of hip OA in clinical
routine, despite its limited sensitivity compared with
innovative imaging techniques, such as CT and MRI [3].
Radiographic assessment of hip OA comprises diagnosis,
evaluation of severity, and monitoring of progression of
structural alterations related to the disease [4]. A number of
qualitative or semi-quantitative grading systems have been
proposed for assessing hip OA [5–8], with the Kellgren and
Lawrence (KL) grading scale [5] being considered the gold
standard despite its deficiencies [9]. A reliable index for
monitoring hip OA progression on pelvic radiographs is
the progression of HJS-narrowing [6, 10], which may be
estimated either manually [11, 12], or by computerized
methods [13–15]. The latter are more sensitive, accurate,
reproducible, and thus more reliable [16].
Texture analysis refers to algorithms developed to
quantify image texture information that may, or may not,
be perceived visually [17]. Although texture analysis has
been previously employed in examining knee OA by
computer processing of radiographic images [18, 19], hip
OA has only been investigated in one study by computer
analysis (fractal geometry) of digitized histological
sections from the femoral head [20]. So far, the
quantitative assessment of hip OA has mainly relied on
measurements of HJS-width or HJS-area performed on
pelvic radiographs [11–15]. To our knowledge, the
textural properties of radiographic HJS in OA hips, as
well as the capability of computer based radiographic
texture analysis in evaluating the severity of hip OA
have not been previously investigated.
In the present study, a non-invasive method was
developed for analysing the structure of HJS from pelvic
radiographs and for evaluating the severity of hip OA,
Address correspondence to: George S Panayiotakis.
The first author was supported by a grant from the State Scholarship
Foundation (SSF), Greece.
The British Journal of Radiology, 79 (2006), 232–238
232 The British Journal of Radiology, March 2006](https://image.slidesharecdn.com/026britishjournalofradiology-britishinstituteofradiology-2006-130913065550-phpapp02/75/British-Journal-of-Radiology-British-Institute-of-Radiology-2006-eng-236-2048.jpg)
![employing computerized texture analysis. In particular,
(i) textural features were extracted from the outlined
region of each radiographic HJS, (ii) textural-feature
thresholds, bearing good correlation to KL scale severity
grades, were established for grading OA automatically,
and (iii) an index was introduced for evaluating OA-
severity.
Methods and materials
Radiographs and patients
32 anteroposterior pelvic radiographs of standing
weight-bearing osteoarthritic patients were collected,
giving in total 64 hip joint images. All radiographs were
retrieved from the medical records of individuals who
were candidates for total hip arthroplasty at the
Department of Orthopaedics in our Hospital. From the
total number of patients, 18 were verified for unilateral
and 14 for bilateral hip OA. Patients’ ages ranged
between 49 years and 83 years with a mean age of 66.7
years. The American College of Rheumatology criteria
[21] were used for OA diagnosis.
All pelvic radiographs were obtained using a Siemens
X-ray unit (Polydoros 50; Siemens, Erlangen, Germany).
Radiographic protocol comprised alignment of the X-ray
beam 2 cm above the pubic symphysis, a focus–film
distance of 100 cm, tube voltage between 70 kVp and
80 kVp, and use of a fast screen and film cassette (30 cm
6 40 cm). Digitization of radiographs was performed at
12 bits (4096 grey levels) and 146 ppi (5.8 pixels mm21
)
spatial resolution, using a laser digitizer for medical
applications (Lumiscan 75; Lumisys, Sunnyvale, CA)
[22]. Digitizer performance was evaluated employing a
quality control protocol [23]. All radiographs fulfilled a
specific criterion concerning safeguard against variations
in hip rotation, introduced by the experienced orthopae-
dists. According to this criterion, the difference between
the widths of projected lesser trochanters on each
radiograph should not exceed 8 mm. Measurements on
radiographs were performed by custom developed
software [24–26].
Three experienced orthopaedists assessed the severity
of OA employing the KL grading scale. The KL scale
defines five categories of OA-severity (0–4), with KL
grades ¢2 corresponding to osteoarthritic pathology [5].
Based on the KL scale, patients were grouped into three
major OA-severity categories: Normal/Doubtful (KL50,
1), Mild/Moderate (KL52, 3), and Severe (KL54).
Accordingly, 18 unilateral-OA patients were assigned
to Normal/Doubtful category, 9 to Mild/Moderate and 9
to Severe. The corresponding numbers for the bilateral
patients were 0/7/21.
Radiograph enhancement
Pelvic radiographs were first processed by means of
custom developed software based on the contrast-limited
adaptive histogram equalization (CLAHE) method [27], in
order to emphasise the articular margins of the hip joint.
The CLAHE method partitioned the images into con-
textual non-overlapping regions. Within each region the
local histogram was obtained, clipped to a specific limit
and then histogram equalization was performed within
the region. Figure 1 shows a digitized radiograph
enhanced by the implementation of CLAHE algorithm.
On each enhanced radiograph two regions of interest
(ROIs), one from the osteoarthritic HJS and one from the
contralateral normal HJS, were manually outlined by three
experienced orthopaedists, in accordance with the method
proposed by Conrozier et al [13]. As shown in Figure 2,
each ROI was defined within an acute angle determined
by the patient’s standard anatomical landmarks.
Texture analysis of radiographic hip joint space
A total of 19 textural features were extracted from each
segmented HJS-ROI (see Figure 3), utilizing custom
(a) (b)
Figure 1. Example of (a) an original and (b) the corresponding processed digitized radiograph with the contrast-limited
adaptive histogram equalization enhancement algorithm.
Assessment of hip osteoarthritis using texture analysis
The British Journal of Radiology, March 2006 233](https://image.slidesharecdn.com/026britishjournalofradiology-britishinstituteofradiology-2006-130913065550-phpapp02/75/British-Journal-of-Radiology-British-Institute-of-Radiology-2006-eng-237-2048.jpg)
![developed algorithms. (i) Four textural features were
computed from the ROI’s grey level histogram [28], (ii)
10 from the ROI’s grey level co-occurrence matrix [29]
and (iii) five using the ROI’s grey level run-length matrix
[30].
Textural feature selection
From the extracted 19 textural features, selection was
based on their correlation to an index evaluated for each
of the unilateral OA-group patient, employing Equation
(1):
HJS{narrowing~
HJSAnormal{HJSApath
HJSAnormal
|100
where HJSAnormal and HJSApath express the number of
pixels corresponding to the manually segmented con-
tralateral normal and osteoarthritic HJS-ROIs, respec-
tively. We have introduced this index, since it quantifies
OA-severity by expressing the HJS-narrowing as a
percentage of HJS-area difference between the osteoar-
thritic and contralateral normal HJS. This index is
expected to give zero value in case of normal joints,
since differences in hip joint spaces have been shown to
be negligible in normal individuals [13, 31].
The validity of the proposed HJS-narrowing index was
evaluated by examining its correlation with the KL scale,
since the latter is considered to be the gold standard for
OA-severity assessment. Analysis of HJS-narrowing
index performance compared with KL scale is provided
in a corresponding paragraph of the Results and
Discussion section.
Statistical analysis
The existence of statistically significant differences
between osteoarthritic and contralateral normal hips was
investigated in the patients of the unilateral OA-group.
Differences in HJS-area or in textural features were
examined by means of the two-tailed student’s paired t-
test. To assess the relationship between the HJS-narrow-
ing index and each textural feature extracted from
osteoarthritic HJS-ROIs, the Pearson’s correlation coeffi-
cient was used. To evaluate intraobserver and inter-
observer reproducibility concerning HJS-area
measurements and GLNU calculated values, the coeffi-
cient of variation (CV) was used [32]. Accordingly, all
radiographs were separately evaluated by each one of
the experienced orthopaedists twice, with about a
1 month interval between evaluations. Evaluation scores
were used to calculate the CV, which provides (e.g. see
Conrozier et al [13]) an assessment of interobserver or
intraobserver reproducibility; low coefficient values
correspond to high degree of reproducibility. Referring
to measured quantities, normality of their distributions
was assessed by means of the Lilliefors test [33]. For non-
gaussian distributions, a logarithmic transformation
(log10) was applied to corresponding data. Matlab
Statistics Toolbox and Matlab Curve Fitting toolbox
(The MathWorks Inc., Natick, USA) were used for
statistical and regression analysis.
Results and discussion
In a digital image, texture is characterized by intensity
properties (tone) and spatial inter-relationships (struc-
ture) of image pixels, depicting spatial distribution of
Figure 2. Hip joint space-region of interest (HJS-ROI)
delineation within AOB. A: highest point of the homolateral
sacral wing, O: centre of the femoral head, and B: lateral rim
of the acetabulum.
Figure 3. Grey scale image of hip joint space region of
interest (ROI) delineated in Figure 2.
(1)
I S Boniatis, L I Costaridou, D A Cavouras et al
234 The British Journal of Radiology, March 2006](https://image.slidesharecdn.com/026britishjournalofradiology-britishinstituteofradiology-2006-130913065550-phpapp02/75/British-Journal-of-Radiology-British-Institute-of-Radiology-2006-eng-238-2048.jpg)
![grey level variations in the image [29, 34]. In a digitized
plain radiograph, a two-dimensional spatial distribution
of grey-level variation is formed by projecting on a two-
dimensional level the three-dimensional spatial distribu-
tion of the X-ray attenuation coefficients [17]. In the
present paper, textural properties of each analysed
radiographic HJS-ROI were attributed to X-ray attenua-
tion, due to superimposed three-dimensional anatomical
structures of articular cartilage, posterior acetabular wall
and iliac bone. Therefore, the analysed radiographic ROI
comprises of either osteoarthritic and/or normal super-
imposed anatomical components. Consequently, digital
image texture analysis attempts to assess the existence
and/or severity of structural alterations related to OA.
In patients with unilateral hip OA, statistical analysis
revealed the existence of statistically significant differ-
ences in 11 (out of 19) textural features values between
osteoarthritic and contralateral normal HJS-ROIs. Mean
values (¡ standard deviation (SD)) of significantly
differing textural features are presented in Table 1.
These differences demonstrate textural alterations in
radiographic HJS due to OA, which can be attributed to
cartilage and subchondral bone tissue alterations asso-
ciated to the disease. Articular cartilage performs
mechanical functions providing transmission and dis-
tribution of high loads to underlying bone, maintenance
of contact stresses at low levels, reduced frictional
resistance to movement and shock absorption with these
biomechanical properties being related to cartilage
molecular–biochemical composition [35, 36]. Typical
OA manifestations concern softening, ulceration, focal
disintegration and the final loss of articular cartilage [37].
Alterations in chemical composition of articular cartilage
have been associated with remodelling (increased den-
sity and stiffness) of subchondral bone in the form of
subchondral sclerosis [38, 39]. Taking into account that
structural alterations concern only osteoarthritic hips,
differentiation of textural properties between normal and
osteoarthritic HJS of unilateral OA-patients seems
reasonable.
Previous studies on quantitative assessment of hip OA
rely on measurements of the width or area of the
radiographic HJS [11–15]. In the present study, hip OA-
severity was estimated by the introduction of the HJS-
narrowing index that evaluates the percentage of HJS-
area difference between the osteoarthritic and the
contralateral normal hip (Equation (1)). Repeated mea-
surements of the HJS-area concerning the same observer
were not found to differ significantly. Intraobserver
reproducibility was found on average high for both the
HJS area measurements (CV53.4%) and the correspond-
ing GLNU values (CV53.9%). Similarly, interobserver
reproducibility was also found high, 4.2% and 4.4% for
HJS-area measurements and GLNU values, respectively.
Mean values (¡SD) of HJS-area for osteoarthritic and
contralateral normal hips were found equal to 33.7
(¡20.3) mm2
and 105.0 (¡23.8) mm2
, respectively. HJS-
area values were statistically smaller (p,0.001) in
osteoarthritic than in the contralateral normal hips, while
previous studies on normal individuals have found no
statistical differences between the two hips [13, 31]. HJS-
narrowing index was evaluated for each one of the 18
unilateral patients and the mean and standard deviation
of the HJS-narrowing index were calculated for the
Mild/Moderate and Severe OA categories. Based on
these means and standard deviations, classification rules
(see Table 2) regarding the assessment of OA-severity
were introduced (HJS-narrowing index Mean value ¡
2SD). Referring to Table 2, an osteoarthritic hip was
characterized as Severe if its HJS-narrowing index was
greater than 77.9, as Mild/Moderate for index values
within the interval [11.6, 77.9], and as Normal/Doubtful
for OA if index values were lower than 11.6.
The introduced classification rules were tested against
the KL classification of the unilateral OA patients
(Table 3). Referring to Table 3, all hips corresponding
to Mild/Moderate OA-severity category were classified
correctly, while classification accuracy of hips with
Severe OA was 77.8%, resulting in a relatively high
overall classification precision of 88.9%. Taking into
consideration that our method relies solely on the
assessment of HJS-narrowing, deviations of our results
from the KL scale may be attributed to the fact that the
KL scale evaluates, besides HJS-narrowing, the presence
of osteophytes, subchondral sclerosis, and subchondral
cysts.
Feature selection on the basis of Pearson’s correlation
coefficients between each of the textural features
extracted from osteoarthritic HJS-ROIs and the HJS-
narrowing index are summarized in column 4 of Table 1.
The strongest correlation was found between the HJS-
narrowing index and the pathological GLNU textural
feature (r520.9, p,0.001). This relationship is presented
graphically in Figure 4. As it can be observed, a
Table 1. Mean values (¡SD) of statistically significantly
differing textural features of contralateral normal and
osteoarthritic HJS-ROIs
Textural feature Normal Osteoarthritic R
Grey level co-occurrence matrices-mean values
Entropy 0.7 (¡0.2) 0.8 (¡0.2) 0.2
Contrasta
20.7 (¡0.2) 20.6 (¡0.2) 0.3
Inverse difference moment 0.9 (¡0.1) 0.9 (¡0.1) 20.4
Sum of squaresa
20.3 (¡0.3) 20.2 (¡0.3) 0.2
Difference entropy 0.2 (¡0.1) 0.2 (¡0.1) 0.3
Difference variance 0.2 (¡0.1) 0.2 (¡0.1) 0.3
Grey level run length matrices-mean values
Short runs emphasisa
20.5 (¡0.1) 20.4 (¡0.1) 0.5
Long runs emphasis 12.9 (¡3.0) 10.1 (¡2.9) 20.6
Grey level non-uniformity 415.2 (¡92.8) 139.6 (¡73.8)20.9
Run length non-uniformity 305.0 (¡81.2) 110.0 (¡59.8)20.7
Runs percentagea
20.5 (¡0.1) 20.4 (¡0.1) 0.6
SD, standard deviation; HJS-ROIs, hip joint space regions of
interest.
a
Values after logarithmic transformation (log10).
Table 2. Classification rules for assessment of osteoarthritis
severity concerning HJS-narrowing index
Osteoarthritis
severity according
to KL grading scale
HJS-narrowing
index,
mean ¡2SD
Classification rule
Severe 82.8 (¡2?8.2) HJS-narrowing
index .77.9
Mild/Moderate 50.5 (¡2?19.5) 11.6¡HJS-narrowing
Index¡77.9
KL, Kellgren and Lawrence; SD, standard deviation; HJS, hip
joint space.
Assessment of hip osteoarthritis using texture analysis
The British Journal of Radiology, March 2006 235](https://image.slidesharecdn.com/026britishjournalofradiology-britishinstituteofradiology-2006-130913065550-phpapp02/75/British-Journal-of-Radiology-British-Institute-of-Radiology-2006-eng-239-2048.jpg)
![regression line, described by Equation (2):
HJS{narrowing~{0:275|GLNUpathz105
fitted data adequately. The negative slope of the
regression line reflects the fact that in advanced stages
of the disease, characterized by greater HJS-narrowing
and thus higher HJS-narrowing index values, grey level
intensities are more uniformly distributed (see Appendix
1) [30] within the region of radiographic HJS.
Subsequently, the selected GLNU textural feature was
utilized in classification rules concerning the assessment
of hip OA-severity. Based on the mean and standard
deviation of the GLNU values, which were computed
from the normal hips of the unilateral OA-group, a
reference threshold value for GLNU, equal to 322.5 was
employed (see Table 4) for characterizing a hip as either
normal (GLNU.322.5) or osteoarthritic (GLNU¡322.5).
Using the contralateral normal hip for establishing
thresholds for hip osteoarthritis has been also employed
in previous studies. Conrozier et al [13] suggested the
establishment of reference values by measuring the HJS-
width and HJS-area of the normal hips in patients with
unilateral OA, while other studies used the minimum
joint space width for classifying a hip as osteoarthritic [7,
40–44]. In the present study, however, a textural-feature
based classification rule was employed instead.
For verification purposes, GLNU values extracted
from the HJS-ROIs of the unilateral osteoarthritic
patients were subjected to the specific rule. It was found
that 17/18 (94.4%) of the contralateral normal hips and a
similar number (17/18) of the osteoarthritic hips were
characterized correctly. When the same classification rule
was applied to the bilateral OA-group, 24/28 (85.7%)
hips were correctly characterized as osteoarthritic. In
total, an overall classification accuracy of 90.6% (58/64),
for assigning normal and osteoarthritic hips to the
correct category, was achieved.
Besides characterizing a hip as normal or osteoarthitic,
the capacity of GLNU textural feature was tested in
establishing rules for differentiating hip OA-severity.
Accordingly, rules for distinguishing hip OA-severity
were formed, as shown in Table 4, that were defined on
the basis of the mean and standard deviation GLNU
values, obtained for hips assigned by the experienced
orthopaedists to the same KL scale severity category.
Referring to Table 4, a hip was characterized as Severe if
its corresponding GLNU value was lower than 137.0,
Mild/Moderate if its GLNU value was within the
interval [137.0, 322.5], and as Normal/Doubtful for OA
if its GLNU value was greater than 322.5. For verification
Table 3. Comparison of results obtained by the KL scale and the proposed classification rules concerning HJS-narrowing index
Osteoarthritis severity
according to KL scale
HJS-narrowing index.77.9
(Severe)
11.6¡HJS-narrowing
index¡77.9
(Mild/Moderate)
Sum(s) Success percentage
Severe 7 2 9 77.8%
Mild/Moderate 0 9 9 100%
Sum(s) 7 11 18 88.9%
KL, Kellgren and Lawrence; HJS, hip joint space.
Figure 4. Hip joint space (HJS)-
narrowing index versus pathologi-
cal grey level non-uniformity
(GLNU) textural feature. Solid line
is the best line fitted to data points
(N). Horizontal solid lines define the
regions of osteoarthritis severity.
Prediction bounds are denoted by
dotted lines.
Table 4. Classification rules for assessment of osteoarthritis
severity concerning GLNU textural feature
Osteoarthritis
severity according
to KL grading scale
GLNU (Mean¡SD) Classification rule
Severe (88.0¡49.1) GLNU,137.0
Mild/Moderate (191.1¡56.4) 137.0¡GLNU¡322.5
Normal/Doubtful (415.2¡92.8) GLNU.322.5
KL, Kellgren and Lawrence; SD, standard deviation; GLNU,
grey level non-uniformity
(2)
I S Boniatis, L I Costaridou, D A Cavouras et al
236 The British Journal of Radiology, March 2006](https://image.slidesharecdn.com/026britishjournalofradiology-britishinstituteofradiology-2006-130913065550-phpapp02/75/British-Journal-of-Radiology-British-Institute-of-Radiology-2006-eng-240-2048.jpg)
![purposes, these classification rules were applied to the
unilateral OA-group and results were compared with the
KL scale classification (Table 5).
Referring to Table 5, the highest accuracy (94.4%) was
achieved for normal hips. For hips with Severe OA the
corresponding value was 77.8%, while for Mild/
Moderate hips the accuracy was 88.9%. Finally, an
overall classification accuracy of 88.9% (32/36) was
achieved. To our knowledge, textural-feature based
classification rules have not been proposed in previous
hip OA studies.
Finally, the strong correlation of GLNU textural feature
to the HJS-narrowing index was utilized to establish
means of quantification of hip OA from textural properties
of radiographic HJS (via GLNUpath feature) employing
Equations (1) and (2). This is important for monitoring the
progression of the disease and for assessing the effective-
ness of a treatment. Referring to the classification rules of
Table 4, percentages corresponding to OA-severity cate-
gories could be established using Equation (2). Thus, index
values for Severe OA were greater than 67.3%, for Mild/
Moderate OA within the interval [16.3%, 67.3%] and for
Normal/Doubtful OA less than 16.3%.
In this way, a hip may be assigned to an OA-severity
scale and its osteoarthritis, if it exists, can be evaluated
from its radiographic texture. This is of value because the
OA of patients suffering from bilateral-OA, which is often
the case, can be now quantified employing Equation (2),
whereas OA quantification in a manner similar to
Equation (1) applies only to patients with unilateral OA.
Conclusions
Alterations in the radiographic depiction of hip joint
space texture, due to osteoarthritis, were evaluated and
related to the severity of osteoarthritis, as defined by the
KL scale. Specifically, the GLNU textural feature, which
was selected considering its strong correlation to the
HJS-narrowing index, demonstrated high classification
accuracy in distinguishing hip OA-severity categories. In
addition, considering the high reproducibility derived
for the GLNU, the proposed method may have a
contribution in monitoring of OA-progression, as well
as in the evaluation of a chondroprotective therapy.
Acknowledgments
The authors thank the staff of the Departments of
Orthopaedics and Radiology for their contribution to this
work.
References
1. Stoker DJ. Radiology now. Osteoarthrosis of the hip: one
disease or many? Br J Radiol 1977;50:81–3.
2. Altman RD, Bloch DA, Dougados M, Hochberg M,
Lohmander S, Pavelka K, et al. Measurement of structural
progression in osteoarthritis of the hip: the Barcelona
consensus group. Osteoarthritis Cartilage 2004;12:515–24.
3. Peterfy CG. Imaging of the disease process. Curr Opin
Rheumatol 2002;14:590–6.
4. Ory PA. Radiography in the assessment of musculoskeletal
conditions. Best Pract Res Clin Rheumatol 2003;17:495–512.
5. Kellgren JH, Lawrence JS. Radiological assessment of
osteoarthritis. Ann Rheum Dis 1957;16:494–501.
6. Altman RD, Fries JF, Bloch DA, Carstens J, Cooke DT,
Genant H, et al. Radiographic assessment of progression in
osteoarthritis. Arthritis Rheum 1987;30:1214–25.
7. Croft P, Cooper C, Wickham C, Coggon D. Defining
osteoarthritis of the hip for epidemiologic studies. Am J
Epidemiol 1990;132:514–22.
8. Lane NE, Nevitt MC, Genant HK, Hochberg MC. Reliability
of new indices of radiographic osteoarthritis of the hand
and hip and lumbar disc degeneration. J Rheumatol
1993;20:1911–8.
9. Spector TD, Cooper C. Radiographic assessment of osteoar-
thritis in population studies: whither Kellgren and
Lawrence? Osteoarthritis Cartilage 1993;1:203–6.
10. Altman R, Brandt K, Hochberg M, Moskowitz R. Design
and conduct of clinical trials in patients with osteoarthritis:
recommendations from a task force of the Osteoarthritis
Research Society. Osteoarthritis Cartilage 1996;4:217–43.
11. Lequesne M. Chondrometry: quantitative evaluation of
joint space width and rate of joint space loss in osteoar-
thritis of the hip. Rev Rhum Engl Ed 1995;62:155–8.
12. Hilliquin P, Pessis E, Coste J, Mauget D, Azria A, Chevrot
A, et al. Quantitative assessment of joint space width with
an electronic caliper. Osteoarthritis Cartilage 2002;10:542–6.
13. Conrozier T, Tron AM, Balblanc JC, Mathieu P, Piperno M,
Fitoussi G, et al. Measurement of the hip joint space using
computerized image analysis. Rev Rhum Engl Ed
1993;60:105–11.
14. Conrozier T, Vignon E. Quantitative radiography in
osteoarthritis: computerized measurement of radiographic
knee and hip joint space. Best Pract Res Clin Rheumatol
1996;10:429–33.
15. Gordon CL, Wu C, Peterfy CG, Duryea J, Klifa C, Genant
HK. Automated measurement of radiographic hip joint
space width. Med Phys 2001;28:267–77.
16. Conrozier T, Favret H, Mathieu P, Piperno M, Provvedini
D, Taccoen A, et al. Influence of the quality of tibial plateau
alignment on the reproducibility of computer joint space
measurement from Lyon schuss radiographic views of the
knee in patients with knee osteoarthritis. Osteoarthritis
Cartilage 2004;12:765–70.
17. Bocchi L, Coppini G, De Dominicis R, Valli G. Tissue
characterization from X-ray images. Med Eng Phys
1997;19:336–42.
Table 5. Comparison of results obtained by the KL scale and the proposed classification rules concerning GLNU textural feature
Osteoarthritis severity
according to KL scale
GLNU ,137.0
(Severe)
137.0 ¡GLNU¡322.5
(Mild/Moderate)
GLNU.322.5
(Normal)
Sum(s) Success percentage
Severe 7 2 0 9 77.8%
Mild/Moderate 1 8 0 9 88.9%
Normal/Doubtful 0 1 17 18 94.4%
Sum(s) 8 11 17 36 88.9%
KL, Kellgren and Lawrence; GLNU, grey level non-uniformity.
Assessment of hip osteoarthritis using texture analysis
The British Journal of Radiology, March 2006 237](https://image.slidesharecdn.com/026britishjournalofradiology-britishinstituteofradiology-2006-130913065550-phpapp02/75/British-Journal-of-Radiology-British-Institute-of-Radiology-2006-eng-241-2048.jpg)
![18. Lynch JA, Hawkes DJ, Buckland-Wright JC. Analysis of
texture in macroradiographs of osteoarthritic knees using
the fractal signature. Phys Med Biol 1991;36:709–22.
19. Lynch JA, Hawkes DJ, Buckland-Wright JC. A robust and
accurate method for calculating the fractal signature of
texture in macroradiographs of osteoarthritic knees. Med
Inform 1991;16:241–51.
20. Fazzalari NL, Parkinson IH. Fractal properties of subchon-
dral cancellous bone in severe osteoarthritis of the hip. J
Bone Miner Res 1997;12:632–40.
21. Altman R, Alarco´n G, Appelrouth D, Bloch D, Borenstein D,
Brandt K, et al. The American college of rheumatology
criteria for the classification and reporting of osteoarthritis
of the hip. Arthritis Rheum 1991;34:505–14.
22. Lumiscan 75, system specifications. Lumisys Inc. 1998;
http://www.lumisys.com/support/manuals.html [Accessed
18 October 2005].
23. Efstathopoulos EP, Costaridou L, Kocsis O, Panayiotakis G.
A protocol-based evaluation of medical image digitizers. Br
J Radiol 2001;74:841–6.
24. Sakellaropoulos P, Costaridou L, Panayiotakis G. An image
visualisation tool in mammography. Med Inform Internet
Med 1999;24:53–73.
25. Sakellaropoulos P, Costaridou L, Panayiotakis G. Using
component technologies for web-based wavelet enhanced
mammographic image visualization. Med Inform Internet
Med 2000;25:171–81.
26. Sakellaropoulos P, Costaridou L, Panayiotakis G. A wavelet
based spatially adaptive method for mammographic con-
trast enhancement. Phys Med Biol 2003;43:787–803.
27. Pizer SM, Amburn EOP, Austin JD, Cromartie R,
Geselowitz A, Greer T. Adaptive histogram equalization
and its variations. CVGIP (Computer Vision, Graphics and
Image Processing) 1987;39:355–68.
28. Gonzalez RC, Woods RE, editors. Digital image processing.
New Jersey, USA: Prentice-Hall Inc., 2002.
29. Haralick RM, Shanmugam K, Dinstein I. Textural features
for image classification. IEEE Trans Syst Man Cybern
1973;SMC-3:610–21.
30. Galloway MM. Texture analysis using gray level run
lengths. Comput Graph Image Proc 1975;4:172–9.
31. Goker B, Sancak A, Arac M, Shott S, Block JA. The
radiographic joint space width in clinically normal hips:
effects of age, gender, and physical parameters.
Osteoarthritis Cartilage 2003;11:328–34.
32. Altman DG, editor. Practical statistics for medical research.
London, UK: Chapman Hall, 1991.
33. Lilliefors HW. On the Kolmogorov-Smirnov test for normal-
ity with mean and variance unknown. J Am Stat Assoc
1967;62:399–402.
34. Amadasun M, King R. Textural features corresponding to
textural properties. IEEE Trans Syst Man Cybern
1989;19:1264–74.
35. Armstrong CG, Mow VC. Variations in the intrinsic
mechanical properties of human articular cartilage with
age, degeneration and water content. J Bone Joint Surg Am
1982;64:88–94.
36. Jeffrey DR, Watt I. Imaging hyaline cartilage. Br J Radiol
2003;76:777–87.
37. Mankin HJ, Mow VC, Buckwalter JA, Ianotti JP, Ratcliffe A.
Form and function of articular cartilage. In: Simons S,
editor. Orthopaedic basic science. Chicago, USA: American
Academy of Orthopaedic Surgeons, 1994:1–44.
38. Radin EL, Rose RM. Role of subchondral bone in the
initiation and progression of cartilage damage. Clin Orthop
1986;213:34–40.
39. Burr DB, Schaffler MB. The involvement of subchondral
mineralized tissues in osteoarthrosis: quantitative micro-
scopic evidence. Microsc Res Tech 1997;37:343–57.
40. Jacobsen S, Sonne-Holm S, Soballe K, Gebuhr P, Lund B.
The distribution and inter-relationships of radiologic
features of osteoarthrosis of the hip. A survey of 4151
subjects of the Copenhagen City Heart Study: The
Osteoarthrosis Substudy. Osteoarthritis Cartilage
2004;12:704–10.
41. Bierma-Zeinstra SMA, Oster JD, Bernsen RMD, Verhaar
JAN, Ginal AZ, Bohnen AM. Joint space narrowing and
relationship with symptoms and signs in adults consulting
for hip pain in primary care. J Rheumatol 2002;29:1713–8.
42. Boegard T, Jonsson K. Hip and knee osteoarthritis.
Conventional X-ray best and cheapest method.
Lakartidningen 2002;44:4358–60.
43. Ingvarsson T, Ha¨gglund G, Lindberg H, Lohmander SL.
Assessment of primary hip osteoarthritis: comparison of
radiographic methods using colon radiographs. Ann
Rheum Dis 2000;59:650–3.
44. Forsberg K, Nilsson BE. Coxarthrosis on the island of
Gotland. Increased prevalence in a rural population. Acta
Orthop Scand 1992;63:1–3.
Appendix 1
Description of the grey level non-uniformity (GLNU)
textural feature defined by Galloway [30]
The grey-level run is a set of consecutive linearly
adjacent pixels having the same grey level value. As
length of the run is considered the number of pixels
consisting the run. Each element p(i, j) of a grey-level run
length matrix represents the number of times an image
contains a run of length j for grey level i, in a specific
direction.
The mathematical definition of the GLNU textural
feature is:
GLNU~
PNg
i~1
PNr
j~1
p i, jð Þ
!2
PNg
i~1
PNr
j~1
p i, jð Þ
where: p(i, j) is the (i, j)th element of grey level run length
matrix, Ng is the number of grey levels in the image and
Nr is the number of run lengths in the image.
Equally distributed runs throughout the grey levels,
correspond to low values for GLNU and vice versa.
I S Boniatis, L I Costaridou, D A Cavouras et al
238 The British Journal of Radiology, March 2006](https://image.slidesharecdn.com/026britishjournalofradiology-britishinstituteofradiology-2006-130913065550-phpapp02/75/British-Journal-of-Radiology-British-Institute-of-Radiology-2006-eng-242-2048.jpg)
![Trends in image quality in high magnification digital specimen
cabinet radiography
I P BIRCH, MSci, MPhys, C J KOTRE, PhD and R PADGETT, PhD
Regional Medical Physics Department, Newcastle General Hospital, Westgate Road, Newcastle NE4
6BE, UK
ABSTRACT. Advances in microfocus X-ray tube design together with the availability of
high resolution charge coupled device (CCD) detectors have led to the introduction of
high magnification digital specimen cabinets for the examination of tissue samples.
This paper explores the effect that the high magnification geometry permitted by such
units has upon image quality in terms of phase contrast edge enhancement, spatial
resolution and the appearance of test phantom images. Phase contrast effects and
spatial resolution were studied using a previously established method (using edge
profiles) and by computing the system spatial frequency response at various
geometries. It was demonstrated that the magnitude of the phase contrast
enhancement effect reaches a stable maximum at a magnification of 6 4. It has also
been shown that a continual increase in both the spatial resolution together with an
improved signal to noise ratio occurs up to the maximum permissible magnification
geometry, with effects of focal spot blur being negligible. In practice, the limited size
of the digital detector and the difficulty of object alignment can constrain the use of
the very high magnification option.
Received 23 March 2005
Revised 8 June 2005
Accepted 4 July 2005
DOI: 10.1259/bjr/24723806
’ 2006 The British Institute of
Radiology
Introduction
Radiography of excised tissue samples is usually
carried out in specialized specimen cabinets. These units
commonly feature a focal spot size of approximately
0.05 mm, a film–focus distance of 50 cm and contain
movable shelves so that the distance between the sample
and the image receptor can be varied to provide a
geometric magnification up to 6 1.8. Low tube currents
are used, and low tube voltages in the region of 20 kVp
maximize contrast. A recently introduced model, the
MX20 (Faxitron, Wheeling, USA) features a nominal
focal spot size of only 0.02 mm, a receptor–focus distance
of 58 cm, magnification geometry of up to 6 5 and a
digital receptor consisting of a 5 cm 6 5 cm charge
coupled device (CCD) array with 1024 6 1024 pixels.
The aim of this paper is to investigate the image quality
trends with varying geometrical magnification on this
unit in terms of spatial resolution and signal to noise
ratio (SNR). In particular, the contribution of phase-
contrast information is assessed.
Phase contrast
Phase-contrast enhancement occurs at interfaces
between materials of differing X-ray refractive index.
As a spatially coherent X-ray beam propagates through
an X-ray transparent medium, the phase of the incident
wavefront becomes modified in a manner related to the
electron density of the medium. The resulting phase
gradient across the wavefront is equivalent to a change
in direction of the propagation of the wave. The angular
deflections from the initial direction of propagation are
small, but are most pronounced in regions of the object
where the X-ray refractive index is varying rapidly, such
as the interface between two different materials. The
direction of the deflection will vary from point to point
within a general object, depending on the structures
present, but produces a net effect of edge enhancement
between structures of differing X-ray refractive index
when imaged using an appropriate geometry. Smoothly
curved structures such as spheres and cylinders show
the effect particularly strongly, as they act in a manner
analogous to an optical lens [1].
Although phase-contrast imaging is frequently asso-
ciated with the use of monochromatic synchrotron
radiation [2], a simplified scheme based on conventional
microfocus X-ray tubes, with high spatial (lateral)
coherence, has been demonstrated [3, 4]. The lateral
coherence is enhanced by the use of low energy photons,
a small focal spot size and/or a large source–object
distance; many of these conditions are met by the
geometry used in specimen cabinet radiography.
The visual appearance of phase contrast enhancement
in the final image is edge enhancement at interfaces
between materials with differing X-ray refractive indices.
As there is also a change of X-ray attenuation across
these interfaces, the effect of the phase contrast is to
provide a subtle enhancement of the conventional
attenuation image.
Parameters under investigation and
experimental techniques
The investigation of the image quality trends in
magnification radiography took place on a Faxitron
The British Journal of Radiology, 79 (2006), 239–243
The British Journal of Radiology, March 2006 239](https://image.slidesharecdn.com/026britishjournalofradiology-britishinstituteofradiology-2006-130913065550-phpapp02/75/British-Journal-of-Radiology-British-Institute-of-Radiology-2006-eng-243-2048.jpg)
![MX20 microfocus specimen cabinet utilizing a 5 cm 6
5 cm CCD detector with a 50 mm pixel pitch. The
recorded pixel values from the detector were initially
verified to be linear with dose using an aluminium step
wedge. The focal spot was measured by the slit method
as 0.02 mm 6 0.02 mm and all experiments were
performed at a nominal 20 kV and 0.3 mA. Some
comparative measurements also took place on a film–
screen Micro50 specimen cabinet (measured focal spot of
0.08 mm 6 0.11 mm) using Kodak MinR2000 film and
screens.
Phase contrast detection
Phase contrast enhancement was demonstrated from
the imaged profiles of a low attenuation edge test object
where the magnitude of the phase signal is comparable
with that of the attenuation signal. A simple phase
contrast test object was constructed from the edge of a
standard radiography film (approximate thickness
180 mm). Thin aluminium foil (50 mm) was used to create
a ‘‘non-phase contrast’’ edge of similar linear attenuation
properties. Thin aluminium edges have been shown not
to produce measurable phase enhancement effects due to
the small phase signal being swamped by the larger
attenuation signal [4].
Both edges were imaged at all available magnifications
( 6 1, 6 1.5, 6 2, 6 3, 6 4 and 6 5). In each case, the
test edges were rotated by approximately 30˚ to the
coordinate system of the CCD pixel array to allow
oversampling of the edge profiles.
The phase contrast enhancement effects were further
analysed using the pre-sampled modulation transform
function (MTF) calculated using data from the edge
profiles. By comparing the frequency response of the
phase contrast edge with that of the non-phase contrast
edge (which yields the conventional MTF), the effect of the
contrast enhancement was quantified in frequency space.
Spatial resolution/geometric blurring
An inherent limitation of all forms of magnification
radiography is the finite size of the X-ray focus, causing
geometric blurring of an imaged object edge. When using
the 50 mm focus, this blurring limits specimen cabinet
radiography to approximately magnification 6 2, after
which blurring becomes unacceptable.
For digital radiography systems the spatial resolution
is also limited by the Nyquist frequency of the detector
defined by (2p)21
where p is the pixel size. The
theoretical maximum spatial resolution in the image
plane for the MX20 system using a 50 mm pixel detector
therefore is 10 cycles mm21
. As this value is low
compared with that for film/screen, where over 20 line
pairs mm21
is more typical, the performance of the
digital detector, in terms of limiting spatial resolution for
specimen assessment, was also investigated.
The limiting spatial resolution for each magnification
geometry ( 6 1 to 6 5) was assessed by two methods; by
the 5% MTF cut-off frequency (cycles per mm), and with
a Huttner line-pairs test object (Type 25a) orientated at
45˚ to the pixel coordinate system (line pairs per mm).
Visual appearance
The perceived SNR was visually evaluated using the
Leeds TOR(MAM) phantom which is usually associated
with the performance testing of mammography equip-
ment. The phantom contains three groups of test objects:
fibres, simulated microcalcification clusters and low
contrast plastic discs [5].
Specimen cabinets are often used for evaluation of
mammography core samples that may contain small
calcification clusters associated with developing cancers.
For this reason the microcalcification clusters in the
TOR(MAM) phantom were used to assess the overall
image quality.
The simulated microcalcification clusters in the
phantom were imaged at all magnification geometries.
The digital images were then rescaled (with no
pixel interpolation) and windowed so that the
features in each image appeared at the same size and
grey level. The visual appearance of the microcalcifica-
tion clusters was assessed on a standard computer
monitor.
Results
Phase contrast enhancement
Figure 1 demonstrates the averaged edge profiles
(pixel values) for the film and aluminium edge test
objects. The distance across each edge (the x-axis) has
been rescaled to account for the oversampling angle of
the edge profiles. The profiles of the film edge in Figure
1a demonstrate ‘‘overshoots’’ that become more appar-
ent with increasing image magnification. This is the
characteristic appearance of phase contrast for this type
of object [3]. The gradient of each profile also appears to
increase slightly with magnification. This occurrence
suggests that the phase contrast enhancement serves to
counteract geometrical blurring effects.
Figure 1b shows that the aluminium edge profiles have
no phase contrast overshoots. In addition, all these
profiles are comparable for each of the magnification
geometries used. This suggests that effects from geome-
trical blurring are small, meaning that maximum
magnifications can be used for all object types, with
little detectable image degradation in image spatial
resolution.
The frequency response curves of Figure 2a show that
phase contrast effects preferentially enhance the mid
spatial frequency range for magnification geometries
whilst the overall calculated limiting spatial resolution
(taken as the 5% level) is left relatively unchanged at
9 cycles mm21
. For the non-phase contrast object it is
seen from Figure 2b that the shape of the frequency
response curve is consistent for all magnification
geometries from 6 1 to 6 4 with magnification 6 5
slightly lower, especially at the high frequency end. We
draw two conclusions from this observation. First, it
further demonstrates that the mid-frequency enhance-
ment shown in Figure 2a is a true phase contrast effect
and does not occur as a consequence of the magnification
geometry or changes in signal to noise ratio. Second,
geometrical unsharpness due to focal spot blurring is
I P Birch, C J Kotre and R Padgett
240 The British Journal of Radiology, March 2006](https://image.slidesharecdn.com/026britishjournalofradiology-britishinstituteofradiology-2006-130913065550-phpapp02/75/British-Journal-of-Radiology-British-Institute-of-Radiology-2006-eng-244-2048.jpg)
![minimal up to magnification 6 4 but there is some
degree of blurring at magnification 6 5.
In addition, Figure 2a shows that there is little
difference in mid-frequency response between the
geometries of 6 4 and 6 5 magnification. Therefore,
between these two geometries there is little to be gained
from additional phase contrast signal. This is likely to be
caused by the drop in lateral coherence of the poly-
chromic X-ray beam; a consequence of shortened focus to
object distance. At magnification 6 4 the geometry
appears optimized between the amount of phase contrast
created (focus to object distance) and the capability of the
detector to record the small angular phase contrast
deflections (object to detector distance).
Spatial resolution/geometrical blurring
To calculate the 5% MTF cut-off frequency in the object
plane (consistent with the Huttner test object) the spatial
frequency axis of the frequency response curves in
Figure 2b was rescaled to correct for the magnification
effect. These results together with those from the Huttner
test object are given in Table 1. This table shows that
despite the spatial resolution of the digital detector being
constrained to 10 lp mm21
, much higher object plane
resolution is possible through image magnification. Note
that the maximum spatial frequency measurable with the
Huttner test object is 20 lp mm21
and this was reached
by magnification 6 3 geometry.
Figure 3 shows rescaled images of the 14th Huttner
group (16.6 lp mm21
) for each of the 6 magnification
geometries. These images demonstrate a continual
improvement of image overall sharpness from magnifi-
cation 6 1 to magnification 6 5, consistent with the
estimated spatial resolution from the MTF assessment.
Visual appearance
Images of the 5th group (group ‘‘E’’, size 90–141 mm
[5]) of the simulated microcalcification clusters for the
Figure 1. (a) Pixel value profiles
across image edge acquired at
various magnification geometries
using a phase contrast test object.
(b) Pixel value profiles across image
edge acquired at various magnifica-
tion geometries using a non-phase
contrast test object.
Image quality trends in digital specimen cabinet radiography
The British Journal of Radiology, March 2006 241](https://image.slidesharecdn.com/026britishjournalofradiology-britishinstituteofradiology-2006-130913065550-phpapp02/75/British-Journal-of-Radiology-British-Institute-of-Radiology-2006-eng-245-2048.jpg)

![The standard deviation in pixel value in the uniform
background region was measured to be approximately
equal for each image. This result is expected as the
photon flux at the detector for a fixed exposure is
independent of the magnification geometry selected.
Increasing magnification with constant exposure factors
would, however, be expected to increase the amplitude
of large area signals in the plane of the object, and
therefore improve the SNR in the image, due to the
increased number of photons per unit area in the object
plane. At high magnification more photons will interact
with any given object feature, resulting in a larger
difference in total number of photons recorded due to
the presence of that feature. By simple geometry, the
photon flux will increase as the square of the magnifica-
tion factor. If quantum noise is considered to be the
dominant noise source, then the SNR for large area
objects would be expected to increase approximately in
proportion to the magnification factor. In addition, for
small objects comparable in size with the system point
spread function such as the microcalcifications in
Figure 4, increasing magnification will increase the size
of the object projected at the plane of the detector,
shifting the spatial frequencies down the system MTF
(Figure 2b) so that they are imaged at a larger signal
amplitude.
Discussion
The results above demonstrate that significant
improvements in the overall image quality of specimen
cabinet radiography can be achieved when using the
high magnification geometry available with the digital
Faxitron MX20 unit. We have shown that the 20 mm
focus permits up to 6 5 magnification with no
demonstrable loss in spatial resolution in the image
plane. This is compounded with the result of continual
increases in resolution in the object plane with increasing
magnification and a predicted maximum object resolu-
tion of 40 lp mm21
at magnification 6 5.
An improvement of SNR and spatial resolution has
also been shown to occur at high geometric magnifica-
tion, with the increased visibility of small, low contrast
objects in the TOR(MAM) phantom. However, improve-
ment occurs at the expense of a much reduced field size
(in the object plane).
An interesting result from this study is the fact the
Faxitron MX20 unit produces phase contrast image
enhancement at mid to high magnification geometries.
These enhancement effects produced an improvement in
the mid-frequency response. The overall effect of phase
contrast enhancement on clinical images will depend
entirely on the object being imaged, but the most
noticeable effects should be seen in the visibility of
filamentous and spherical objects and at interfaces
between materials of similar attenuation contrast [3].
Although we have demonstrated that a phase contrast
contribution is present, the improvement in image
quality is mainly governed by the increase in SNR and
object plane resolution produced at high magnification
geometries.
Conclusions
The results above suggest that, for a modern digital
specimen cabinet, with focal spot sizes in the order of
0.02 mm, image quality in terms of spatial resolution and
SNR in the object plane can be maximized by the use of
the highest magnification factor ( 6 5 in this case). Phase
contrast is also produced at high magnification geome-
tries with 6 4 magnification producing the optimum
results. However, it is appreciated that in practice, the
limited size of the digital detector and the difficulty of
object alignment may constrain the use of these very high
magnification options.
Acknowledgments
We would like to thank staff at the Breast Screening
Unit at Queen Elizabeth Hospital, Gateshead for their
help with this study.
References
1. Ingal V, Beliaevskaya E, Brianskaya A, Merkurieva R. Phase
mammography – a new technique for breast investigation.
Phys Med Biol 1998;43:2555–67.
2. Lewis R. Medical applications of synchrotron radiation x-
rays. Phys Med Biol 1997;42:1213–43.
3. Wilkins SW, Gureyev TE, Gao D, Pogany A, Stevenson AW.
Phase-contrast imaging using polychromatic hard x-rays.
Nature 1996;384:335–8.
4. Kotre CJ, Birch IP. Phase contrast enhancement of x-ray
mammography: a design study. Phys Med Biol
1999;44:2853–66.
5. Cowen AR, Brettle DS, Coleman NJ, Parkin GJS. A
preliminary investigation of the imaging performance of
photostimuable phosphor computed radiography using a
new mammographic quality control test object. Br J Radiol
1992;62:528–35.
Figure 4. Microcalcification cluster number 5 of Leeds
TOR(MAM) mammography test object. Images acquired at
various magnifications and rescaled. (a) mag 6 1, (b) mag 6
1.5, (c) mag 6 2, (3) mag 6 3, (e) mag 6 4, (f) mag 6 5.
Image quality trends in digital specimen cabinet radiography
The British Journal of Radiology, March 2006 243](https://image.slidesharecdn.com/026britishjournalofradiology-britishinstituteofradiology-2006-130913065550-phpapp02/75/British-Journal-of-Radiology-British-Institute-of-Radiology-2006-eng-247-2048.jpg)
![Margins between clinical target volume and planning target
volume for electron beam therapy
S J THOMAS, MA, MSc, PhD
Medical Physics, Addenbrooke’s Hospital, Cambridge CB2 2QQ, UK
ABSTRACT. When growing a clinical target volume (CTV) to a planning target volume
(PTV), it is necessary to determine suitable margins, based on the systematic and
random uncertainties. For electron therapy, where treatments are usually given with
single fields, the factors affecting the margin are very different in the direction of the
incident beam from those in the perpendicular directions, since set-up errors do not
affect the depth of the 90% isodose. For a typical case, the perpendicular margins are
three times the margin in the direction of the incident beam. This gives rise to problems
with volume growing algorithms if the beam axis is not aligned with a cardinal axis.
Received 21 April 2005
Revised 23 June 2005
Accepted 4 July 2005
DOI: 10.1259/bjr/70202978
’ 2006 The British Institute of
Radiology
The International Commission of Radiation Units and
Measurements (ICRU), in reports 50 and 62 [1, 2], defines
the gross tumour volume (GTV), the clinical target
volume (CTV) and the planning target volume (PTV).
Both reports discuss factors contributing to the CTV-PTV
margin, but do not give any recipes for its calculation.
The British Institute of Radiology (BIR) has recently
published a report on Geometric Uncertainties in
Radiotherapy [3], which reviews sources of uncertainty
and describes methods of calculating CTV-PTV margins.
All the specific advice relates to photon beams rather
than electron beams.
ICRU report 71 [4] extends the work of ICRU 62 to
electron beam therapy. This report gives a recipe for
calculating the CTV-PTV margin, based on work by
Stroom et al [5]. A CTV-PTV margin which ensures at
least 95% of the dose to 99% of the CTV is given by:
CTV-PTV margin~2Sz0:7s
where S is the standard deviation for the systematic
(preparation) error, and s is the standard deviation for
the random (execution) error. However, this margin
recipe is based on photon beam therapy, making a
number of assumptions that do not hold for electron
beams.
The aim of the work described below is to develop a
method of calculating margins that is valid for the
conditions applying in electron beam therapy.
Theory
The methods described by the BIR report on Geometric
Uncertainties in Radiotherapy [3], for photon therapy with
multiple beams give the following margin, to ensure a
minimum dose to the CTV of 95% for 90% of patients:
CTV-PTV margin~2:5Szazbzb((s2
zs 2
p )0:5
{sp)
where S and s are as in Equation (1), a and b are corrections
for planning algorithm error and breathing, respectively, sp
is the unblurred beam penumbra width, and b is a value
that depends on the beam configuration, being always 1.64
in the superior–inferior (sup-inf) direction for coplanar
beams, and taking lower values in transverse planes
depending on the number and arrangement of beams.
When b51.64 and sp53.2 mm, the last term of Equation (2)
approximates to 0.7s, as in Equation (1).
Thederivation is basedon the assumption of a CTV that is
approximately spherical, with an arrangement of beams
designed to conform the dose distribution to it in three
dimensions. However, the more usual situation in electron
therapy is as shown in Figure 1. A single beam, shaped by a
metal cut-out, is chosen with an energy appropriate to the
depth required to ensure that the 90% isodose covers the
PTV. It is apparent that the effect of geometrical uncertain-
tiesinthexandydirectionsinFigure 1isverydifferentfrom
the effect of geometrical uncertainties in the z direction.
Systematic errors
The BIR report [3] describes four gaussian sources of
systematic error, the standard deviations of which may
be combined in quadrature; the doctor’s delineation
error Sdoctor, the organ position and shape (excluding
breathing) error Smotion, the set up error Ssetup and the
phantom transfer error Stransfer.
Sdoctor is the systematic error resulting from inter-
clinician and intraclinician variation in volume delinea-
tion. The issue of whether Sdoctor can be combined in
quadrature with other errors is still a matter of debate;
recent work by McKenzie [6] suggests that it cannot be
handled in the same manner as the other gaussian errors,
but requires an alternative theoretical basis. In the
example below I have omitted it, and assumed that it
has been included in the CTV.
Smotion is the systematic error in position and shape
(excluding breathing). It will not be affected by modality,
so can be treated in the same way as for photons. Ssetup (the
standard deviation of the systematic set-up error) can be
treated in the same way as for photons in the x and y
direction. However, in the z direction, most errors have no
(1)
(2)
The British Journal of Radiology, 79 (2006), 244–247
244 The British Journal of Radiology, March 2006](https://image.slidesharecdn.com/026britishjournalofradiology-britishinstituteofradiology-2006-130913065550-phpapp02/75/British-Journal-of-Radiology-British-Institute-of-Radiology-2006-eng-248-2048.jpg)
![effect on the position of the isodoses. A systematic shift of a
few millimetres in the z position of the patient relative to
the end of the applicator may have a small effect on
delivered dose (generally less than 1%), but will not affect
the depth of the isodoses.
The phantom transfer error Stransfer, is the error
accumulated in transferring image data through the
treatment planning system to the linear accelerator,
including errors in imaging, planning, and linear
accelerator geometry. Since the component from accel-
erator geometry will have no effect on the depth of
isodoses, Stransfer will be less in z than in x and y.
An additional systematic uncertainty, which affects
only the z direction, is uncertainty in electron density
derived from CT. For low atomic number materials,
published data for eight CT scanners showed a max-
imum error in electron density of 2.5%, with a standard
deviation below 1% [7]. Most electron treatments are
given through soft tissue. The Sdensity, in the depth of the
90% depth dose, varies with energy from 0.2 mm at
6 MeV to 0.6 mm at 21 MeV. For bone, if a standard
curve is used for all scanners, errors of up to 6% can be
observed, with a standard deviation below 2.5%. If
10 mm of the depth is bone of density 1.5, Sdensity
becomes 0.4 mm at 6 MeV, 0.8 mm at 21 MeV.
In all the clinical examples in the BIR report [3], the
dominant systematic gaussian errors are Ssetup and
Stransfer. Since these are insensitive to systematic errors
in the z direction, the problem will change from a 3D case
to a 2D case. As shown by Van Herk et al [8], this reduces
the systematic margin from 2.5S to 2.15S.
Linear errors
Geometric Uncertainties in Radiotherapy [3] defines two
linear errors, the ‘‘breathing positional error’’ b and the
‘‘treatment planning system photon-beam algorithm
error’’ a.
The breathing error b can be treated in the same
manner as for photons, since the derivation of the margin
is not dependent on modality.
Electron treatment planning algorithms do not usually
give as good agreement with measurement as do photon
algorithms. The errors are very dependent on the shape
of the patient surface, and the size and shape of
inhomogeneities. For photon planning, simple measure-
ments can determine whether the planning system over-
corrects or under-corrects the field sizes, and corrections
can be made. For electrons, this error is very plan
dependent, and is probably best not included in the PTV
margin. Hence a has been taken as zero.
Treatment execution errors
There are two random gaussian errors considered by
the BIR report [3], the daily set-up error sset-up and the
organ position and shape execution error, smotion. Both of
these combine in quadrature to give the s of Equation (2).
sset-up can be treated in the same way as for photons in
the x and y direction. However, in the z direction, most
errors have no effect on the position of the isodoses, for
the same reasons as given for systematic set-up errors.
smotion will be unaffected by modality, so can be
treated in the same way as for photons.
Unblurred penumbra width
The unblurred beam penumbra width sp requires a
very different treatment for electrons than for photons. In
the x and y directions, although the penumbra of an
electron field can still be defined by a gaussian, the width
Figure 1. A typical electron treatment. The planning target volume (PTV) is shown in dark grey, the collimator (cut-out) is
shown in light grey. The 90% isodose conforms to the PTV in the xy plane, at the depth of maximum PTV width.
Margins between CTV and PTV for electron beam therapy
The British Journal of Radiology, March 2006 245](https://image.slidesharecdn.com/026britishjournalofradiology-britishinstituteofradiology-2006-130913065550-phpapp02/75/British-Journal-of-Radiology-British-Institute-of-Radiology-2006-eng-249-2048.jpg)
![of the gaussian varies very rapidly with depth and
energy. A penumbra can be described by an error
function with a parameter sp; an approximation for sp
(in mm) can be derived from the data of Lax et al [9]:
sp~ 21:3
Z
R
{3:9
ffiffiffiffiffi
E
10
r
where Z is depth in mm, E is the electron energy at the
surface in MeV, and R is the range in mm, which can
itself be approximated by:
R~5:21E{3:76
The depth to be used depends on the exact shape of the
systematic target volume (STV), which is the volume
resulting after a margin is added to the CTV to account
for systematic errors [3]. The STV-PTV margin accounts
for the random (execution) errors. Table 1 calculates the
sp for two different depths. In the first case, the STV is
assumed to be ellipsoidal, and symmetrically situated
between 10 mm deep and the depth of the 90% isodose
(D90). In this case the widest point of the target volume
will be depth D15(10 mm + D90)/2. In the second case,
the calculation has been done at D90; this has been chosen
to deal with the extreme cases where the target volumes
are widest at their deepest position. All penumbral
widths are within 1 mm of 5 mm at D1, and within
2 mm of 6 mm at D90.
The depth dose fall-off can also be approximated with
a gaussian. Values of spdd can be chosen such that the
shape of the measured percentage depth dose curve
(centred on the depth of the 50%) is matched by values of
100
ffiffiffiffiffiffi
2p
p
spdd
ðd50{d
{?
exp {x2
=2spdd
2
À Á
dx
Figure 2 gives an example of this fit; the shape of the
depth dose is well modelled from the depth of dose
maximum to the depth of 5% dose. Table 1 shows values of
spdd derived by this method, which vary from 7 mm at
6 MeV to 23 mm at 21 MeV. spdd is used in place of sp in
Equation (2).
Fitting to a 90% dose level with a single beam gives a b
of 1.28, as derived in Van Herk et al [8]. If a simplified
version of Equation (2) is required, to enable comparison
with Equation (1), the final term of Equation (2) can be
approximated to 0.3s, for values of s up to 5 mm, using
the linear approximation of Van Herk et al [8], for x and
y, if sp 55 mm,. For z, it approximates to 0.2s at 6 MeV,
reducing to 0.1s at 18 MeV.
Example
Let us assume we are treating a target volume in the
head or neck. We will assume an anterior beam, so that the
z direction of Figure 1 corresponds to the posteroanterior
(PA) direction. We will use values for the systematic and
random errors based on those used in Chapter 7 of
Geometric Uncertainties in Radiotherapy [3]. For the example
chosen, where the patient is immobilized, breathing errors
are taken to be negligible, so b is omitted.
Table 2 shows the resulting margins. For the values
shown, the anteroposterior (AP) margin is about 3 mm,
the superior-inferior (Sup-Inf) and lateral margins about
10 mm. This means that geometrical uncertainties will
have a larger effect on the size of cut-out required than
they do on the electron energy.
Discussion
For electron treatments, a much smaller CTV-PTV
margin is required in the direction of the incident beam
Table 1. Data used to characterize the beam profiles and
depth doses. D1, halfway between 10 mm and the depth of
the 90% isodose (D90), is the depth at the widest part of the
target volume in Figure 1. sp and spdd describe the shape of
the penumbra and depth-dose fall-off, respectively
Energy
(MeV)
Practical
range (mm)
D1
(mm)
D90
(mm)
sp at D1
(mm)
sp at D90
(mm)
spdd
(mm)
6 28 13 16 5 5 7
9 43 19 27 5 6 8
12 59 23 36 5 7 10
15 74 28 45 5 8 12
18 90 31 52 5 8 16
21 106 33 56 4 8 23
Figure 2. This illustrates the use of a
gaussian to model the shape of the
depth dose curve. The line is
measured beam data for a 15 MeV
beam, the points are calculated
from Equation (5), using a spdd of
12 mm. A close fit is observed from
the depth of maximum dose down
to the depth of 5%.
(3)
(4)
(5)
S J Thomas
246 The British Journal of Radiology, March 2006](https://image.slidesharecdn.com/026britishjournalofradiology-britishinstituteofradiology-2006-130913065550-phpapp02/75/British-Journal-of-Radiology-British-Institute-of-Radiology-2006-eng-250-2048.jpg)
![than perpendicular to it. With most volume growing
software, this is only straightforward in cases where the
beam direction is along one of the cardinal axes, e.g. an
anterior, a posterior or a true lateral beam. In cases where
the beam is being applied obliquely, the geometry is an
expansion ellipsoid whose principal axes are not aligned
with the cardinal axes. This cannot be dealt with by most
planning systems. One method of dealing with this
would be to avoid making a CTV-PTV expansion, but
instead to use the values directly in the field shaping and
choice of energy.
Conclusions
The methodology of the BIR report on geometrical
uncertainties [3] can be followed for electrons in the
direction perpendicular to the incident beam, but using a
2.15 multiplier for the systematic errors. In the direction
of the incident beam, the effect of set up errors has no
effect on the margin, so margins are smaller.
In the direction perpendicular to the incident electron
beam, the margin required is approximately
2.15Sz+b+0.3s, where S and s are the standard devia-
tions for systematic (preparation) errors and random
(execution) errors, respectively, and b is the linear
breathing margin. In the direction of the incident beam,
this reduces to 2.15Sz +b+0.15sz, where Sz and sz
exclude any set-up errors.
References
1. International Commission on Radiation Units and
Measurements. ICRU Report 50. Prescribing, recording and
reporting photon beam therapy. Bethesda MD: ICRU, 1993.
2. International Commission on Radiation Units and
Measurements. ICRU Report 62 (Supplement to ICRU report
50). Prescribing, recording and reporting photon beam
therapy. Bethesda MD: ICRU, 1999.
3. British Institute of Radiology Working Party. Geometric
uncertainties in radiotherapy. London, UK: British Institute
of Radiology, 2003.
4. International Commission on Radiation Units and
Measurements. ICRU Report 71. Prescribing, recording and
reporting electron beam therapy. Oxford University Press,
2004.
5. Stroom JC, deBoer HC, Huizenga H, Visser AG. Inclusion of
geometrical uncertainties in radiotherapy planning by means
of coverage probability. Int J Radiat Oncol Biol Phys
1999;43:905–19.
6. McKenzie AL. A novel way to allow for uncertainties in
delineation and changes in shape of target volumes in
radiotherapy. In: Chambers LA, Chambers IR, editors.
Proceedings of the 11th Annual Scientific Meeting; 2004
September 6–8; York, UK. York, UK: Institute of Physics in
Engineering and Medicine, 2004.
7. Thomas SJ. Relative electron density calibration of CT
scanners for radiotherapy treatment planning. Br J Radiol
1999;72:781–6.
8. Van Herk M, Remeijer P, Rasch C, Lebesque JV. The
probability of correct target dosage: dose-population histo-
grams for deriving treatment margins in radiotherapy. Int J
Radiat Oncol Biol Phys 2000;47:1121–35.
9. Lax I, Brahme A, Andreo P. Electron beam dose planning
using Gaussian beams. Improved radial dose profiles. Acta
Radiol Suppl 1983;364:49–59.
Table 2. Example of typical clinical target volume-planning
target volume (CTV-PTV) margins for electron therapy. The
beam is assumed to be an anterior beam. All distances are in
millimetres. Values of sp and spdd for 12 MeV have been
used; changing the energy between 5 MeV and 21 MeV will
change the margin by a maximum of 0.1 mm in anterior-
posterior (AP), and a maximum of 0.2 mm right-left (R-L) and
superior-inferior (S-I)
Systematic errors AP R-L S-I
Smotion 1.0 1.0 1.0
Stransfer 1.0 2.9 3.8
Sset-up 0.0 2.5 2.5
Sdensity 0.2 0 0
S(combined) 1.4 4.0 4.7
Systematic52.15 S 3.0 8.5 10.0
Treatment execution errors
sset-up 0.0 2.5 2.5
smotion (target shape) 1.0 1.0 1.0
s 1.0 2.7 2.7
sp (or spdd for AP ) 10.0 5.0 5.0
Planning parameter (b) 1.28 1.28 1.28
Execution~b s2
zsp
2
À Á0:5
{sp
0.1 0.9 0.9
Total CTV-PTV margin 3.1 9.4 10.9
Margins between CTV and PTV for electron beam therapy
The British Journal of Radiology, March 2006 247](https://image.slidesharecdn.com/026britishjournalofradiology-britishinstituteofradiology-2006-130913065550-phpapp02/75/British-Journal-of-Radiology-British-Institute-of-Radiology-2006-eng-251-2048.jpg)
![SHORT COMMUNICATION
Gold nanoparticles: a new X-ray contrast agent
1
J F HAINFELD, PhD, 1
D N SLATKIN, MD, 1
T M FOCELLA, BS and 2
H M SMILOWITZ, PhD
1
Nanoprobes, Inc., 95 Horse Block Road, Yaphank, NY 11980 and 2
University of Connecticut Health
Center, Farmington, CT 06030, USA
ABSTRACT. There have been few fundamental improvements in clinical X-ray contrast
agents in more than 25 years, and the chemical platform of tri-iodobenzene has not
changed. Current agents impose serious limitations on medical imaging: short imaging
times, the need for catheterization in many cases, occasional renal toxicity, and poor
contrast in large patients. This report is the first demonstration that gold nanoparticles
may overcome these limitations. Gold has higher absorption than iodine with less bone
and tissue interference achieving better contrast with lower X-ray dose. Nanoparticles
clear the blood more slowly than iodine agents, permitting longer imaging times. Gold
nanoparticles, 1.9 nm in diameter, were injected intravenously into mice and images
recorded over time with a standard mammography unit. Gold biodistribution was
measured by atomic absorption. Retention in liver and spleen was low with elimination
by the kidneys. Organs such as kidneys and tumours were seen with unusual clarity and
high spatial resolution. Blood vessels less than 100 mm in diameter were delineated,
thus enabling in vivo vascular casting. Regions of increased vascularization and
angiogenesis could be distinguished. With 10 mg Au ml21
initially in the blood, mouse
behaviour was unremarkable and neither blood plasma analytes nor organ histology
revealed any evidence of toxicity 11 days and 30 days after injection. Gold nanoparticles
can be used as X-ray contrast agents with properties that overcome some significant
limitations of iodine-based agents.
Received 4 February 2005
Revised 24 May 2005
Accepted 1 September
2005
DOI: 10.1259/bjr/13169882
’ 2006 The British Institute of
Radiology
Contrast agents for X-rays are based on tri-iodoben-
zene with substituents added for water solubility.
Diatrizoate, an ionic form, was introduced in 1954, but
the high osmolality of this compound (1.57 osm kg21
for
a 300 mg I ml21
solution) was found to be the source of
chemotoxicity [1]. In the 1970s, a non-ionic form, iohexol,
lowered osmolality (0.67 osm kg21
), and is still widely
used today under the names OmnipaqueH and
ExypaqueH, Amersham Health, Amersham, UK (now
GE Healthcare). Because osmolality was still excessive, a
dimeric form was introduced, iodixanol (AcupaqueH and
VisipaqueH, Amersham Health, Amersham, UK (now GE
Healthcare); 0.29 osm kg21
). Intravascular agents based
on other mid-Z to high-Z elements have not been
successful due to toxicity, performance, or cost. The
low molecular weights of the iodine agents (diatrizoate,
613; iohexol, 821; iodixanol, 1550) effect rapid renal
clearance and vascular permeation, necessitating short
imaging times. Intra-arterial catheterization is therefore
commonly needed, but carries the risks of arterial
puncture, dislodgement of plaque, stroke, myocardial
infarction, anaphylactic shock and renal failure. A
further shortcoming of the current agents is in molecular
imaging, since their conjugates with antibodies or other
targeting moieties fail to deliver iodine to desired sites at
detectable concentrations.
Several other experimental X-ray contrast materials
show promise as blood pool agents, including standard
iodine agents encapsulated in liposomes [2, 3], a
dysprosium-DTPA-dextran polymer [4], polymeric
iodine-containing PEG-based micelles [5], perfluoroctyl
bromide [6], dervatized polylysine linked to iodine [7],
and iodine linked to a polycarboxylate core (P743,
MW512.9 kDa) [8]. Iron nanoparticles have been used
successfully as MRI contrast agents [9], but our report is
the first, to our knowledge, to use gold as an X-ray
contrast agent in vivo.
Withahigheratomicnumber(Au,79vsI,53),andahigher
absorption coefficient (at 100 keV: gold: 5.16 cm2
g21
;
iodine: 1.94 cm2
g21
; soft tissue: 0.169 cm2
g21
; and bone:
0.186 cm2
g21
), gold provides about 2.7 times greater
contrast per unit weight than iodine [10]. Imaging gold at
80–100 keV reduces interference from bone absorption
and takes advantage of lower soft tissue absorption which
would reduce patient radiation dose. Gadolinium has been
used instead of iodine to image the chest with half the X-
ray dose [11]. The higher molecular weight of nanoparti-
cles (here ,50 kDa) permits much longer blood retention,
so that useful imaging may be obtained after intravenous
injection, possibly obviating invasive catheterization for
diagnostic triage. Molecular imaging may also be possible
as each nanoparticle bound to a targeting agent would
deliver a ‘‘truckload’’ of ,250 gold atoms to a cognate
This study was supported in part by a National Cancer Institute
Small Business Innovative Research Phase 1 Grant 1R43CA83576-
01. JFH is part owner of Nanoprobes, Inc. Other authors do not have
any financial interest.
The British Journal of Radiology, 79 (2006), 248–253
248 The British Journal of Radiology, March 2006](https://image.slidesharecdn.com/026britishjournalofradiology-britishinstituteofradiology-2006-130913065550-phpapp02/75/British-Journal-of-Radiology-British-Institute-of-Radiology-2006-eng-252-2048.jpg)
![receptor thereby increasing the signal. Although gold is
more costly than iodine, low detectable amounts and
significant benefits should enable feasible gold-mediated
clinical radiography.
Materials and methods
Animals and injections
Balb/C mice were injected subcutaneously in the thigh
with 106
EMT-6 syngeneic mammary carcinoma cells [12]
suspended in 0.05 ml of equal volumes of medium and
Matrigel. 10 days after tumour initiation, gold nanopar-
ticles were injected via a tail vein. Experimental protocols
using animals were approved by the University of
Connecticut Health Center animal care committee.
Gold nanoparticles
1.9¡0.1 nm gold nanoparticles were obtained from
Nanoprobes, Inc. (preparation # 1101, Yaphank, New
York, USA). The size of the nanoparticles was deter-
mined by electron microscopy. The concentration of
injected gold was 270 mg Au cm23
, and volume injected
was 0.01 ml g21
mouse weight. Nanoparticles were
suspended in phosphate-buffered saline at pH 7.4.
Gold analysis
Tissues were excised, placed in tared vials, and
analysed for gold by graphite furnace atomic absorption
spectrometry using a Perkin Elmer 4100Z instrument
(Wellesley, Massachusetts, USA).
Radiographs
A Lorad Medical Systems mammography unit
(Hologic, Inc., Danbury, CT; model XDA101827) was
used with 8 mAs exposures (0.4 s at 22 kVp). Kodak
Min-R2000 mammography film, 18 cm 6 24 cm
(Eastman Kodak, Rochester, NY) was used.
Toxicity tests
60 outbred CD1 mice (male and female) were rando-
mized into four groups of 15 animals per group receiving
700 mg Au kg21
, 70 mg Au kg21
, or 7 mg Au kg21
, or
sham-injected with phosphate buffered saline. Animals
were weighed and observed regularly for clinical signs.
Animals were euthanized by CO2 narcosis 1 day, 11 days,
and 30 days after intravenous gold injections and ,0.4 ml
blood was removed from the right ventricle immediately
after the cessation of breathing. Haematology analytes
included haematocrit, haemoglobin, total white [WBC]
and red [RBC] blood cell counts, neutrophil, lymphocyte,
monocyte, and eosinophil counts, mean corpuscular
volume, mean corpuscular haemoglobin, mean corpus-
cular haemoglobin concentration, WBC differential (per-
cent neutrophils, bands, lymphocytes, monocytes, and
eosinophils), and blood smear microscopy. Blood chem-
istry analytes included glucose, blood urea nitrogen (BUN),
creatine, calcium, phosphate, total protein, albumin, globin,
albumin:globulin ratio, alanine aminotransferase (ALT),
aspartate aminotransferase (AST), AST/ALT ratio, alkaline
phosphatase, total bilirubin, and direct bilirubin. Livers
and kidneys were weighed and slices of the following 24
tissues were prepared for microscopic study by formalin
fixation, paraffin embedding, and haematoxylin/eosin
staining: kidneys, liver, testes, epididymis, lungs, heart,
adrenals, bone, bone marrow, spinal cord, sciatic nerves,
oesophagus, stomach, duodenum, ileum, jejunum, colon,
cecum, lymph nodes, spleen, thymus, trachea, ovaries, and
uterus. Histopathology was evaluated by a board-certified
veterinarian (A G Richter, DVM, DACVP) and assessed
independently by a physician certified in anatomic
pathology (D N Slatkin, MD, DABP).
Results
Gold nanoparticles, 1.9 nm in diameter, were sus-
pended in phosphate-buffered saline and injected via a
tail vein into Balb/C mice bearing EMT-6 subcutaneous
mammary tumours. The vascular system was imaged in
planar projection using a clinical mammography unit.
Blood vessels as fine as 100 mm in diameter could be
distinguished (Figure 1). A 5 mm tumour growing in
one thigh was clearly evident from its increased
vascularity and resultant higher gold content
(Figure 1). These nanoparticles thus enable direct ima-
ging, detection, and measurement of angiogenic and
hypervascularized regions. Images taken at various
times after intravenous injection show that the small
nanoparticles do not concentrate in the liver and spleen,
but clear through the kidneys (Figure 2). A closer
examination of the kidneys revealed a remarkably
detailed anatomical and functional display (Figure 3).
Toxicity and clearance are critical issues for clinical
imaging. Mice intravenously injected with the gold
nanoparticles at 2.7 g Au kg21
survived over 1 year
without signs of illness. The LD50 for this material is
approximately 3.2 g Au kg21
. In a 30-day toxicity study
using 60 mice, intravenous injection of the gold
nanoparticles (initially, 10 mg Au ml21
blood) showed
normal haematology (Table 1) and blood chemistry
(Table 2). Histological examination of 24 vital organs
and tissues from each mouse, assayed 11 days or 30 days
after injection of the nanoparticles, showed no evidence
of toxicity in any animals.
Quantitative pharmacokinetics using graphite furnace
atomic absorption spectroscopy (Figure 4) showed that
blood gold concentration decreased in a biphasic
manner, with a 50% drop between 2 min and 10 min
followed by a slower decrement of another 50% between
15 min and 1.4 h. The highest tissue gold concentration
15 min after injection was in the kidney (10.60¡0.2
percent of the injected dose per gram of measured tissue
[%id/g]), followed by tumour (4.2¡0.4%id/g), liver
(3.6¡0.3%id/g) and muscle (1.2¡0.1%id/g). Whole
body gold clearance was 77.5¡0.4% of the total injected
gold after 5 h. Muscles and blood were almost gold-free
24 h after injection (0.28¡0.07%id/g and 0.10¡0.01%id/g,
respectively), whereas tumour at 24 h retained 64% of
Short communication: Gold nanoparticles
The British Journal of Radiology, March 2006 249](https://image.slidesharecdn.com/026britishjournalofradiology-britishinstituteofradiology-2006-130913065550-phpapp02/75/British-Journal-of-Radiology-British-Institute-of-Radiology-2006-eng-253-2048.jpg)
![its value reached at 15 min. The tumour:muscle gold
ratio was 3.4 at 15 min post injection, improving to 9.6
at 24 h, enabling clear delineation of the tumour. In
addition to imaging, higher tumour X-ray absorption
due to the gold has been shown to greatly improve the
efficacy of radiotherapy [13].
Even when concentrated, gold nanoparticle solutions
were similar to water in viscosity, in sharp contrast to the
high viscosity of iodine contrast media. The gold
nanoparticles may be completely dried and later re-
suspend easily in water or aqueous buffers, such as
phosphate buffered saline, pH 7.4. Solubility was found
to be at least 1.5 g Au ml21
. The gold nanoparticles are
stable, showing no change in spectra or aggregation after
6 months storage at 4˚C or 220˚C.
Discussion
Gold’s K-edge at 80.7 keV compared with iodine’s at
33.2 keV confers higher absorptivity and ,3-fold better
contrast at ,100 keV, a useful range for clinical CTs and
fluoroscopes. Absorption is also higher at low energies
(,30 keV), where mammography machines operate,
again providing gold with an approximately 3-fold
absorption advantage over iodine.
Some iodine agents’ side effects are due to high
osmolality. Iodine agents contain 3 (monomer) or 6
(dimer) iodine atoms per molecule. In contrast, the
nanoparticles used here each contain about 250 gold
atoms per molecule and at the same elemental concen-
tration as iodine agents (350 mg Au ml21
), therefore
have a negligible osmolality of 0.0072 M. Saline could, of
course, be added to provide iso-osmolality. The low
viscosity of gold nanoparticle solutions would also
facilitate injections.
Deliberately high amounts of gold were used to clarify
printed images. CT is much more sensitive than planar
imaging, and studies of high-Z agents indicate that good
contrast-to-noise images can be obtained at gold con-
centrations of 100 mg ml21
[14]. This level is ,100 times
lower than a dose of gold nanoparticles at which we
found no evidence of toxicity. Use of these lower
amounts of gold clinically would not only improve the
safety margin, but also lower the cost.
The extended imaging time and high contrast pro-
vided by gold nanoparticles after a non-toxic intravenous
injection might enable such applications as: non-invasive
imaging of coronary and cerebral arteries, assessment of
atherosclerotic plaque and stenoses, delineation of
stroke, arteriovenous malformations, aneurysms,
renal angiography, determination of vascularity, and
enhancement of mammography and virtual colono-
scopy. Improved contrast might enable non-invasive
detection of small tumours (e.g. , 1 cm) that are
currently missed, yielding better prognoses. Tumour
vascularity is correlated with invasiveness [15], so
indices of vascularity make non-invasive staging
possible. These gold nanoparticles might be useful to
distinguish vulnerable plaque since it is more highly
vascularized than stable plaque [16, 17]. With the
advent of faster CT machines that lessen motion
artefacts, gold-enhanced imaging of coronary arteries,
especially those in obese patients or those with mural
calcifications, might prove feasible via transvenous
injection without resorting to arterial catheterization.
Contrasting during transarterial catheterization might
also benefit from the use of gold nanoparticles, especially
for large patients where additional contrast is needed
at present, since the concentration of gold can be
made ,5 times higher than that of iodine agents.
With the absorbance of gold 3 times higher at 100 keV,
and the concentration 5 times higher (1.5 g Au cm23
vs
0.3 g I cm23
), the overall contrast gain could be greater
than 10-fol](https://image.slidesharecdn.com/026britishjournalofradiology-britishinstituteofradiology-2006-130913065550-phpapp02/75/British-Journal-of-Radiology-British-Institute-of-Radiology-2006-eng-254-2048.jpg)


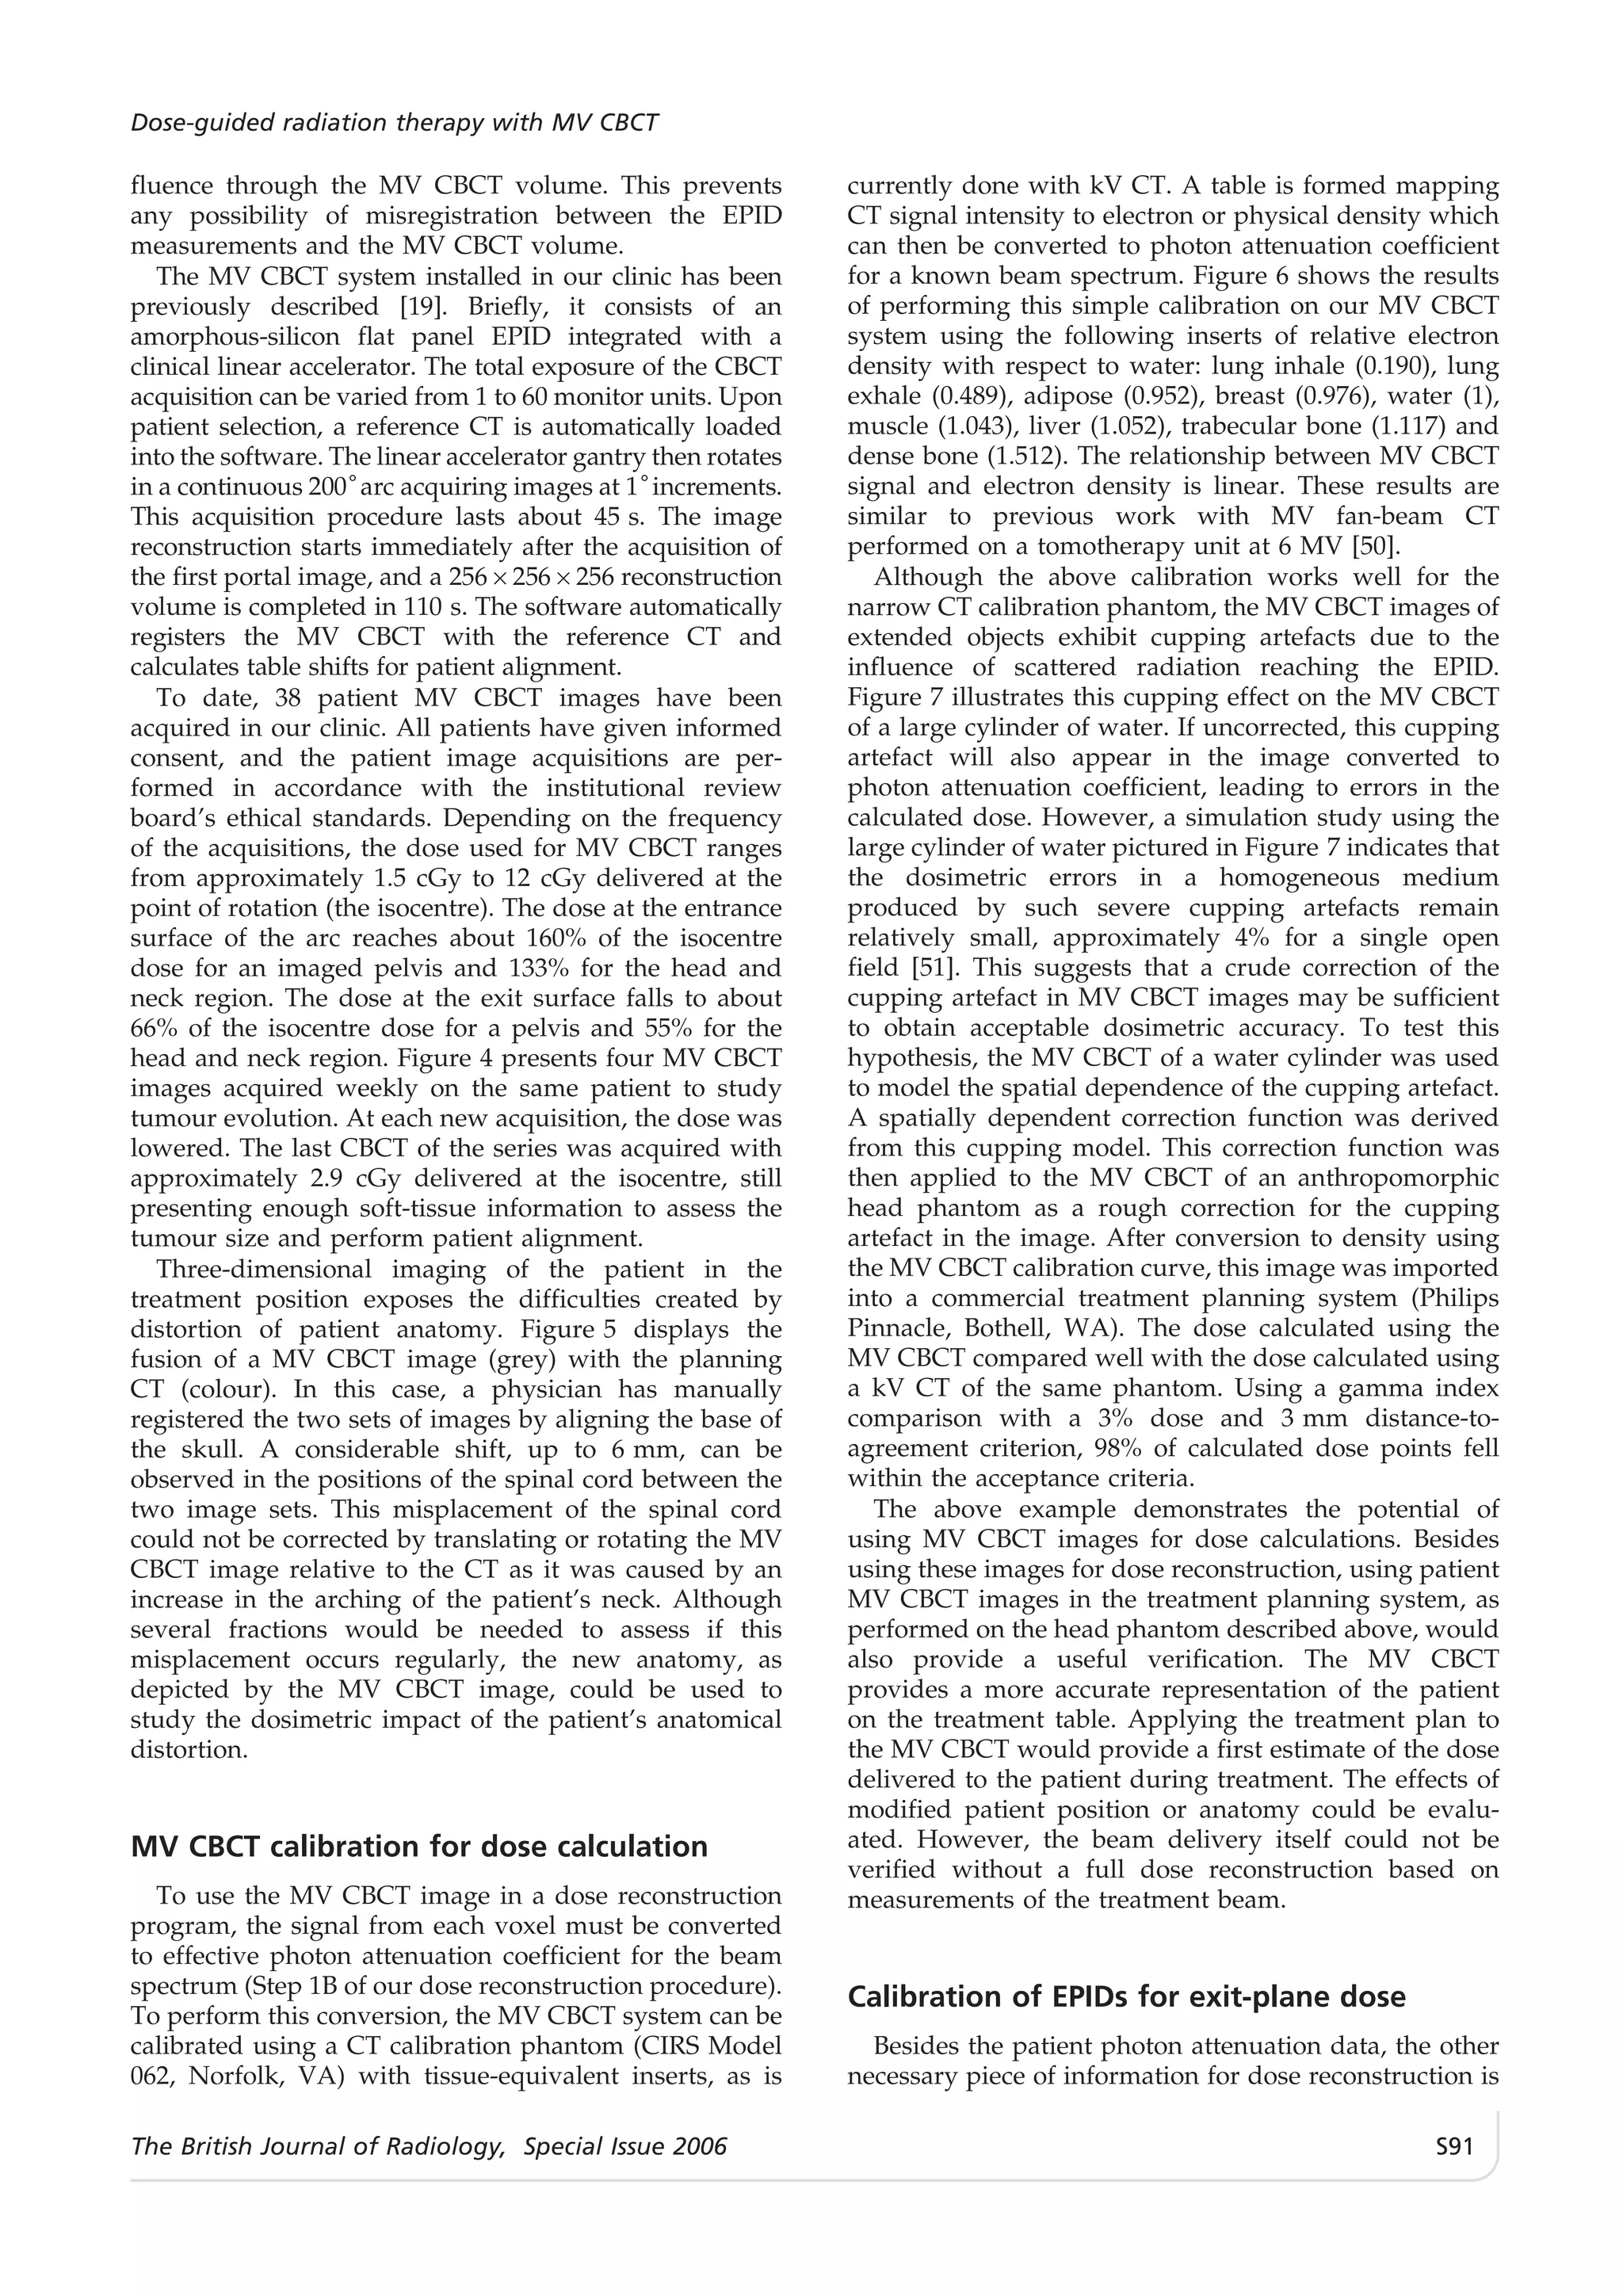


This document summarizes the key topics discussed at the 2005 President's Conference on "Technology in Imaging and Radiotherapy". The conference highlighted advances in medical imaging technologies like CT and their impact on clinical practice and workflow. Presentations covered improvements in CT scanner design allowing faster, lower dose scans over wider areas. Applications of newer cardiac CT and particle therapy techniques were also discussed. The conference emphasized that while technology enables better outcomes, optimized implementation through improved workflows is also needed to increase productivity and efficiency in medicine.