Download to read offline

![Venkat et al., World J Pharm Sci 2014; 2(2): 149-160
the acceptance limits of accuracy ± 15% for their
nominal values and precision ≤15% CV.
ionization mode. To get a good chromatographic
separation with the desired response, it was
observed that mobile phase as well as selection of
column was an important criterion. It was found
that an isocratic mobile phase system consisting of
5mM ammonium acetate and acetonitrile (15:85,
v/v) achieves good reproducible response, which
was finally adopted. The retention times of PEN,
4HPEN, DPEN and D4HPEN were 2.42, 1.98, 2.40
and 2.00 min respectively. A flow rate of 0.6
mL/min produced good peak shapes and permitted
a run time of 3.00 min. A good internal standard
must mimic the analytes during extraction and
compensate for any analyte on the column,
especially with LC-MS/MS analysis, where matrix
effects can lead to poor analytical results. In the
initial stages of this work, several compounds were
investigated to find a suitable internal standard and
finally deuterated compounds of both the interested
analytes were found to be best available for the
present purpose. Clean samples are essential for
minimizing ion suppression or enhancement in LCMS/MS technique to reduce matrix effect. Hence,
solid phase extraction was used for the sample
preparation in this work. Other extraction technique
like LLE and PPT were also tried, but SPE was
found to be optimal; it can produce a clean
chromatogram for a blank sample and yields good
reproducible recovery for analytes from the plasma.
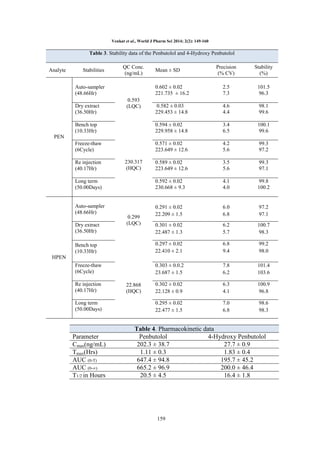
Pharmacokinetic
study
design:
A
pharmacokinetic study was performed in healthy
(n=6) male subjects. Blood samples were collected
following oral administration of Penbutolol (20
mg) and 4-Hydroxy Penbutolol (300 mg) pre-dose
at 0.00, 0.33, 0.67, 1.00, 1.33, 1.67, 2.00, 2.33,
2.67, 3.00, 3.50, 4.00, 6.00, 8.00, 10.00, 12.00,
16.00, 24.00, 36.00, 48.00 and 72.00 hours in K2
EDTA vacutainer collection tubes (BD, Franklin,
NJ, USA). The tubes were centrifuged at 3200 rpm
for 20 min at 40C and the separated plasma was
collected in new labeled tubes. The collected
plasma samples were stored at -70 ± 100C until
their use. Plasma samples were spiked with IS and
processed as per extraction method described
above. Along with clinical samples, QC samples at
low, medium and high concentrations were assayed
minimum of two sets or 5% QC samples when
calculated against unknown clinical samples which
were distributed among the unknown samples in
the analytical run; not more than 33% of the QC
samples were greater than ±15 of the nominal
concentration and minimum 50% at each individual
QC’s should pass. Time profile of Penbutolol and
4-Hydroxy Penbutolol was analyzed by noncompartmental method using WinNonlin® version
5.2 (Pharsight Corporation, Mountain View, CA,
USA).
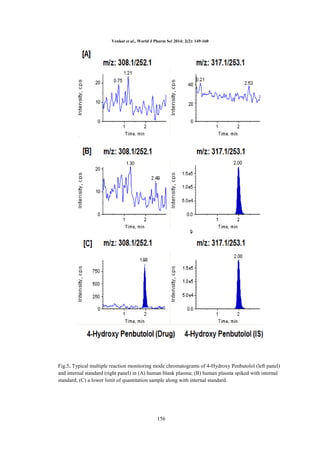
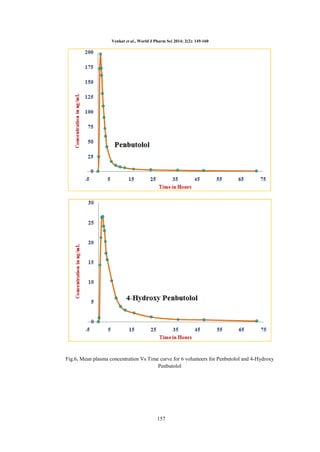
Selectivity: The degree of interference by
endogenous plasma constituents with the analyte
and IS was assessed by inspection of
chromatograms derived from a processed blank
plasma sample (pure blank & IS added blank). As
shown in Fig.4, 5. for individual analyte PEN and
4HPEN respectively, no significant interference in
the processed blank plasma samples were observed
at the retention times of the analyte and internal
standard.
RESULTS
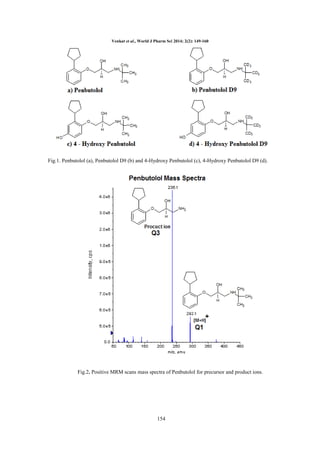
Method development: As both the drug and its
metabolite were containing acidic as well as basic
functional groups in their chemical structures, the
mass spectrometric parameters were tuned in both
positive and negative polarity ionization modes.
Good and reproducible responses were achieved in
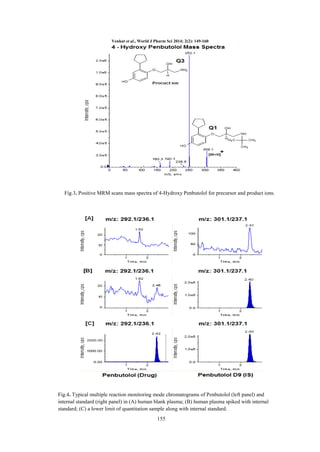
positive ionization mode. Data from the MRM
mode were considered to obtain selectivity. The
protonated form of each analyte and IS, the [M +
H]+ ion, was the parent ion in the Q1 spectrum and
was used as precursor ion to obtain Q3 product ion
spectra. The most sensitive mass transition was
monitored from m/z 292.1 → 236.1 for PEN, from
m/z 308.1 → 252.1 for 4HPEN, from m/z 301.1 →
237.1 for DPEN (IS) and from m/z 317.1 → 253.1
for D4HPEN (IS). We aimed to develop a simple
chromatographic method with a lesser run time.
Separation was tried using various combinations of
methanol and buffer with varying contents of each
component on a variety of columns, such as C8 and
C18 of different makes like Kromosil, Ace, Intersil,
Hypersil, Hypurity Advance, Zorbax, Discovery
and Chromatopak. The use of ammonium acetate
buffer at concentration of 5mM helped to achieve a
good response for MS detection in the positive
Sensitivity: The lowest limit of reliable
quantification for the analyte was set at the
concentration of the LLOQ. The precision and
accuracy at LLOQ concentration was found to be
5.3 CV & 103.7% for PEN and 6.9 CV & 101.7%
for 4HPEN.
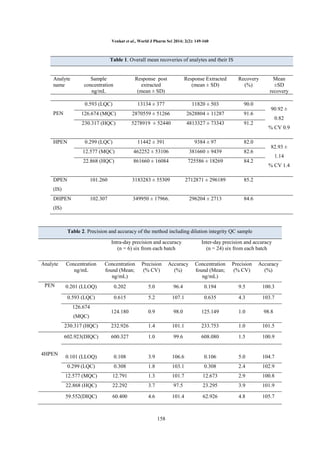
Extraction efficiency: A simple solid phase
extraction with strata-X cartridges were found to be
rugged and provided the cleanest samples. The
recoveries of the analytes and internal standards
were good and reproducible. The overall mean
recoveries with precision range of Penbutolol and
4-Hydroxy Penbutolol was presented in Table.1.
Matrix effect: There was no significant matrix
effect was observed in all the eight lots of human
plasma for the analyte at low and high QC level
152](https://image.slidesharecdn.com/020203-ps0096-140207102554-phpapp02/85/020203-ps0096-4-320.jpg)


This document describes the development and validation of a quantitative method for determining penbutolol and its metabolite 4-hydroxy penbutolol in human plasma using liquid chromatography-tandem mass spectrometry (LC-MS/MS). The method involves solid phase extraction of the analytes from plasma followed by separation using liquid chromatography with mass spectrometric detection in multiple reaction monitoring mode. The method was validated according to FDA guidelines and showed good linearity, accuracy, precision, recovery, selectivity and stability. The developed and validated LC-MS/MS method was found to be suitable for pharmacokinetic studies of penbutolol in human volunteers.


