Collecting, recording, and presenting information
•Download as PPTX, PDF•
0 likes•982 views

Geography S.B.A.

Recommended
Recommended
More Related Content
What's hot
What's hot (20)
Viewers also liked
Viewers also liked (18)
Similar to Collecting, recording, and presenting information
Similar to Collecting, recording, and presenting information (20)
Recently uploaded
Recently uploaded (20)
Collecting, recording, and presenting information
- 1. COLLECTING, RECORDING, AND PRESENTING INFORMATION BASED ON FIELD WORK
- 2. THE FIELD STUDY REPORT The field study report for C.S.E.C. Geography is the S.B.A. or school based assessment research paper. It is compulsory to the course and accounts for 20% of the final exam score. Students are expected to choose a topic of interest from their syllabus eg. Rivers, Coastal Features, Agriculture.
- 3. The S.B.A. topic The S.B.A. topic must be outlined as an area of study in the Geography syllabus eg. Mass Wasting. Next, choose an objective for the topic, these are also stated in the syllabus eg. The cause of mass wasting, or maybe the effects of mass wasting. The following components must be included in the study: 1. The Table of Contents 2. The aims 3. Location of Study Area 4. Method of Data Collection 5. Data Presentation and Analysis 6. Conclusion 7. Bibliography 8. Appendix
- 4. THE AIMS OF THE STUDY The aims of the study are what guides you during your investigation. Only 1 clear aim is required, however you can have as many as you choose to have. Aims must clearly describe how you will carry out your investigation, and be specific, including the area being investigated, as well as the name of the study area and its territory. Examples of adjectives include: To illustrate…………… To compare…………… To describe/To explain……………
- 5. Examples of good aims include: This study aims to: 1.Compare the characteristics of the Spanish River in its upper, middle and lower course in Portland, Jamaica. 2. Compare the cause of mass wasting in Whitehall, Lookout, and Grants Town, in St. Mary, Jamaica. 3. Illustrate the effects of mass wasting in Whitehall, Lookout, and Grants Town in St. Mary, Jamaica. 4. Describe and explain the role of rock type and geology in the formation of landforms in Robin’s Bay, St. Mary, Jamaica. 5. Identify the type of wave operating along the coastline of Peyton’s Point, in St. Mary, Jamaica. 6. Explain how rock type, geology and angle of slope influence the occurrence of landslides in Above Rocks, St. Catherine, Jamaica.
- 6. LOCATION OF STUDY AREA For this section of the study, you are required to produce 2 maps: 1. A small scale map of the territorial area. This map must be neat, clearly show the location of the study area, have a title, north point, scale, and key. 2. A large scale map of the site showing how to get to the site. It should clearly show the site, names of roads, places around the
- 7. Site, a north point, title, scale, and key. This map must also be neat. In summary, you should have a territorial map showing the study area, a site map showing how to get to the site, both maps should be neat, and also have conventional map features.
- 8. METHOD OF DATA COLLECTION This section of the report expects you to describe in detail how you collected your data, state where you collected your data, and when you collected your data. All these requirements must be stated in order to earn full marks. Lets look at each aspect of the methodology. How data is collected: A variety of methods may be used to collect data depending on the type of study you are undertaking. Qualitative studies seek to get information from a wider cross section of people. For such studies, a questionnaire is ideal. Interview schedules may also be used , as well as direct observation.
- 9. Qualitative studies are more descriptive on the other hand and do not readily give you the opportunity to use instruments such as questionnaires. Such studies are undertaken for natural systems topics such as rivers and coastal features. Data collection methods which can be used include 1. direct observation 2. stop watch to count wave frequency 3. float and stop watch to measure the velocity of a section of a river channel 4. metre rule to measure the depth of a river channel 5. tape measure to measure the width of a beach 6. sediment table to record the long axis, short axis, rock type and shape of a rivers bedload. 7. Taking photographs
- 10. You are expected to describe in detail the steps you took to collect your data eg. “10 metres of the river channel was measured using a metre rule. Students were used as markers at the start and finishing points. A float was sent down this stretch at the start of a timer. The second marker collected the float and the time of the journey taken with the stop watch. Five attempts were made and the data was recorded in a velocity table “(see sample in appendix). It is important to include a sample of your data collection instrument in the appendix of your study since you get 1 out of 2 marks for its inclusion. When: For this section of the methodology, you are required to state the day, month, and year in which you did field studies eg. “Data was collected in the field on Thursday, March 10th, 2017”. You can sdditionally state the period during which data was collected eg. ….during the hours of 8:30 a.m. to 12 noon.
- 11. Where: The ‘where’ aspect simply requires that you give the full address of your study area eg. “The study was conducted in the community of Brown’s Hall District, St. Catherine, Jamaica”. Leaving out the territory name will cause you to lose the mark for this section.
- 12. DATA PRESENTATION AND ANALYSIS For quantitative studies, you are expected to use the questions on your questionnaire or interview schedule to write up this section. Eg. For a study on the characteristics of the fishing industry in Old Harbour Bay, St. Catherine, Jamaica, the following question might have been asked: Question #1 In which of the following age group do you fall? A total of 20 questionnaires might have been issued. The number of responses are stated in brackets. Responses: 20-29 (0), 30-39 (2), 40-49(6), 50 and over (12)
- 13. Convert to percent : eg. 50 and over (12), 12/20 x 100 = 60% You are not expected to show your working, instead, under the questionnaire questions used as headings, present your data as follows: Question 1: The Age of Fishermen in Old Harbour Bay Figure 1 5%5% 30% 60% Age of Fishermen in Old Harbour Bay 20-29 30-39 40-49 50 and over
- 14. Be sure to fully label and title your graphs. Following the data presentation, you are then expected to analyze your data. A possible analysis which could be obtained from the data presented is as follows: “ Fishing is an activity undertaken by middle aged men since younger men do not find the profession attractive”. Please note, at no time should you separate the illustrations from your text otherwise you will lose marks for integrating illustrations with text. Also, never stray from your aims in writing up your report. For a qualitative study, you are required to write your report as a series of stops. Example: Stop 1: Robins Bay, Stop 2: Peyton’s Cove, Stop 3: Peyton’s Point. Use the stops as your headings. Under each, present your illustration, then analyze your data .
- 15. ILLUSTRATIONS You are expected to use at least 3 different illustrations to present your data. These might include graphs eg. Pie, bar, histogram, or line graph. Please note, line graphs must only be used to show change in data. Other methods include field sketches as shown on the right. Field sketches must be clearly, labelled and titled in order to receive full marks. Also, as with all other illustrations, you must make reference to them.
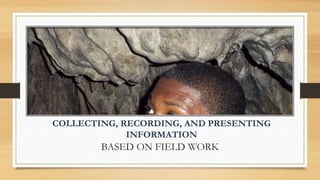
- 16. PHOTOGRAPHIC ILLUSTRATIONS Photographs are the best way to capture features observed in the field. However, in order to use them effectively, they must be: -Clearly labelled and Titled -Have a border -and you must make reference to them , otherwise they are just pretty additions to your study without relevance. STALACTITE STALAGMITE
- 17. THE CONCLUSION/FINDINGS Your conclusion provides a summary of your report findings. To do it properly, use your aim(s) as a guide by simply answering them in a summary like fashion. You must not introduce any information in your conclusion which was not mentioned throughout the body of your study.
- 18. BIBLIOGRAPHY In your bibliography, you are expected to use at least 3 text books as sources of reference. Write up your bibliography by authors surname in alphabetical order. The title of the text book, place and year of publishing must also be written.
- 19. APPENDIX Simply place a sample of your data collection instrument in this section.