SlideShare a Scribd company logo
1 of 6
Download to read offline
Covariance and Correlation
( c Robert J. Serfling – Not for reproduction or distribution)
We have seen how to summarize a data-based relative frequency distribution by mea-
sures of location and spread, such as the sample mean and sample variance. Likewise,
we have seen how to summarize probability distribution of a random variable X by
similar measures of location and spread, the mean and variance parameters. Now
we ask,
For a pair of random variables X and Y having joint probability distri-
bution
p(x, y) = P(X = x, Y = y)
how might we summarize the distribution?
For location features of a joint distribution, we simply use the means µX and µY of
the corresponding marginal distributions for X and Y . Likewise, for spread features
we use σ2
X and σ2
Y . For joint distributions, however, we can go further and explore
a further type of feature: the manner in which X and Y are interrelated or manifest
dependence. For example, consider the joint distribution given by the following table
for p(x, y):
Y
0 1
0 .7 .1
X
1 .1 .1
We see that there is indeed some dependence here: if a pair (X, Y ) is selected
at random according to this distribution, the probability that (X, Y ) = (0, 0) is
selected is .70, whereas the product of the probabilities that X = 0 and Y = 0 is
.8 × .8 = .64 = .70. So the events X = 0 and Y = 0 are dependent events. But
we can go further, asking: How might we characterize the extent or quantity of this
“dependence” feature?
There are in fact a variety of possible ways to formulate a suitable measure of
dependence. We shall consider here one very useful approach: “covariance.”
Covariance
One way that X and Y can exhibit dependence is to “vary together” – i.e., the
distribution p(x, y) might attach relatively high probability to pairs (x, y) for which
the deviation of x above its mean, x − µX , and the deviation of y above its mean,
y − µY , are either both positive or both negative and relatively large in magnitude.
Thus, for example, the information that a pair (x, y) had an x with positive deviation
x − µX would suggest that, unless something unusual had occurred, the y of the
1
given pair also had a positive deviation above its mean. A natural numerical measure
which takes account of this type of information is the sum of terms
(1)
x y
(x − µX )(y − µY )p(x, y) .
For the kind of dependence just described, this sum would tend to be dominated by
large positive terms.
Another way that X and Y could exhibit dependence is to “vary oppositely,” in
which case pairs (x, y) such that one of x − µX and y − µY is positive and the other
negative would receive relatively high probability. In this case the sum (1) would
tend to be dominated by negative terms.
Consequently, the sum (1) tends to indicate something about the kind of depen-
dence between X and Y . We call it the covariance of X and Y and use the following
notation and representations:
Cov(X, Y ) = σXY =
x y
(x − µX )(y − µY )p(x, y) = E [(X − µX )(Y − µY )] .
It is easily checked that an equivalent formula for computing the covariance is:
σXY = E(XY ) − E(X)E(Y ).
For the example of p(x, y) considered above, we find:
µX = µY = .2, E(XY ) = .1, σXY = .06 .
Does this indicate a strong relationship between X and Y? What kind of relationship?
How can we tell whether a particular value for σXY is meaningfully large or not?
We’ll return to these questions below, but for now let us explore some other aspects
of covariance.
Independence of X and Y implies Covariance = 0. This important fact is seen
(for the discrete case) as follows. If X and Y are independent, then their joint
distribution factors into the product of marginals. Using this, we have
σXY =
x y
(x − µX )(y − µY )p(x, y)
=
x y
(x − µX )(y − µY )pX(x)pY (y)
=
x
(x − µX )pX(x)
y
(y − µY )pY (y)
= [µX − µX ][µY − µY ]
= 0 · 0 = 0 .
Of course, we should want any reasonable measure of dependence to reduce to the
value 0 in the case of an absence of dependence. 2
2
For some measures of dependence which have been proposed in the literature, the
converse holds as well: if the measure has value 0, then the variables are independent.
However, for the covariance measure, this converse is not true.
EXAMPLE. Consider the joint probability distribution
Y
−1 0 1
0 0 1/3 0
X
1 1/3 0 1/3
Note that for this distribution we have a very strong relationship between X and Y :
ignoring pairs (x, y) with 0 probability, we have
X = Y 2
.
On the other hand,
σXY = E(XY ) − E(X)E(Y ) = E(Y 3
) − E(X) · 0 = E(Y 3
) = 0.
Thus the covariance measure fails to detect the dependence structure. 2
Preliminary Conclusions about Covariance:
a) Independence of X and Y implies σXY = 0;
b) σXY = 0 does not necessarily indicate independence;
c) σXY = 0 indicates some kind of dependence is present (what kind?).
In order to be able to interpret the meaning of a nonzero covariance value, we ask
How big can σXY be in value?
It turns out that the covariance always lies between two limits which may be ex-
pressed in terms of the variances of X and Y :
−σX σY ≤ σXY ≤ +σX σY .
(This follows from the Cauchy-Schwarz inequality: for any two r.v.’s W and Z,
|E(WZ)| ≤ [E(W2
)]1/2
[E(Z2
)]1/2
, with equality if and only if W and Z are propor-
tional.)
Moreover, the covariance can attain one of these limits only in the case that
X − µX and Y − µY are proportional: i.e., for some constant c,
X − µX = c(Y − µY ) ,
i.e.,
Y =
1
c
X + (µY −
µX
c
) ,
i.e., X and Y satisfy a linear relationship, Y = aX + b for some choice of a and b.
3
Interpretation of covariance. The above considerations lead to an interpretation
of covariance: σXY measures the degree of linear relationship between X and Y .
(This is why σXY = 0 for the example in which X = Y 2 with X symmetric about
0. This is a purely quadratic relationship, quite nonlinear.) 2
Thus we see that covariance measures a particular kind of dependence, the de-
gree of linear relationship. We can assess the strength of a covariance measure by
comparing its magnitude with the largest possible value, σX σY . If σXY attains
this magnitude, then the variables X and Y have a purely linear relationship. If
σXY = 0, however, then either the relationship between X and Y can be assumed to
be of some nonlinear type, or else the variables are independent. If σXY lies between
these values in magnitude, then we conclude that X and Y have a relationship which
is a mixture of linear and other components.
A somewhat undesirable aspect of the covariance measure is that its value
changes if we transform the variables involved to other units. For example, if the
variables are X and Y and we transform to new variables
X∗
= cX, Y ∗
= dY,
note that
Cov(X∗
, Y ∗
) = E [(X∗
− E(X∗
))(Y ∗
− E(Y ∗
))]
= E [c(X − E(X))d(Y − E(Y ))]
= cd Cov(X, Y ) .
Thus, counter to our intuition that dependence relationships should not be altered
by simply rescaling the variables, the covariance measure indeed is affected.
It is preferable to have a dependence measure which is not sensitive to irrelevant
details such as units of measurement. Next we see how to convert to an equivalent
measure which is “dimensionless” in this sense.
Correlation
Recall that the upper and lower limits for the possible values which the covariance
can take are given in terms of the variances, which also change with rescaling of
variables. Consequently, in order to decide whether a particular value for the co-
variance is “big” or ”small,” we need to assess it relative to the variances of the
two variables. One way to do this is to divide the covariance by the product of the
standard deviations of the variables, producing the quantity
ρXY = E
X − µX
σX
Y − µY
σY
=
Cov(X, Y )
Var(X) Var(Y )
=
σXY
σX σY
,
which we call the correlation of X and Y. It is easily seen (check) that this measure
does not change when we rescale the variables X and Y to X∗ = cX, Y ∗ = dY
4
as considered above. Also, the upper and lower limits we saw for the covariance
translate to the following limits for the value of the correlation:
−1 ≤ ρXY ≤ 1 .
Thus we can judge the strength of the dependence by how close the correlation
measure comes to either of its extreme values +1 or −1 (and away from the value
0 that suggests an absence of dependence). However, keep in mind that — like the
covariance — the correlation is especially sensitive to a certain kind of dependence,
namely linear dependence, and can have a small value (near 0) even when there
is strong dependence of other kinds. (We saw in the previous lecture an example
when the covariance — and hence the correlation — is 0 even when there is strong
dependence, but of a nonlinear kind.)
Let us now illustrate the use of the correlation parameter to judge the degree
of (linear) dependence in the following probability distribution which we considered
above:
Y
0 1
0 .7 .1
X
1 .1 .1
We had calculated its covariance to be σXY = .06, but at that time we did not
assess how meaningful this value is. Now we do so, by converting to correlation.
First finding the variances σ2
X = .16 = σ2
Y , we then compute
ρXY =
.06
√
.16
√
.16
= .36 ,
which we might interpret as “moderate” (not close to 0, but not close to 1, either).
Moreover, note that a positive value of correlation is obtained in this example,
indicating that deviations of X from its mean tend to be associated with deviations
of Y from its mean in the same direction.
In what cases does correlation attain the value +1? −1? Suppose that Y is
related to X exactly as a linear transformation of X: Y = a + bX, for some choice
of a, b. Then we have the following analysis:
E(XY ) = E[X(a + bX)] = aE(X) + bE(X2
)
and so
σXY = E(XY ) − E(X)E(Y ) = [aE(X) + bE(X2
)] − E(X)E(a + bX)
= · · ·
= bσ2
X
and thus, finally,
ρXY =
bσ2
X
σXσY
=
b
|b|
,
5
which we see takes value +1 if b > 0 and value −1 if b < 0. It can be shown,
also, that the values +1 and −1 are attainable only in the case of exactly linear
relationships. This is the basis for characterizing correlation as a measure of the
“degree of linear relationship” between X and Y . Despite this intuitive appeal of
the correlation measure, note that it really doesn’t leave us with a precise meaning
in the case of a value intermediate between 0 and ±1. intermediate values. 2
Despite any shortcomings the correlation measure may have, it has very wide
application. This is based on
• its fairly successful intuitive appeal as a measure of dependence,
• the central importance of confirming (or disproving) linear relationships,
• its application to calculating variances of linear combinations of r.v.’s,
• its application in analyzing and interpreting regression models.
As a final illustration, let us consider the special case that Y is defined to be just
X itself, i.e., Y = X. This is a special case of the linear transformation with a = 0
and b = 1, so we have: ρ = 1, i.e.,
Corr(X, X) = 1 .
Likewise, we can talk of the “covariance of a r.v. X with itself,” and we readily find
that it reduces to the variance of X:
Cov(X, X) = Var(X) .
(To see this immediately, just go back and check the definition of covariance.)
6

More Related Content

What's hot

correlation and regression
correlation and regressioncorrelation and regression
correlation and regressionUnsa Shakir
 
multiple regression
multiple regressionmultiple regression
multiple regressionPriya Sharma
 
Chapter 6 simple regression and correlation
Chapter 6 simple regression and correlationChapter 6 simple regression and correlation
Chapter 6 simple regression and correlationRione Drevale
 
Relations among variables
Relations among variablesRelations among variables
Relations among variablesJulio Huato
 
regression and correlation
regression and correlationregression and correlation
regression and correlationPriya Sharma
 
Numbers, reciprocals, averages
Numbers, reciprocals, averagesNumbers, reciprocals, averages
Numbers, reciprocals, averagesJulio Huato
 
Regression Analysis
Regression AnalysisRegression Analysis
Regression AnalysisASAD ALI
 
CALCULATING CORRELATION COEFFICIENT
CALCULATING CORRELATION COEFFICIENTCALCULATING CORRELATION COEFFICIENT
CALCULATING CORRELATION COEFFICIENTsumanmathews
 
Regression (Linear Regression and Logistic Regression) by Akanksha Bali
Regression (Linear Regression and Logistic Regression) by Akanksha BaliRegression (Linear Regression and Logistic Regression) by Akanksha Bali
Regression (Linear Regression and Logistic Regression) by Akanksha BaliAkanksha Bali
 
SUA_Seminar_Presentation
SUA_Seminar_PresentationSUA_Seminar_Presentation
SUA_Seminar_PresentationKhushbu Mishra
 
Pearson Correlation, Spearman Correlation &Linear Regression
Pearson Correlation, Spearman Correlation &Linear RegressionPearson Correlation, Spearman Correlation &Linear Regression
Pearson Correlation, Spearman Correlation &Linear RegressionAzmi Mohd Tamil
 
Correlation and Regression
Correlation and RegressionCorrelation and Regression
Correlation and RegressionShubham Mehta
 
Correlation analysis ppt
Correlation analysis pptCorrelation analysis ppt
Correlation analysis pptAnil Mishra
 

What's hot (20)

correlation and regression
correlation and regressioncorrelation and regression
correlation and regression
 
multiple regression
multiple regressionmultiple regression
multiple regression
 
Chapter 6 simple regression and correlation
Chapter 6 simple regression and correlationChapter 6 simple regression and correlation
Chapter 6 simple regression and correlation
 
Regression
RegressionRegression
Regression
 
Relations among variables
Relations among variablesRelations among variables
Relations among variables
 
regression and correlation
regression and correlationregression and correlation
regression and correlation
 
Ch6
Ch6Ch6
Ch6
 
Correlation and regression
Correlation and regressionCorrelation and regression
Correlation and regression
 
Numbers, reciprocals, averages
Numbers, reciprocals, averagesNumbers, reciprocals, averages
Numbers, reciprocals, averages
 
S2 pb
S2 pbS2 pb
S2 pb
 
5 regression
5 regression5 regression
5 regression
 
Regression Analysis
Regression AnalysisRegression Analysis
Regression Analysis
 
Correlation continued
Correlation continuedCorrelation continued
Correlation continued
 
CALCULATING CORRELATION COEFFICIENT
CALCULATING CORRELATION COEFFICIENTCALCULATING CORRELATION COEFFICIENT
CALCULATING CORRELATION COEFFICIENT
 
Regression ppt
Regression pptRegression ppt
Regression ppt
 
Regression (Linear Regression and Logistic Regression) by Akanksha Bali
Regression (Linear Regression and Logistic Regression) by Akanksha BaliRegression (Linear Regression and Logistic Regression) by Akanksha Bali
Regression (Linear Regression and Logistic Regression) by Akanksha Bali
 
SUA_Seminar_Presentation
SUA_Seminar_PresentationSUA_Seminar_Presentation
SUA_Seminar_Presentation
 
Pearson Correlation, Spearman Correlation &Linear Regression
Pearson Correlation, Spearman Correlation &Linear RegressionPearson Correlation, Spearman Correlation &Linear Regression
Pearson Correlation, Spearman Correlation &Linear Regression
 
Correlation and Regression
Correlation and RegressionCorrelation and Regression
Correlation and Regression
 
Correlation analysis ppt
Correlation analysis pptCorrelation analysis ppt
Correlation analysis ppt
 

Similar to Covariance and Correlation - Measuring Dependence Between Random Variables

Similar to Covariance and Correlation - Measuring Dependence Between Random Variables (20)

SM_d89ccf05-7de1-4a30-a134-3143e9b3bf3f_38.pptx
SM_d89ccf05-7de1-4a30-a134-3143e9b3bf3f_38.pptxSM_d89ccf05-7de1-4a30-a134-3143e9b3bf3f_38.pptx
SM_d89ccf05-7de1-4a30-a134-3143e9b3bf3f_38.pptx
 
Statistics
StatisticsStatistics
Statistics
 
Statistics
Statistics Statistics
Statistics
 
REGRESSION ANALYSIS THEORY EXPLAINED HERE
REGRESSION ANALYSIS THEORY EXPLAINED HEREREGRESSION ANALYSIS THEORY EXPLAINED HERE
REGRESSION ANALYSIS THEORY EXPLAINED HERE
 
2. If you have a nonlinear relationship between an independent varia.pdf
2. If you have a nonlinear relationship between an independent varia.pdf2. If you have a nonlinear relationship between an independent varia.pdf
2. If you have a nonlinear relationship between an independent varia.pdf
 
Linear regression
Linear regressionLinear regression
Linear regression
 
Applied statistics part 4
Applied statistics part  4Applied statistics part  4
Applied statistics part 4
 
Corr And Regress
Corr And RegressCorr And Regress
Corr And Regress
 
CH6.pdf
CH6.pdfCH6.pdf
CH6.pdf
 
Correlation and regression impt
Correlation and regression imptCorrelation and regression impt
Correlation and regression impt
 
Assumptions of OLS.pptx
Assumptions of OLS.pptxAssumptions of OLS.pptx
Assumptions of OLS.pptx
 
How to learn Correlation and Regression for JEE Main 2015
How to learn Correlation and Regression for JEE Main 2015 How to learn Correlation and Regression for JEE Main 2015
How to learn Correlation and Regression for JEE Main 2015
 
Corr-and-Regress (1).ppt
Corr-and-Regress (1).pptCorr-and-Regress (1).ppt
Corr-and-Regress (1).ppt
 
Corr-and-Regress.ppt
Corr-and-Regress.pptCorr-and-Regress.ppt
Corr-and-Regress.ppt
 
Cr-and-Regress.ppt
Cr-and-Regress.pptCr-and-Regress.ppt
Cr-and-Regress.ppt
 
Corr-and-Regress.ppt
Corr-and-Regress.pptCorr-and-Regress.ppt
Corr-and-Regress.ppt
 
Corr-and-Regress.ppt
Corr-and-Regress.pptCorr-and-Regress.ppt
Corr-and-Regress.ppt
 
Correlation & Regression for Statistics Social Science
Correlation & Regression for Statistics Social ScienceCorrelation & Regression for Statistics Social Science
Correlation & Regression for Statistics Social Science
 
Corr-and-Regress.ppt
Corr-and-Regress.pptCorr-and-Regress.ppt
Corr-and-Regress.ppt
 
S1 pb
S1 pbS1 pb
S1 pb
 

Recently uploaded

Behavioral Disorder: Schizophrenia & it's Case Study.pdf
Behavioral Disorder: Schizophrenia & it's Case Study.pdfBehavioral Disorder: Schizophrenia & it's Case Study.pdf
Behavioral Disorder: Schizophrenia & it's Case Study.pdfSELF-EXPLANATORY
 
RESPIRATORY ADAPTATIONS TO HYPOXIA IN HUMNAS.pptx
RESPIRATORY ADAPTATIONS TO HYPOXIA IN HUMNAS.pptxRESPIRATORY ADAPTATIONS TO HYPOXIA IN HUMNAS.pptx
RESPIRATORY ADAPTATIONS TO HYPOXIA IN HUMNAS.pptxFarihaAbdulRasheed
 
Call Girls in Munirka Delhi 💯Call Us 🔝9953322196🔝 💯Escort.
Call Girls in Munirka Delhi 💯Call Us 🔝9953322196🔝 💯Escort.Call Girls in Munirka Delhi 💯Call Us 🔝9953322196🔝 💯Escort.
Call Girls in Munirka Delhi 💯Call Us 🔝9953322196🔝 💯Escort.aasikanpl
 
GenBio2 - Lesson 1 - Introduction to Genetics.pptx
GenBio2 - Lesson 1 - Introduction to Genetics.pptxGenBio2 - Lesson 1 - Introduction to Genetics.pptx
GenBio2 - Lesson 1 - Introduction to Genetics.pptxBerniceCayabyab1
 
Scheme-of-Work-Science-Stage-4 cambridge science.docx
Scheme-of-Work-Science-Stage-4 cambridge science.docxScheme-of-Work-Science-Stage-4 cambridge science.docx
Scheme-of-Work-Science-Stage-4 cambridge science.docxyaramohamed343013
 
Environmental Biotechnology Topic:- Microbial Biosensor
Environmental Biotechnology Topic:- Microbial BiosensorEnvironmental Biotechnology Topic:- Microbial Biosensor
Environmental Biotechnology Topic:- Microbial Biosensorsonawaneprad
 
LIGHT-PHENOMENA-BY-CABUALDIONALDOPANOGANCADIENTE-CONDEZA (1).pptx
LIGHT-PHENOMENA-BY-CABUALDIONALDOPANOGANCADIENTE-CONDEZA (1).pptxLIGHT-PHENOMENA-BY-CABUALDIONALDOPANOGANCADIENTE-CONDEZA (1).pptx
LIGHT-PHENOMENA-BY-CABUALDIONALDOPANOGANCADIENTE-CONDEZA (1).pptxmalonesandreagweneth
 
Topic 9- General Principles of International Law.pptx
Topic 9- General Principles of International Law.pptxTopic 9- General Principles of International Law.pptx
Topic 9- General Principles of International Law.pptxJorenAcuavera1
 
preservation, maintanence and improvement of industrial organism.pptx
preservation, maintanence and improvement of industrial organism.pptxpreservation, maintanence and improvement of industrial organism.pptx
preservation, maintanence and improvement of industrial organism.pptxnoordubaliya2003
 
Analytical Profile of Coleus Forskohlii | Forskolin .pptx
Analytical Profile of Coleus Forskohlii | Forskolin .pptxAnalytical Profile of Coleus Forskohlii | Forskolin .pptx
Analytical Profile of Coleus Forskohlii | Forskolin .pptxSwapnil Therkar
 
Bentham & Hooker's Classification. along with the merits and demerits of the ...
Bentham & Hooker's Classification. along with the merits and demerits of the ...Bentham & Hooker's Classification. along with the merits and demerits of the ...
Bentham & Hooker's Classification. along with the merits and demerits of the ...Nistarini College, Purulia (W.B) India
 
Pests of castor_Binomics_Identification_Dr.UPR.pdf
Pests of castor_Binomics_Identification_Dr.UPR.pdfPests of castor_Binomics_Identification_Dr.UPR.pdf
Pests of castor_Binomics_Identification_Dr.UPR.pdfPirithiRaju
 
Is RISC-V ready for HPC workload? Maybe?
Is RISC-V ready for HPC workload? Maybe?Is RISC-V ready for HPC workload? Maybe?
Is RISC-V ready for HPC workload? Maybe?Patrick Diehl
 
Pests of soyabean_Binomics_IdentificationDr.UPR.pdf
Pests of soyabean_Binomics_IdentificationDr.UPR.pdfPests of soyabean_Binomics_IdentificationDr.UPR.pdf
Pests of soyabean_Binomics_IdentificationDr.UPR.pdfPirithiRaju
 
Call Girls In Nihal Vihar Delhi ❤️8860477959 Looking Escorts In 24/7 Delhi NCR
Call Girls In Nihal Vihar Delhi ❤️8860477959 Looking Escorts In 24/7 Delhi NCRCall Girls In Nihal Vihar Delhi ❤️8860477959 Looking Escorts In 24/7 Delhi NCR
Call Girls In Nihal Vihar Delhi ❤️8860477959 Looking Escorts In 24/7 Delhi NCRlizamodels9
 
FREE NURSING BUNDLE FOR NURSES.PDF by na
FREE NURSING BUNDLE FOR NURSES.PDF by naFREE NURSING BUNDLE FOR NURSES.PDF by na
FREE NURSING BUNDLE FOR NURSES.PDF by naJASISJULIANOELYNV
 
Pests of Blackgram, greengram, cowpea_Dr.UPR.pdf
Pests of Blackgram, greengram, cowpea_Dr.UPR.pdfPests of Blackgram, greengram, cowpea_Dr.UPR.pdf
Pests of Blackgram, greengram, cowpea_Dr.UPR.pdfPirithiRaju
 
STOPPED FLOW METHOD & APPLICATION MURUGAVENI B.pptx
STOPPED FLOW METHOD & APPLICATION MURUGAVENI B.pptxSTOPPED FLOW METHOD & APPLICATION MURUGAVENI B.pptx
STOPPED FLOW METHOD & APPLICATION MURUGAVENI B.pptxMurugaveni B
 
Pests of Bengal gram_Identification_Dr.UPR.pdf
Pests of Bengal gram_Identification_Dr.UPR.pdfPests of Bengal gram_Identification_Dr.UPR.pdf
Pests of Bengal gram_Identification_Dr.UPR.pdfPirithiRaju
 

Recently uploaded (20)

Behavioral Disorder: Schizophrenia & it's Case Study.pdf
Behavioral Disorder: Schizophrenia & it's Case Study.pdfBehavioral Disorder: Schizophrenia & it's Case Study.pdf
Behavioral Disorder: Schizophrenia & it's Case Study.pdf
 
RESPIRATORY ADAPTATIONS TO HYPOXIA IN HUMNAS.pptx
RESPIRATORY ADAPTATIONS TO HYPOXIA IN HUMNAS.pptxRESPIRATORY ADAPTATIONS TO HYPOXIA IN HUMNAS.pptx
RESPIRATORY ADAPTATIONS TO HYPOXIA IN HUMNAS.pptx
 
Call Girls in Munirka Delhi 💯Call Us 🔝9953322196🔝 💯Escort.
Call Girls in Munirka Delhi 💯Call Us 🔝9953322196🔝 💯Escort.Call Girls in Munirka Delhi 💯Call Us 🔝9953322196🔝 💯Escort.
Call Girls in Munirka Delhi 💯Call Us 🔝9953322196🔝 💯Escort.
 
GenBio2 - Lesson 1 - Introduction to Genetics.pptx
GenBio2 - Lesson 1 - Introduction to Genetics.pptxGenBio2 - Lesson 1 - Introduction to Genetics.pptx
GenBio2 - Lesson 1 - Introduction to Genetics.pptx
 
Scheme-of-Work-Science-Stage-4 cambridge science.docx
Scheme-of-Work-Science-Stage-4 cambridge science.docxScheme-of-Work-Science-Stage-4 cambridge science.docx
Scheme-of-Work-Science-Stage-4 cambridge science.docx
 
Environmental Biotechnology Topic:- Microbial Biosensor
Environmental Biotechnology Topic:- Microbial BiosensorEnvironmental Biotechnology Topic:- Microbial Biosensor
Environmental Biotechnology Topic:- Microbial Biosensor
 
LIGHT-PHENOMENA-BY-CABUALDIONALDOPANOGANCADIENTE-CONDEZA (1).pptx
LIGHT-PHENOMENA-BY-CABUALDIONALDOPANOGANCADIENTE-CONDEZA (1).pptxLIGHT-PHENOMENA-BY-CABUALDIONALDOPANOGANCADIENTE-CONDEZA (1).pptx
LIGHT-PHENOMENA-BY-CABUALDIONALDOPANOGANCADIENTE-CONDEZA (1).pptx
 
Topic 9- General Principles of International Law.pptx
Topic 9- General Principles of International Law.pptxTopic 9- General Principles of International Law.pptx
Topic 9- General Principles of International Law.pptx
 
preservation, maintanence and improvement of industrial organism.pptx
preservation, maintanence and improvement of industrial organism.pptxpreservation, maintanence and improvement of industrial organism.pptx
preservation, maintanence and improvement of industrial organism.pptx
 
Analytical Profile of Coleus Forskohlii | Forskolin .pptx
Analytical Profile of Coleus Forskohlii | Forskolin .pptxAnalytical Profile of Coleus Forskohlii | Forskolin .pptx
Analytical Profile of Coleus Forskohlii | Forskolin .pptx
 
Bentham & Hooker's Classification. along with the merits and demerits of the ...
Bentham & Hooker's Classification. along with the merits and demerits of the ...Bentham & Hooker's Classification. along with the merits and demerits of the ...
Bentham & Hooker's Classification. along with the merits and demerits of the ...
 
Pests of castor_Binomics_Identification_Dr.UPR.pdf
Pests of castor_Binomics_Identification_Dr.UPR.pdfPests of castor_Binomics_Identification_Dr.UPR.pdf
Pests of castor_Binomics_Identification_Dr.UPR.pdf
 
Is RISC-V ready for HPC workload? Maybe?
Is RISC-V ready for HPC workload? Maybe?Is RISC-V ready for HPC workload? Maybe?
Is RISC-V ready for HPC workload? Maybe?
 
Pests of soyabean_Binomics_IdentificationDr.UPR.pdf
Pests of soyabean_Binomics_IdentificationDr.UPR.pdfPests of soyabean_Binomics_IdentificationDr.UPR.pdf
Pests of soyabean_Binomics_IdentificationDr.UPR.pdf
 
Call Girls In Nihal Vihar Delhi ❤️8860477959 Looking Escorts In 24/7 Delhi NCR
Call Girls In Nihal Vihar Delhi ❤️8860477959 Looking Escorts In 24/7 Delhi NCRCall Girls In Nihal Vihar Delhi ❤️8860477959 Looking Escorts In 24/7 Delhi NCR
Call Girls In Nihal Vihar Delhi ❤️8860477959 Looking Escorts In 24/7 Delhi NCR
 
FREE NURSING BUNDLE FOR NURSES.PDF by na
FREE NURSING BUNDLE FOR NURSES.PDF by naFREE NURSING BUNDLE FOR NURSES.PDF by na
FREE NURSING BUNDLE FOR NURSES.PDF by na
 
Pests of Blackgram, greengram, cowpea_Dr.UPR.pdf
Pests of Blackgram, greengram, cowpea_Dr.UPR.pdfPests of Blackgram, greengram, cowpea_Dr.UPR.pdf
Pests of Blackgram, greengram, cowpea_Dr.UPR.pdf
 
STOPPED FLOW METHOD & APPLICATION MURUGAVENI B.pptx
STOPPED FLOW METHOD & APPLICATION MURUGAVENI B.pptxSTOPPED FLOW METHOD & APPLICATION MURUGAVENI B.pptx
STOPPED FLOW METHOD & APPLICATION MURUGAVENI B.pptx
 
Hot Sexy call girls in Moti Nagar,🔝 9953056974 🔝 escort Service
Hot Sexy call girls in  Moti Nagar,🔝 9953056974 🔝 escort ServiceHot Sexy call girls in  Moti Nagar,🔝 9953056974 🔝 escort Service
Hot Sexy call girls in Moti Nagar,🔝 9953056974 🔝 escort Service
 
Pests of Bengal gram_Identification_Dr.UPR.pdf
Pests of Bengal gram_Identification_Dr.UPR.pdfPests of Bengal gram_Identification_Dr.UPR.pdf
Pests of Bengal gram_Identification_Dr.UPR.pdf
 

Covariance and Correlation - Measuring Dependence Between Random Variables

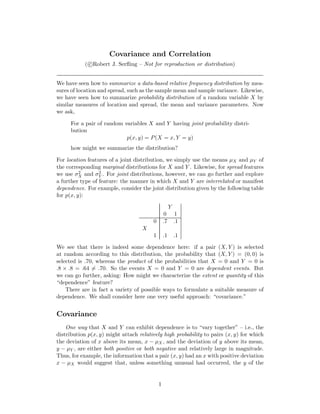
  • 1. Covariance and Correlation ( c Robert J. Serfling – Not for reproduction or distribution) We have seen how to summarize a data-based relative frequency distribution by mea- sures of location and spread, such as the sample mean and sample variance. Likewise, we have seen how to summarize probability distribution of a random variable X by similar measures of location and spread, the mean and variance parameters. Now we ask, For a pair of random variables X and Y having joint probability distri- bution p(x, y) = P(X = x, Y = y) how might we summarize the distribution? For location features of a joint distribution, we simply use the means µX and µY of the corresponding marginal distributions for X and Y . Likewise, for spread features we use σ2 X and σ2 Y . For joint distributions, however, we can go further and explore a further type of feature: the manner in which X and Y are interrelated or manifest dependence. For example, consider the joint distribution given by the following table for p(x, y): Y 0 1 0 .7 .1 X 1 .1 .1 We see that there is indeed some dependence here: if a pair (X, Y ) is selected at random according to this distribution, the probability that (X, Y ) = (0, 0) is selected is .70, whereas the product of the probabilities that X = 0 and Y = 0 is .8 × .8 = .64 = .70. So the events X = 0 and Y = 0 are dependent events. But we can go further, asking: How might we characterize the extent or quantity of this “dependence” feature? There are in fact a variety of possible ways to formulate a suitable measure of dependence. We shall consider here one very useful approach: “covariance.” Covariance One way that X and Y can exhibit dependence is to “vary together” – i.e., the distribution p(x, y) might attach relatively high probability to pairs (x, y) for which the deviation of x above its mean, x − µX , and the deviation of y above its mean, y − µY , are either both positive or both negative and relatively large in magnitude. Thus, for example, the information that a pair (x, y) had an x with positive deviation x − µX would suggest that, unless something unusual had occurred, the y of the 1
  • 2. given pair also had a positive deviation above its mean. A natural numerical measure which takes account of this type of information is the sum of terms (1) x y (x − µX )(y − µY )p(x, y) . For the kind of dependence just described, this sum would tend to be dominated by large positive terms. Another way that X and Y could exhibit dependence is to “vary oppositely,” in which case pairs (x, y) such that one of x − µX and y − µY is positive and the other negative would receive relatively high probability. In this case the sum (1) would tend to be dominated by negative terms. Consequently, the sum (1) tends to indicate something about the kind of depen- dence between X and Y . We call it the covariance of X and Y and use the following notation and representations: Cov(X, Y ) = σXY = x y (x − µX )(y − µY )p(x, y) = E [(X − µX )(Y − µY )] . It is easily checked that an equivalent formula for computing the covariance is: σXY = E(XY ) − E(X)E(Y ). For the example of p(x, y) considered above, we find: µX = µY = .2, E(XY ) = .1, σXY = .06 . Does this indicate a strong relationship between X and Y? What kind of relationship? How can we tell whether a particular value for σXY is meaningfully large or not? We’ll return to these questions below, but for now let us explore some other aspects of covariance. Independence of X and Y implies Covariance = 0. This important fact is seen (for the discrete case) as follows. If X and Y are independent, then their joint distribution factors into the product of marginals. Using this, we have σXY = x y (x − µX )(y − µY )p(x, y) = x y (x − µX )(y − µY )pX(x)pY (y) = x (x − µX )pX(x) y (y − µY )pY (y) = [µX − µX ][µY − µY ] = 0 · 0 = 0 . Of course, we should want any reasonable measure of dependence to reduce to the value 0 in the case of an absence of dependence. 2 2
  • 3. For some measures of dependence which have been proposed in the literature, the converse holds as well: if the measure has value 0, then the variables are independent. However, for the covariance measure, this converse is not true. EXAMPLE. Consider the joint probability distribution Y −1 0 1 0 0 1/3 0 X 1 1/3 0 1/3 Note that for this distribution we have a very strong relationship between X and Y : ignoring pairs (x, y) with 0 probability, we have X = Y 2 . On the other hand, σXY = E(XY ) − E(X)E(Y ) = E(Y 3 ) − E(X) · 0 = E(Y 3 ) = 0. Thus the covariance measure fails to detect the dependence structure. 2 Preliminary Conclusions about Covariance: a) Independence of X and Y implies σXY = 0; b) σXY = 0 does not necessarily indicate independence; c) σXY = 0 indicates some kind of dependence is present (what kind?). In order to be able to interpret the meaning of a nonzero covariance value, we ask How big can σXY be in value? It turns out that the covariance always lies between two limits which may be ex- pressed in terms of the variances of X and Y : −σX σY ≤ σXY ≤ +σX σY . (This follows from the Cauchy-Schwarz inequality: for any two r.v.’s W and Z, |E(WZ)| ≤ [E(W2 )]1/2 [E(Z2 )]1/2 , with equality if and only if W and Z are propor- tional.) Moreover, the covariance can attain one of these limits only in the case that X − µX and Y − µY are proportional: i.e., for some constant c, X − µX = c(Y − µY ) , i.e., Y = 1 c X + (µY − µX c ) , i.e., X and Y satisfy a linear relationship, Y = aX + b for some choice of a and b. 3
  • 4. Interpretation of covariance. The above considerations lead to an interpretation of covariance: σXY measures the degree of linear relationship between X and Y . (This is why σXY = 0 for the example in which X = Y 2 with X symmetric about 0. This is a purely quadratic relationship, quite nonlinear.) 2 Thus we see that covariance measures a particular kind of dependence, the de- gree of linear relationship. We can assess the strength of a covariance measure by comparing its magnitude with the largest possible value, σX σY . If σXY attains this magnitude, then the variables X and Y have a purely linear relationship. If σXY = 0, however, then either the relationship between X and Y can be assumed to be of some nonlinear type, or else the variables are independent. If σXY lies between these values in magnitude, then we conclude that X and Y have a relationship which is a mixture of linear and other components. A somewhat undesirable aspect of the covariance measure is that its value changes if we transform the variables involved to other units. For example, if the variables are X and Y and we transform to new variables X∗ = cX, Y ∗ = dY, note that Cov(X∗ , Y ∗ ) = E [(X∗ − E(X∗ ))(Y ∗ − E(Y ∗ ))] = E [c(X − E(X))d(Y − E(Y ))] = cd Cov(X, Y ) . Thus, counter to our intuition that dependence relationships should not be altered by simply rescaling the variables, the covariance measure indeed is affected. It is preferable to have a dependence measure which is not sensitive to irrelevant details such as units of measurement. Next we see how to convert to an equivalent measure which is “dimensionless” in this sense. Correlation Recall that the upper and lower limits for the possible values which the covariance can take are given in terms of the variances, which also change with rescaling of variables. Consequently, in order to decide whether a particular value for the co- variance is “big” or ”small,” we need to assess it relative to the variances of the two variables. One way to do this is to divide the covariance by the product of the standard deviations of the variables, producing the quantity ρXY = E X − µX σX Y − µY σY = Cov(X, Y ) Var(X) Var(Y ) = σXY σX σY , which we call the correlation of X and Y. It is easily seen (check) that this measure does not change when we rescale the variables X and Y to X∗ = cX, Y ∗ = dY 4
  • 5. as considered above. Also, the upper and lower limits we saw for the covariance translate to the following limits for the value of the correlation: −1 ≤ ρXY ≤ 1 . Thus we can judge the strength of the dependence by how close the correlation measure comes to either of its extreme values +1 or −1 (and away from the value 0 that suggests an absence of dependence). However, keep in mind that — like the covariance — the correlation is especially sensitive to a certain kind of dependence, namely linear dependence, and can have a small value (near 0) even when there is strong dependence of other kinds. (We saw in the previous lecture an example when the covariance — and hence the correlation — is 0 even when there is strong dependence, but of a nonlinear kind.) Let us now illustrate the use of the correlation parameter to judge the degree of (linear) dependence in the following probability distribution which we considered above: Y 0 1 0 .7 .1 X 1 .1 .1 We had calculated its covariance to be σXY = .06, but at that time we did not assess how meaningful this value is. Now we do so, by converting to correlation. First finding the variances σ2 X = .16 = σ2 Y , we then compute ρXY = .06 √ .16 √ .16 = .36 , which we might interpret as “moderate” (not close to 0, but not close to 1, either). Moreover, note that a positive value of correlation is obtained in this example, indicating that deviations of X from its mean tend to be associated with deviations of Y from its mean in the same direction. In what cases does correlation attain the value +1? −1? Suppose that Y is related to X exactly as a linear transformation of X: Y = a + bX, for some choice of a, b. Then we have the following analysis: E(XY ) = E[X(a + bX)] = aE(X) + bE(X2 ) and so σXY = E(XY ) − E(X)E(Y ) = [aE(X) + bE(X2 )] − E(X)E(a + bX) = · · · = bσ2 X and thus, finally, ρXY = bσ2 X σXσY = b |b| , 5
  • 6. which we see takes value +1 if b > 0 and value −1 if b < 0. It can be shown, also, that the values +1 and −1 are attainable only in the case of exactly linear relationships. This is the basis for characterizing correlation as a measure of the “degree of linear relationship” between X and Y . Despite this intuitive appeal of the correlation measure, note that it really doesn’t leave us with a precise meaning in the case of a value intermediate between 0 and ±1. intermediate values. 2 Despite any shortcomings the correlation measure may have, it has very wide application. This is based on • its fairly successful intuitive appeal as a measure of dependence, • the central importance of confirming (or disproving) linear relationships, • its application to calculating variances of linear combinations of r.v.’s, • its application in analyzing and interpreting regression models. As a final illustration, let us consider the special case that Y is defined to be just X itself, i.e., Y = X. This is a special case of the linear transformation with a = 0 and b = 1, so we have: ρ = 1, i.e., Corr(X, X) = 1 . Likewise, we can talk of the “covariance of a r.v. X with itself,” and we readily find that it reduces to the variance of X: Cov(X, X) = Var(X) . (To see this immediately, just go back and check the definition of covariance.) 6