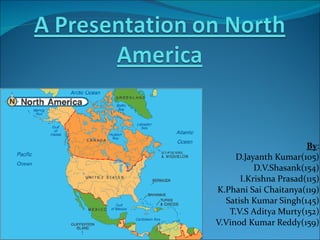
1. By : D.Jayanth Kumar(105) D.V.Shasank(154) I.Krishna Prasad(115) K.Phani Sai Chaitanya(119) Satish Kumar Singh(145) T.V.S Aditya Murty(152) V.Vinod Kumar Reddy(159)
2.
3. Profile of the Region Canada United States Mexico Population 33,749,000 307,167,000 111,211,789 Language English, French English, French Spanish, Mexico GDP Per Capita $ 34,444 $ 41557 $ 10090 Currency Canadian Dollar US Dollar Mexican Peso Government Democratic Democratic Democratic Political Parties Conservative Party, Liberal Party, New Democratic Party Democratic Party, Republican Party Institutional Revolution Party, Party of Democratic Revolution, National Action Party Ethnic Groups British(33%), French(16%), Aboriginal(4%), SEA(9%), Others(6%) White Pop(74%), Latin Pop(14%), African(13.4%), Asian(4.4%)
4.
5.
6.
7.
8.
9. Natural Resources: U.S.A Canada Mexico Agriculture 3% of GDP 2.1% of GDP, 2 nd largest wheat exporter. 9% of GDP and 24% of working population. Industry 29.2% of GDP Manufacturing accounts for 18% of GDP. 18% of GDP, 20% working population. Mining Coal, Iron ore , Nickel Mines, Quarries, Oil wells . Largest exporter of Zinc, Nickel, Uranium and Potassium. Leading producer of Silver, Celestine, Sodium Sulphate, Mercury. Energy State public utility commissions account for 80% of electricity sales. Undeveloped hydroelectric resources. Oil and gas account for 90% of primary energy requirements.
![Overview ,[object Object],[object Object],[object Object],[object Object],[object Object],[object Object],[object Object]](data:image/gif;base64,R0lGODlhAQABAIAAAAAAAP///yH5BAEAAAAALAAAAAABAAEAAAIBRAA7)