Variable transcriptional adaptation between the laboratory (H37Rv) and clinical strains (S7 and S10) ofMycobacteriumtuberculosis under hypoxia

The remarkable success of M. tuberculosis as a pathogen is largely due to its ability to persist within the host for long periods. To develop the effective intervention strategies, understanding the biology of persistence is highly required. Accumulating evidences showed oxygen deprivation (hypoxia) as a potential stimulus for triggering the transition of M. tuberculosis to a non-replicating persistent state analogous to latency in vivo. To date, in vitro hypoxia experimental models used the laboratory adapted isolate H37Rv and very little is known about the behavior of clinical isolates that are involved during disease outbreaks. Hence, we compared the transcription profiles of H37Rv and two south Indian clinical isolates (S7 and S10) under hypoxia to find differences in gene expression pattern.

Recommended
Recommended
More Related Content
What's hot
What's hot (20)
Viewers also liked
Viewers also liked (9)
Similar to Variable transcriptional adaptation between the laboratory (H37Rv) and clinical strains (S7 and S10) ofMycobacteriumtuberculosis under hypoxia
Similar to Variable transcriptional adaptation between the laboratory (H37Rv) and clinical strains (S7 and S10) ofMycobacteriumtuberculosis under hypoxia (20)
Recently uploaded
Recently uploaded (20)
Variable transcriptional adaptation between the laboratory (H37Rv) and clinical strains (S7 and S10) ofMycobacteriumtuberculosis under hypoxia
- 1. Variable transcriptional adaptation between the laboratory (H37Rv) and clinical strains (S7 and S10) of Mycobacterium tuberculosis under hypoxia Santhi Devasundaram, Alamelu Raja ⁎ Department of Immunology, National Institute for Research in Tuberculosis (ICMR) (Formerly Tuberculosis Research Centre), No.1, Mayor Sathiyamoorthy Road, Chetpet, Chennai 600 031, India a b s t r a c ta r t i c l e i n f o Article history: Received 29 August 2015 Received in revised form 12 November 2015 Accepted 7 January 2016 Available online 11 January 2016 Tuberculosis continues to be a major public health problem in many parts of the world, despite intensified efforts taken to control the disease. The remarkable success of M. tuberculosis as a pathogen is largely due to its ability to persist within the host for long periods. To develop the effective intervention strategies, understanding the biol- ogy of persistence is highly required. Accumulating evidences showed oxygen deprivation (hypoxia) as a poten- tial stimulus for triggering the transition of M. tuberculosis to a non-replicating persistent state analogous to latency in vivo. To date, in vitro hypoxia experimental models used the laboratory adapted isolate H37Rv and very little is known about the behavior of clinical isolates that are involved during disease outbreaks. Hence, we compared the transcription profiles of H37Rv and two south Indian clinical isolates (S7 and S10) under hyp- oxia to find differences in gene expression pattern. The main objective of this current work is to find “differential- ly regulated genes” (genes that are down regulated in H37Rv but upregulated in both the clinical isolates) under hypoxia. Microarray results showed, a total of 502 genes were down regulated in H37Rv under hypoxia and 10 out of 502 genes were upregulated in both the clinical isolates. Thus, giving less importance to down regulated genes based on H37Rv model strain might exclude the true representative gene candidates in clinical isolates. Our study suggests the use of most prevalent clinical isolates for in vitro experimental model to minimize the variation in understanding the adaptation mechanisms of the strains. © 2016 Elsevier B.V. All rights reserved. Keywords: Hypoxia Clinical strains Transcriptional adaptation Microarray Real-time PCR 1. Introduction After more than one century, the disease has not yet been eradicated and in 2013 an estimated 9 million people developed tuberculosis (TB) and 1.5 million died from the disease (WHO, 2014). Efforts are to be accelerated to combat TB deaths which are unacceptably high beyond it could be prevented. The success of Mycobacterium tuberculosis (M. tuberculosis) is due to its ability to reside in the host in a non- replicating state called “dormancy”, a condition characterized by low metabolic activity that renders the bacteria resistant to killing by the host immune response and antibiotics (Fattorini et al., 2013). In an attempt to understand this dormant state at the genomic level, studies have been performed to explore the altered metabolism of M. tuberculosis grown under defined conditions to mimic their intracel- lular niche during granuloma formation. Mimicking conditions are thought to reflect the environment inside the granuloma in vitro. This includes hypoxia, starvation, macrophages, and murine infection and each system mimic some of, but not the entire, clinical niche within the host. Of these, hypoxic condition (depletion of oxygen which pre- vents aerobic respiration by the obligate aerobe,) is best studied and considered to be a prime factor for inhibition of M. tuberculosis growth (Rustad et al., 2009; Fang et al., 2012). The most frequently used experimental model for hypoxia-induced M. tuberculosis dormancy is the defined headspace model of non-replicating persistence (NRP) (Wayne and Hayes, 1996) and is adapted for the present study. M. tuberculosis presents a very limited genetic variation. However, high degree of phenotypic variability, differences in clinical outcome and epidemiological behavior among M. tuberculosis isolates are report- ed. Number of studies reported variation in the virulence of different strains of M. tuberculosis (Manabe et al., 2003, Palanisamy et al., 2009, Mehaffy et al., 2010, Sohn et al., 2009). Host and bacterial factors play an important role in this variability (Tsolaki et al., 2005, Reed et al., 2004). H37Rv, the first strain isolated in 1905 (Betts et al., 2000), is the first strain of M. tuberculosis species for which the whole genome se- quence is available (Cole et al., 1998). H37Rv is the widely used labora- tory model strain, but might not represent the actual virulence of naturally occurring strains of TB outbreaks. Thus, it is highly important to study the most prevalent clinical strains of M. tuberculosis to elucidate the real mechanism of virulence as well to test the vaccine efficacy. With this goal, we have selected two south India prevalent clinical isolates, S7 and S10 along with H37Rv to study transcriptional changes in the gene level under in vitro hypoxia experimental model. Infection, Genetics and Evolution 40 (2016) 21–28 ⁎ Corresponding author at: National Institute for Research in Tuberculosis (ICMR) (Formerly Tuberculosis Research Centre), No.1, Sathiyamoorthy Road, Chetpet, Chennai 600 031, India. E-mail address: alameluraja@gmail.com (A. Raja). http://dx.doi.org/10.1016/j.meegid.2016.01.007 1567-1348/© 2016 Elsevier B.V. All rights reserved. Contents lists available at ScienceDirect Infection, Genetics and Evolution journal homepage: www.elsevier.com/locate/meegid
- 2. These two south Indian prevalent strains, S7 and S10, were first identified based on restriction fragment length polymorphism (RFLP) of various M. tuberculosis strains isolated from the BCG trial area, Tiruvallur district, south India (Das et al., 1995). Their results showed that most (38–40%) of the isolated clinical isolates of M. tuberculosis from this area harbored IS6110 single copy in their genome. Distinct im- mune responses were observed, in human donors, with the sonicate an- tigens of these two strains. S7 induced Th-2 response and the strain S10 induced potent T-cell proliferation and IFN-γ secretion (Th-1 response) despite having similar IS6110 copy number at the same locus Rajavelu and Das (2005)). These factors attracted us to select S7 and S10 clinical isolates to study gene regulation mechanism under depleted oxygen condition. Evaluating the transcriptional response of M. tuberculosis under different stress conditions has been the subject of intensive research and this will likely lead to improve drug and vaccine design (Talaat et al., 2004). Vaccine based studies are majorly targeted on the genes or proteins that are upregulated (over-expressed) during in vitro stress conditions (Kim et al., 2008, Aagaard et al., 2011) or within the host or during in vitro infection of human cell lines like macrophages (Triccas and Gicquel, 2000). In particular, these reports were based on laboratory adapted strains such as H37Rv or Erdman strains as a model organism. Genes that are down regulated (repressed) in these strains during in vitro stress experiments are often given less importance for the TB vaccine or drug development. But, expression levels of those down regulated genes in clinical strains are highly un- known under given stress conditions. Thus, we analyzed the expression levels of down regulated genes from H37Rv under hypoxia in clinical isolates to highlight the need of studying more prevalent clinical isolates for in vitro experiments to gain insight into the best vaccine can- didates. This approach would minimize the exclusion of probable true representative genes and would help to reduce variations in vaccine formulations. Our earlier microarray data included only 134 upregulated genes that were common between all 3 strains used under hypoxia. The DosR–DosS, the two components regulatory system plays a pivotal role in mediating the adaptive response to hypoxia. Overexpression of some of the DosR regulon genes like 3128c, Rv1997, Rv2004c, Rv2005c, Rv2007c, Rv3127c and dosS genes like Rv3132c and Rv2025c indicated that the oxygen depletion was faithfully achieved in our culture methods (Devasundaram et al., 2015). In addition to this, the microarray data were also analyzed for “differentially regulated genes” that is genes that were down regulated in H37Rv laboratory strain, but upregulated in both clinical isolates under hypoxia is presented here and the term “differentially regulated genes” is used elsewhere in the text to represent genes down regulated in H37Rv but upregulated in both clinical isolates. 2. Methods 2.1. Aerobic and anaerobic culture methods Stocks of the M. tuberculosis laboratory strain H37Rv (ATCC 27294), obtained from Colorado State university, USA and clinical strains S7 and S10 were obtained during the Model Dots study conducted at the BGC trial area of Tiruvallur District (Das et al., 1995). H37Rv, clinical isolates S7 and S10 were grown in Middlebrook 7H9 media supplemented with 2% (v/v) glycerol, 10% albumin–dextrose–catalase (ADC) and 0.05% (v/v) Tween 80 at 37 °C, 200 rpm for 25 to 30 days to obtain aerobic cultures. To obtain anaerobic cultures (NRP-2) Wayne's method was followed as described (Wayne and Hayes, 1996). Briefly, a laboratory strain H37Rv and clinical isolates S7 and S10 were inoculated in screw capped test tubes (20 × 125 mm, with a total fluid capacity of 25.5 ml) containing supplemented Middlebrook 7H9 (MB7H9). For uniform dispersion of cultures and to control the rate of O2 depletion stirring was done with 8-mm Teflon-coated magnetic stirring bars in the tubes (120 rpm) and incubated at 37 °C. Oxygen depletion in the cultures was assessed by adding a sterile solution of methylene blue in the medium at final dye concentrations of 1.5 μg ml−1 . Reduction and decolorization of this dye served as a visual indication of oxygen depletion. Methylene blue decolorization starts, in M. tuberculosis in vitro cultures, when the dissolved oxygen concentration is below 3% (Leistikow et al., 2010). The cells were pelleted from triplicate cultures, by centrifugation at 2000 g for 5 min and frozen on dry ice. 2.2. Isolation of RNA from aerobic and anaerobic cultures of H37Rv, S7 and S10 Cell pellets (107 bacterial cells) were suspended in 1 ml TRIzol re- agent (Sigma Aldrich, USA) and transferred to 2-ml screw cap tubes containing 0.5 ml of 0.1 mm diameter zirconia/silica beads (BioSpec Products, USA). Three 30-s pulses in a bead beater disrupted the cells. Cell debris was separated by centrifugation for 1 min at 16,000 g. The supernatant was transferred to 2-ml micro centrifuge tube containing 300 μl chloroform: isoamyl alcohol (24:1), inverted rapidly for 15 s, and incubated 2 min at room temperature. Samples were centrifuged for 5 min and the aqueous phase was precipitated using 2.5 volume of isopropanol and 1/10th volume of 3 M sodium acetate. Samples were incubated 10 min at room temperature and centrifuged for 15 min at 4 °C. The RNA pellets were washed with 1 ml 75% ethanol, centrifuged 5 min, air dried and resuspended with RNase free water. Final purification of RNA and DNase treatment to remove residual DNA was carried out by RNeasy columns (Qiagen,USA). RNA quality was assessed by measuring the ratio of absorbance of total RNA at 260/280 and 260/230 nm. 2.3. cDNA synthesis, cRNA labeling and microarray hybridization For cDNA synthesis, 2 μg of RNA from each sample was incubated with WT (Whole Transcript) primers according to manufacturer in- struction (Low Input Quick Amp Labeling WT kit, Agilent Technologies, USA) for 10 min at 65 °C, cooled on ice, combined with 5X standard buff- er, 0.1 M dithiothreitol (DTT), 10 mM deoxynucleotide triphosphate (dNTP) and RNase block mix to the final volume of 4.7 μl. This mixture was incubated for 2 h at 40 °C. Fluorescently labeled cRNA, transcribed from cDNA, by T7 polymer- ase transcription master mix (Low Input Quick Amp Labeling WT kit, Agilent Technologies, USA) containing 5× transcription buffer, 0.1 M DTT, nucleotide triphosphate (NTP), T7 polymerase and labeled with Cy3-CTP (aerobic cultures of H37Rv, S7, S10) or Cy5-CTP (anaerobic cul- tures of H37Rv, S7, S10) and incubated for 2 h at 40 °C. Purification of cRNAs was carried by Qiagen's RNeasy mini kit. An aliquot of 1 μl of purified cRNA was used to determine the yield and specific activity with a Nanodrop ND-1000 UV–Vis Spectrophotomer. The specific activ- ity (pmol Cy3 or Cy5 per μg cRNA) was obtained by following calcula- tion: specific activity = (concentration of Cy3/Cy5)/((concentration of cRNA) ∗ 1000) = pmol Cy3/Cy5 per μg cRNA. Samples with yield of b0.825 μg and specific activity i.e. b15 pmol Cy3/Cy5 per μg cRNA were only selected for competitive hybridization. Labeled cRNA was also checked on 1% agarose gel and scanned using the Typhoon 9210 scanner (GE Life Sciences). A 60mer oligonucleotide based custom array chip was used from Agilent Technologies in 8x15K format. 300 ng of Cy5 labeled cRNA from anaerobic cultures of H37Rv, S7 and S10 was hybridized against 300 ng Cy3 labeled cRNA from aerobic cultures of H37Rv, S7 and S10. Hybridization was done for 17 h, 10 rpm at 65 °C. Following image analysis, feature extraction was performed using Feature extraction tool version 9.5.3.1 (Agilent Technologies, USA). 22 S. Devasundaram, A. Raja / Infection, Genetics and Evolution 40 (2016) 21–28
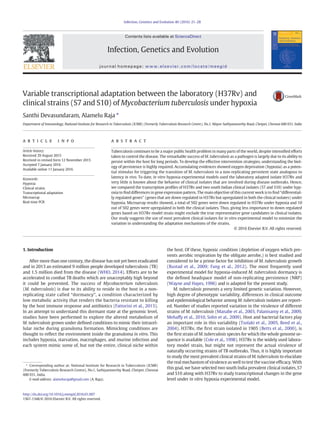
- 3. 2.4. Microarray data analysis Microarray data analysis was performed by R-Bioconductor LIMMA package. The background-corrected raw intensity values were used for analysis. LOWESS algorithm was used to normalize the data and fold change (Fc) was calculated based on the ratio of Cy5/Cy3 (anaerobic/ aerobic) intensities. For statistical analysis, Student's t-test against zero was performed using Benjamini Hochberg multiple testing correc- tion. Hierarchical cluster was done by Mev4.1 using Pearson correlation method. The data were clustered by averaged linkage. Adjusted p value cut-off of 0.05 and fold change of ≥1.5 was used for identifying differen- tially regulated genes. Gene expression data are deposited into the GEO database (GEO accession no: GSE55863). 2.5. Quantitative real-time reverse transcription RT-PCR (qRT-PCR) and normalization A 2 μg of the isolated total RNA from H37Rv, S7 and S10 grown under aerobic and anaerobic culture conditions were reverse-tran- scribed by a genetically engineered, highly thermostable version of Moloney Murine Leukemia Virus Reverse Transcriptase (MMLV-RT), supplied with High Capacity cDNA synthesis kit (Applied Biosystems, USA). For qRT-PCR 20 ng of synthesized cDNA was taken per 20 μl reac- tions. qRT-PCRs were performed in triplicate using a Dynamo™ SYBRgreen 2× mix kit (Finnzymes, Finland). PCR conditions: initial de- naturation 95 °C for 15 min, 40 cycles of 95 °C (30 s), 60 °C (30 s), and 72 °C (1 min). Real-time PCR quantitations were performed in ABI Prism 7000 sequence detection system and analyzed with SDS 2.1 soft- ware (Applied Biosystems, USA). For each RNA sample, the control transcript (16 s rRNA) and target RNAs were reverse-transcribed together in one reaction and the resulting cDNAs were quantified by real-time PCR. The target cDNA was normalized internally to the cDNA levels of 16 s rRNA in the same sample and expressed as (target mRNA)/(16 s rRNA mRNA). 3. Results 3.1. Growth pattern and culture conditions Oxygen sufficient (aerobic) cultures are depicted as “Rv” for H37Rv, “S7” and “S10” for clinical isolates in the text. Oxygen depleted (anaer- obic) cultures are denoted as “RvD”, “S7D” and “S10D” for H37Rv, S7 and S10 strains respectively and “D” indicates dormancy. The growth rate was higher in aerobic cultures where bacilli entered into log phase on day 9 and growth was stabilized on day 18 (considered as a stationary phase entry). But in anaerobic cultures stationary phase were reached on or after day 14 but log phase was attained at day 9 sim- ilar to aerobic cultures. There were no significant differences found in growth pattern between these 3 strains (Fig.1a). Many researchers followed methylene blue decolorization as a sole indicator to confirm oxygen depletion during in vitro dormancy experiment; hence the same was followed in our study (Fang et al., 2013; Rex et al., 2013; Sohaskey, 2008). Gradual decolorization of methylene blue was ob- served, with all 3 strains, during the incubation at 120 rpm, 37 °C and complete decolorization was observed by day 25. No decolorization of methylene blue dye in the “blank” tube was observed, as no inoculum was introduced and it remained in the same color till 25 to 30 days (Supplementary Fig. 1) (Devasundaram et al., 2015). Growth kinetics and methylene blue decolorization pattern were in agreement with the in vitro Wayne's model (Wayne and Hayes, 1996). After methylene blue decolorization, pellets were collected from triplicate cultures of H37Rv, S7 and S10 for RNA isolation. The isolated RNA, which showed the ratio of ≥2 at A260/280 showed no DNA contam- ination and was only included for microarray and qRT-PCR experiments. Further, the integrity of RNA was also determined on a MOPS- formaldehyde denaturing agarose gel (data not given). 3.2. Genes that are repressed in H37Rv but expressed in clinical strains S7 and S10 To identify the “differentially regulated genes”, a threshold value of 1.5 fold change was assigned for each gene rather than the individual expression values. Based on the mean expression value of triplicate mi- croarray experiments, about 502 genes were repressed in H37Rv, 453 and 1463 genes were upregulated in S7 and S10 respectively under hyp- oxia when compared to aerobic growth (GEO accession no: GSE55863). This was represented by the Venn diagram in Fig 1b. To identify “differentially regulated genes”, the expression levels of these 502 repressed genes of H37Rv were compared with S7 and S10 over-expressed genes. A total of 10 genes was found in common as over-expressed in both the clinical isolates but repressed in H37Rv under hypoxia. These sets of genes were termed as “differentially regulated genes” and followed throughout the text. These are Rv0812, Rv1463, Rv1544, Rv1582c, Rv1601, Rv2035, Rv2045c, Rv2430c, Rv2483c and Rv3538, their fold expression cluster is given Fig 2 Table.1. These genes are predicted to be involved in intermediary metabolism (Rv0812, Rv1544 and Rv2483c), energy metabolism (Rv1544), cell envelope synthesis (Rv2483c), fatty acid synthesis Fig. 1. Growth curves and Venn diagram of altered transcriptional pattern for M. tuberculosis H37Rv, S7 and S10 under aerobic and anaerobic cultures. a) Aerobic and anaerobic cultures of all three strains were obtained by growing at 37 °C at 200 rpm and 120 rpm respectively. Mean optical density (OD) values with standard error at 600 nm are shown. The OD values were similar between H37Rv and S10 whereas S7 strain had less OD value, but the pattern of growth was same for all 3 strains. Growth is expressed as log of turbidity (A600). b) Graphical representation by Venn diagram of the overlap of “differentially regulated genes” identified between H37Rv and in both the clinical isolates S7 and S10 under hypoxia. Total of 502 down regulated genes predicted by microarray in H37Rv was compared with upregulated genes of S7 and S10. The aerobic cultures of 3 strains were denoted as Rv (H37Rv), S7 and S10 and for anaerobic cultures it was denoted as RvD (H37Rv), S7D (for S7) and S10D (for S10). 23S. Devasundaram, A. Raja / Infection, Genetics and Evolution 40 (2016) 21–28
- 4. (Rv2045c), amino acid biosynthesis (Rv0812, Rv1601), co-factor syn- thesis (Rv1463) and hypothetical protein (Rv2035). The comparison of 502 repressed genes from H37Rv with any one of the clinical isolates led to the prediction of 8 genes (Rv1421, Rv1830, Rv2501c, Rv2764, Rv3275c, Rv3283, Rv3556c and Rv3843c) that are expressed in S7 clinical strain and repressed in H37Rv under hypoxia (RvD vs S7D) (Fig 3, Supplementary Table 1). Interestingly, 128 genes were predicted as repressed in H37Rv but expressed in S10 under hypoxia (RvD vs S10D) (Fig.4. and Supplementary Table 2). 3.3. Real-time PCR The expression levels of 10 “differentially regulated genes” predicted by microarray as down regulated in H37Rv and upregulated in both the clinical isolates were also verified by qRT-PCR. Triplicate qRT-PCR reac- tion was carried out with 10 genes specific primers in triplicates for all 3 strains in both aerobic and aerobic growth conditions. qRT-PCR results showed that these 10 genes were repressed in H37Rv but their expres- sion was observed in both the clinical isolates (Fig. 5) in agreement to microarray results. qRT-PCR data is presented as fold difference of expression in all three strains relative to their control cultures i.e. aero- bic cultures. Gene specific primer sequences are given in the Table.2. The expression of a mycobacterial ribosomal protein coding gene (16srRNA), MTB000019, was shown to be consistent throughout differ- ent phases of M. tuberculosis growth in vitro (Banaiee et al., 2006). Thus, 16srRNA was taken as the normalizing internal control gene for all samples. Fold changes were calculated by taking average CT (threshold cycle) values from triplicate qRT-PCR reaction. The predicted fold change for the gene Rv0812 in H37Rv was higher (−4.46) than the values obtain- ed by the microarray (−0.28). The expression values predicted by qRT- PCR for other genes did not vary significantly from the microarray re- sults. Collectively, expression analysis of these 10 genes by qRT-PCR also confirms that they are differentially regulated between H37Rv and in clinical isolates S7 and S10. 4. Discussion Despite the different environment (acidic environment, low oxygen, and nutritional deficiency) within the host, M. tuberculosis has the ability to infect and persist for longer periods without causing active TB disease (Fontan et al., 2008). This non-symptomatic infection state is known as latent TB and represents the future reservoir for active TB disease (Kasprowicz et al., 2011). Adaptation to hypoxia environment is a critical part of the ability of M. tuberculosis to persist within the host (Muttucumaru et al., 2004). Table 1 Genes that are repressed in H37Rv but expressed in both clinical isolates under hypoxia. S. No Rv No Gene name Fold change in H37Rv Fold change in S7 Fold change in S10 Predicted function 1 Rv1463 −0.25 −1.02 3.63 3.50 2.48 2.28 Probable conserved ATP-binding protein ABC transporter 2 Rv1601 −0.27 −1.46 2.05 2.12 3.40 2.81 Probable imidazole glycerol-phosphate dehydratase HisB 3 Rv0812 pabC −0.28 −4.46 1.68 2.45 2.85 2.95 Probable amino acid aminotransferase 4 Rv1544 −0.21 −1.18 1.59 1.25 2.10 1.2 Possible ketoacyl reductase 5 Rv1582c −0.35 −1.04 1.67 1.57 2.30 1.97 Probable PhiRv1 phage protein 6 Rv2483c plsC −0.16 −1.22 1.61 1.60 2.28 1.78 Possible transmembrane phospholipid biosynthesis bifunctional enzyme PlsC 7 Rv2035 −0.43 −0.99 2.18 1.49 1.86 1.14 Conserved hypothetical protein 8 Rv2430c PPE41 −0.37 −0.91 2.15 2.76 1.54 3.04 PPE family protein PPE41 9 Rv2045c lipT −0.29 −1.56 1.59 1.47 1.55 2.61 Carboxylesterase LipT 10 Rv3538 hsd4B −0.50 −0.80 1.64 1.77 1.67 1.14 Possible 2-enoyl acyl-CoA hydratase Microarray experiments, from 3 mycobacterial strains (H37Rv, S7 and S10) which were grown under hypoxia, predicted 10 genes with differential expression between H37Rv laboratory strain and 2 clinical isolates S7 and S10. These set of genes were predicted to be down regulated in H37Rv strain but upregulated in both the clinical isolates under hypoxia. Average gene expression levels from triplicate cultures from both microarray (numbers in bold) and qRT-PCR, are given in this table. qRT-PCR results were also in agreement with microarray results. Fig. 2. Heat map describing the differences in the transcriptional signature between H37Rv and clinical isolates S7 and S10 under hypoxia. Hierarchical clustering of “differentially regulated genes” that is, genes repressed in H37Rv and expressed in both the clinical isolates S7 and S10 under hypoxia is given based on triplicate microarray experiments. Anaerobic cultures of H37Rv, S7 and S10 are depicted as RvD, S7D and S10D respectively in the given image and triplicates are denoted as 1, 2 and 3. Expression ratios were log 2-transformed, and displayed according to the color code at the top of the figure. Each row is labeled with their corresponding gene names. Green bars represents down regulated genes and red represents upregulated genes. 24 S. Devasundaram, A. Raja / Infection, Genetics and Evolution 40 (2016) 21–28
- 5. Adaptation of M. tuberculosis to varying environmental conditions during the course of infection is likely mediated by differential gene expression (Timm et al., 2003). Many researchers followed micro- array and RT-PCR to analyze the transcriptional response of M. tuberculosis during in vitro dormancy experimental models that mimic the conditions encountered by the bacteria within the host (Geiman et al., 2006; Rehren et al., 2007; Voskuil et al., 2011; Wei et al., 2013). It is also predicted that genes/proteins that are over- expressed in M. tuberculosis during in vitro stress are likely to be impor- tant for intracellular survival and can be targeted for drug and vaccine development (Betts, 2002; Kendall et al., 2004). The majority of the in vitro hypoxia experiments used the laboratory strain H37Rv (Fisher et al., 2002, Bacon et al., 2004, Boshoff and Barry 2005, Gengenbacher et al., 2010) and over-expressed genes during hyp- oxia are considered as potential drug and vaccine targets (Talaat et al., 2004). Often, less importance is given for the down regulated genes (predicted from H37Rv) despite the lack of information on their expres- sion levels in clinical strains under the similar stimuli. The unique feature of our work is, we used 2 prevalent clinical isolates (S7 and S10) from TB endemic regions like India and showed 10 genes that were predicted as down regulated in H37Rv during hypoxia are actually over-expressed in both clinical strains under similar stimuli (hypoxia). This highlights the need of using the most prevalent clinical strains of M. tuberculosis during in vitro stress experiments. The expression of hypoxia associated genes like DosS-DosR regulon genes demonstrate the faithful achievement of our in vitro hypoxia ex- periments. We have already reported the microarray analysis of 134 over-expressed genes that are common in all 3 strains (H37Rv, S7 and S10) during hypoxia (Devasundaram et al., 2015). The current analysis focuses mainly on the set of genes that are predicted as down regulated in the laboratory strain H37Rv but over-expressed in clinical isolates (S7 and S10). Fig. 3. Heat map describing the differences in the transcriptional signature only between H37Rv and S7 under hypoxia. Hypoxia related genes that are repressed in H37Rv and expressed only in S7 clinical isolate (H37Rv anaerobic vs S7 anaerobic) under hypoxia is given. Anaerobic cultures of H37Rv, S7 are depicted as RvD and S7D respectively in the given image. These results are based on triplicate microarray experiments with 1.5 fold change. Green bars represent down regulated genes and red represents upregulated genes and their corresponding values are given above the cluster image. Rows are labeled with gene names. Fig. 4. Heat map describing the differences in the transcriptional signature only between H37Rv and S10 under hypoxia. Hypoxia repressed genes in H37Rv and expressed only in S10 clinical isolate (H37Rv anaerobic vs S10 anaerobic) under hypoxia are given. Anaerobic cultures of H37Rv and S10 are depicted as RvD and S10D respectively in the given image. These results are based on triplicate microarray experiments with 1.5 fold change. Green bars represent down regulated genes and red represents upregulated genes and their corresponding values are given above the cluster image. Rows are labeled with gene names. 25S. Devasundaram, A. Raja / Infection, Genetics and Evolution 40 (2016) 21–28
- 6. Dormancy associated genes of M. tuberculosis might serve as poten- tial immunogens that can be targeted for vaccine development (Andersen, 2007). Evidently, 2 genes (Rv2660, Rv2659) that were pre- dicted to be expressed by microarray during in vitro non-replicating persistence model induced higher CD4+ T-cell response in human donors (Govender et al., 2010). Expression of all resuscitation- promoting factors (rpf) genes from M. tuberculosis during various in vitro stress experiments were shown by RT-PCR (Gupta et al., 2010). Later, the strong cellular immune response in human donors was identified against all rpf genes and proposed as potential vaccine targets (Commandeur et al., 2011). Collectively, these reports support the transcriptional analysis by microarray and RT-PCR is also a potential tool to identify novel drug and vaccine targets. We followed the same technique for transcriptional analysis specifically in clinical isolates; hence genes that are predicted from our results would be beneficial for anti-TB vaccine development. Phage particles help M. tuberculosis to adapt to environmental fluc- tuations and predicted to be involved in bacterial virulence. Out of 10 genes that are reported as down regulated in H37Rv but over- expressed in both the clinical isolates, Rv1582c is a probable PhiRv1 phage protein. Rv1582 is present in RD3 region of M. tuberculosis but ab- sent in BCG (Brosch et al., 2002). A recent report explicitly analyzed most of the available gene expression data on mycobacterial phage proteins under various stresses like, nutrient starvation, macrophage infection and oxygen depletion. Almost the majority of the phage genes were reported during various stress experiments except Rv1582c (Fan et al., 2015). Notably, these studies used the laboratory strain H37Rv for their in vitro experiments. This indicates that in vitro results based on the laboratory strains might exclude the probable rep- resentative genes involved in clinical isolates during adaptation mecha- nism. We have also carried an independent microarray analysis (data not shown) on genes that are expressed only in S7 and S10 (unique genes) during hypoxia. This showed the phage protein Rv1576c and Rv2653c was expressed in S7 and S10 respectively during hypoxia. Sur- prisingly, these phage genes were also not reported by any of the stress experiments analyzed by Fan et al., (2015). This further supports our hypothesis that transcription variations exhibited between the strains hence the use of clinical isolates would minimize these variations. With agreement to our results, Rv1463 (ABC transporter ATP- binding protein) was down regulated under hypoxia in H37Rv (Sherman et al., 2001). But, our microarray analysis showed the over- expression of Rv1463 in both the clinical isolates (S7 and S10) which were also confirmed by RT-PCR. Collectively, these observations alarm the variations existing between the laboratory and clinical strains of M. tuberculosis. Hence, for a specialized study like anti-TB drug/vaccine development, inclusion of clinical isolates would bring more specific gene targets when compared to the laboratory strain. Non-homologous proteins (unrelated to human proteins) are majorly targeted for the drug development against infectious disease. The probable amino acid aminotransferase, Rv0812 was predicted to be a unique enzyme in M. tuberculosis by protein interaction network analysis (Kushwaha and Shakya, 2010). Rv0812 expression was also ob- served during lung infection by M. tuberculosis in mice (Dubnau et al., 2005). Our results bring the first insight on Rv0812 expression under hypoxia especially in clinical isolates of M. tuberculosis and marking this gene as a potential drug/vaccine target. Proline–glutamic acid/proline–proline–glutamic acid (PE/PPE) pro- teins are exclusively present in pathogenic mycobacteria and constitute 10% coding regions of M. tuberculosis genome. PE/PPE proteins role in mycobacterial virulence is yet to be determined (Kunnath-Velayudhan and Porcelli, 2013). PE/PPE proteins are closely associated with ESAT-6 (esx) and modulate host immune response (Sampson, 2011). A strong B cell response by PPE41 (Rv2430c) was observed in TB patients (Choudhary et al., 2003) but its expression under hypoxia in clinical iso- lates of M. tuberculosis were first reported by our results. To our knowl- edge, we also bring the first insight on expression of another PE/PPE family of gene Rv3538, a double hotdog enzyme, under hypoxia in clin- ical isolates of M. tuberculosis. The data presented here show the existence of variations between laboratory and clinical strains of M. tuberculosis in terms of gene expres- sion under hypoxia. An understanding of this variation opens the path to identify a set of genes which have altered expressions (that is, down regulated in H37Rv but over-expressed in clinical isolates). Gene expression analysis in other clinically relevant M. tuberculosis Fig 5. QRT-PCR validation of microarray results for genes repressed in H37Rv and expressed in S7 and S10. Quantitative RT-PCR was used to confirm the “differentially regulated genes” that are predicted by microarray result. Expression of these genes under anaerobic cultures (RvD, S7D and S10D) was compared to their respective aerobic cultures (Rv, S7 and S10). Genes that were repressed in H37Rv were upregulated in clinical isolates under hypoxia. Data are mean with SEM calculated from three independent biological samples analyzed. Table 2 Primers used in real-time RT-PCR with SYBR green probes. S. No Rv number Primer name Sequence 5′ - 3′ Template size 1 Rv1463 Rv1463-F agaactgctcaagcccaaga 174 RV1463-R cgtattccgggtggatgtag 2 Rc1601 Rv1601-F tgttccgttctacgaccaca 169 Rv1601-R gatgcccctcttgtcaccta 3 Rv0812 Rv0812-F ttttvgagavavtgvtggtg 200 Rv0812-R accgcgactgtagatcaagc 4 Rv1544 Rv1544-F agtcgtcctcaatgctctgg 151 Rv1544-R ggctttggtagccgaataca 5 Rv1582c Rv1582c-F ggagcgactatacagcgaatc 201 Rv1582c-R agatttcgggtacgccttct 6 Rv2483c Rv2483c-F tgaccgacctggaagaaatc 200 Rv2483c-R ctcgaacttgttggtgagca 7 Rv2035 Rv2035-F atctggccaagaccagtgag 172 Rv2035-R tcggtatagcggcgtaggta 8 Rv2045c Rv2045c-F acgaaccgatggttgaagag 129 Rv2045c-R agctaaaggcgaagtcacca 9 Rv2430c Rv2430c-F gtccagtggtgatgcagttg 132 Rv2430c-R cgtgatgtgcccattcatag 10 Rv3538 Rv3538-F acctatgggatgacctgcaa 136 Rv3538-R cgtccttccacacgttgac 11 16srRNA 16srRNA-F cagctcgtgtcgtgagatgt 148 16srRNA-R aaggggcatgatgacttgac Primers sequences, specific for 10 differentially expressed genes (down regulated in H37Rv strain but upregulated in both the clinical isolates S7 and S10 under hypoxia), used for qPCR experiment to validate microarray results is given here. Primers name with F indicate forward primer and with R denote reverse primer. 16srRNA was used as normalizing control. 26 S. Devasundaram, A. Raja / Infection, Genetics and Evolution 40 (2016) 21–28
- 7. strains during in vitro stress experiments could bring highly relevant representative genes that can be targeted for the design of anti- tuberculosis drugs and vaccine. Ethical Statement/Conflict of Interest Statement The author declares no conflict of interest Acknowledgments We thank the Indian Council of Medical Research for the Senior Research Fellowship awarded to Santhi Devasundaram. We also acknowledge Prof. Paturu Kondaiah, MRDG Department, IISc, Bangalore for providing microarray and qPCR facility to carry this work and for helpful discussions. We would also like to thank Imran Khan and Neeraj Kumar for their help during microarray and RT-PCR experiments. Appendix A. Supplementary data Supplementary data to this article can be found online at http://dx. doi.org/10.1016/j.meegid.2016.01.007. References Aagaard, C., Hoang, T., Dietrich, J., Cardona, P.J., Izzo, A., Dolganov, G., Schoolnik, G.K., Cassidy, J.P., Billeskov, R., Andersen, P., 2011. A multistage tuberculosis vaccine that confers efficient protection pre- and post-exposure. Nat. Med. 17, 189–194. Andersen, P., 2007. Vaccine strategies against latent tuberculosis infection. Trends Microbiol. 15 (1), 7–13. Bacon, J., James, B.W., Wernisch, L., Williams, A., Morley, K.A., et al., 2004. The influence of reduced oxygen availability on pathogenicity and gene expression in Mycobacterium tuberculosis. Tuberculosis (Edinb) 84, 205–217. Banaiee, N., Jacobs Jr., W.R., Ernst, J.D., 2006. Regulation of Mycobacterium tuberculosis whiB3 in the mouse lung and macrophages. Infect. Immun. 74 (11), 6449–6457. Betts, J.C., 2002. Transcriptomics and proteomics: tools for the identification of novel drug targets and vaccine candidates for tuberculosis. IUBMB life 53 (4–5), 239–242. Betts, J.C., Dodson, P., Quan, S., Lewis, A.P., Thomas, P.J., et al., 2000. Comparison of the proteome of Mycobacterium tuberculosis strain H37Rv with clinical isolate CDC 1551. Microbiology 146 (Pt 12), 3205–3216. Boshoff, H.I., Barry 3rd, C.E., 2005. Tuberculosis — metabolism and respiration in the absence of growth. Nat. Rev. Microbiol. 3, 70–80. Brosch, R., Gordon, S.V., Marmiesse, M., Brodin, P., Buchrieser, C., Eiglmeier, K., Garnier, T., Gutierrez, C., Hewinson, G., Kremer, K., Parsons, L.M., Pym, A.S., Samper, S., van Soolingen, D., Cole, S.T., 2002. A new evolutionary scenario for the Mycobacterium tuberculosis complex. Proc. Natl. Acad. Sci. U. S. A. 99 (6), 3684–3689. Choudhary, R.K., Mukhopadhyay, S., Chakhaiyar, P., Sharma, N., Murthy, K.J., Katoch, V.M., Hasnain, S.E., 2003. PPE antigen Rv2430c of Mycobacterium tuberculosis induces a strong B-cell response. Infect. Immun. 71 (11), 6338–6343. Cole, S.T., Brosch, R., Parkhill, J., Garnier, T., Churcher, C., Harris, D., Gordon, S.V., Eiglmeier, K., Gas, S., Barry 3rd, C.E., Tekaia, F., Badcock, K., Basham, D., Brown, D., Chillingworth, T., Connor, R., Davies, R., Devlin, K., Feltwell, T., Gentles, S., Hamlin, N., Holroyd, S., Hornsby, T., Jagels, K., Krogh, A., McLean, J., Moule, S., Murphy, L., Oliver, K., Osborne, J., Quail, M.A., Rajandream, M.A., Rogers, J., Rutter, S., Seeger, K., Skelton, J., Squares, R., Squares, S., Sulston, J.E., Taylor, K., Whitehead, S., Barrell, B.G., 1998. Deciphering the biology of Mycobacterium tuberculosis from the complete genome sequence. Nature 393 (6685), 537–544. Commandeur, S., van Meijgaarden, K.E., Lin, M.Y., Franken, K.L., Friggen, A.H., Drijfhout, J.W., et al., 2011. Identification of human T-cell responses to Mycobacterium tuberculosis resuscitation-promoting factors in long-term latently infected individuals. Clin. Vaccine Immunol. 18 (4), 676–683. Das, S., Paramasivan, C.N., Lowrie, D.B., Prabhakar, R., Narayanan, P.R., 1995. IS6110 re- striction fragment length polymorphism typing of clin-ical isolates of Mycobacterium tuberculosis from patients with pulmonary tuberculosis in Madras, south India. Tuber. Lung Dis. 76, 550–554. Devasundaram, S., Khan, I., Kumar, N., Das, S., Raja, A., 2015. The influence of reduced oxygen availability on gene expression in laboratory (H37Rv) and clinical strains (S7 and S10) of Mycobacterium tuberculosis. J. Biotechnol. 210, 70–80. Dubnau, E., Chan, J., Mohan, V.P., Smith, I., 2005. Responses of Mycobacterium tuberculosis to growth in the mouse lung. Infect. Immun. 73 (6), 3754–3757. http://dx.doi.org/10. 1128/IAI.73.6.3754-3757.2005. Fan, X., Abd Alla, A.A., Xie, J., 2015. Distribution and function of prophage phiRv1 and phiRv2 among Mycobacterium tuberculosis complex. J. Biomol. Struct. Dyn. 1-6. Fang, X., Wallqvist, A., Reifman, J., 2012. Modeling phenotypic metabolic adaptations of Mycobacterium tuberculosis H37Rv under hypoxia. PLoS Comput. Biol. 8, e1002688. Fang, H., Yu, D., Hong, Y., Zhou, X., Li, C., Sun, B., 2013. The LuxR family regulator Rv0195 modulates Mycobacterium tuberculosis dormancy and virulence. Tuberculosis 93 (4), 425–431. Fattorini, L., Piccaro, G., Mustazzolu, A., Giannoni, F., 2013. Targeting dormant bacilli to fight tuberculosis. Mediterranean J. Hematol. Infect. Dis. 5 (1), e2013072. http://dx. doi.org/10.4084/MJHID.2013.072. Fisher, M.A., Plikaytis, B.B., Shinnick, T.M., 2002. Microarray analysis of the Mycobacterium tuberculosis transcriptional response to the acidic conditions found in phagosomes. J. Bacteriol. 184 (14), 4025–4032. Fontan, P., Aris, V., Ghanny, S., Soteropoulos, P., Smith, I., 2008. Global transcriptional pro- file of Mycobacterium tuberculosis during THP-1 human macrophage infection. Infect. Immun. 76 (2), 717–725. Geiman, D.E., Raghunand, T.R., Agarwal, N., Bishai, W.R., 2006. Differential gene expres- sion in response to exposure to antimycobacterial agents and other stress conditions among seven Mycobacterium tuberculosis whiB-like genes. Antimicrob. Agents Chemother. 50 (8), 2836–2841. Gengenbacher, M., Rao, S.P., Pethe, K., Dick, T., 2010. Nutrient-starved, non-replicating Mycobacterium tuberculosis requires respiration, ATP synthase and isocitrate lyase for maintenance of ATP homeostasis and viability. Microbiology 156 (Pt 1), 81–87. Govender, L., Abel, B., Hughes, E.J., Scriba, T.J., Kagina, B.M., de Kock, M., Walzl, G., Black, G., Rosenkrands, I., Hussey, G.D., Mahomed, H., Andersen, P., Hanekom, W.A., 2010. Higher human CD4 T cell response to novel Mycobacterium tuberculosis latency asso- ciated antigens Rv2660 and Rv2659 in latent infection compared with tuberculosis disease. Vaccine 29 (1), 51–57. Gupta, R.K., Srivastava, B.S., Srivastava, R., 2010. Comparative expression analysis of rpf-like genes of Mycobacterium tuberculosis H37Rv under different physiological stress and growth conditions. Microbiology 156 (Pt 9), 2714–2722. Kasprowicz, V.O., Churchyard, G., Lawn, S.D., Squire, S.B., Lalvani, A., 2011. Diagnosing latent tuberculosis in high-risk individuals: rising to the challenge in high-burden areas. J. Infect Dis. 204 (Suppl. 4), S1168–S1178. Kendall, S.L., Rison, S.C., Movahedzadeh, F., Frita, R., Stoker, N.G., 2004. What do microarrays really tell us about M. tuberculosis? Trends Microbiol. 12 (12), 537–544. Kim, S.Y., Lee, B.S., Shin, S.J., Kim, H.J., Park, J.K., 2008. Differentially expressed genes in Mycobacterium tuberculosis H37Rv under mild acidic and hypoxic conditions. J. Med. Microbiol. 57, 1473–1480. Kunnath-Velayudhan, S., Porcelli, S.A., 2013. Recent advances in defining the immuno- proteome of Mycobacterium tuberculosis. Front. Immunol. 4, 335. Kushwaha, S.K., Shakya, M., 2010. Protein interaction network analysis—approach for potential drug target identification in Mycobacterium tuberculosis. J. Theor. Biol. 262 (2), 284–294. Leistikow, R.L., Morton, R.A., Bartek, I.L., Frimpong, I., Wagner, K., Voskuil, M.I., 2010. The Mycobacterium tuberculosis DosR regulon assists in metabolic homeostasis and enables rapid recovery from nonrespiring dormancy. J. Bacteriol. 192 (6), 1662–1670. Manabe, Y.C., Dannenberg Jr., A.M., Tyagi, S.K., Hatem, C.L., Yoder, M., Woolwine, S.C., Zook, B.C., Pitt, M.L., Bishai, W.R., 2003. Different strains of Mycobacterium tuberculosis cause various spectrums of disease in the rabbit model of tuberculosis. Infect. Immun. 71 (10), 6004–6011. Mehaffy, C., Hess, A., Prenni, J.E., Mathema, B., Kreiswirth, B., Dobos, K.M., 2010. Descrip- tive proteomic analysis shows protein variability between closely related clinical isolates of Mycobacterium tuberculosis. Proteomics 10 (10), 1966–1984. Muttucumaru, D.G., Roberts, G., Hinds, J., Stabler, R.A., Parish, T., 2004. Gene expression profile of Mycobacterium tuberculosis in a non-replicating state. Tuberculosis 84 (3–4), 239–246. Palanisamy, G.S., DuTeau, N., Eisenach, K.D., Cave, D.M., Theus, S.A., Kreiswirth, B.N., Basaraba, R.J., Orme, I.M., 2009. Clinical strains of Mycobacterium tuberculosis display a wide range of virulence in guinea pigs. Tuberculosis 89 (3), 203–209. Rajavelu, P., Das, S.D., 2005. Th2-type immune response observed in healthy individuals to sonicate antigen prepared from the most prevalent Mycobacterium tuberculosis strain with single copy of IS6110. FEMS Immunol. Med. Microbiol. 45, 95–102. Reed, M.B., Domenech, P., Manca, C., Su, H., Barczak, A.K., et al., 2004. A glycolipid of hypervirulent tuberculosis strains that inhibits the innate immune response. Nature 431, 84–87. Rehren, G., Walters, S., Fontan, P., Smith, I., Zarraga, A.M., 2007. Differential gene expres- sion between Mycobacterium bovis and Mycobacterium tuberculosis. Tuberculosis 87 (4), 347–359. Rex, K., Kurthkoti, K., Varshney, U., 2013. Hypersensitivity of hypoxia grown Mycobacterium smegmatis to DNA damaging agents: implications of the DNA repair deficiencies in attenuation of mycobacteria. Mech. Ageing Dev. 134 (10), 516–522. Rustad, T.R., Sherrid, A.M., Minch, K.J., Sherman, D.R., 2009. Hypoxia: a window into Mycobacterium tuberculosis latency. Cell. Microbiol. 11, 1151–1159. Sampson, S.L., 2011. Mycobacterial PE/PPE proteins at the host–pathogen interface. Clin. Dev. Immunol. 497203. Sherman, D.R., Voskuil, M., Schnappinger, D., Liao, R., Harrell, M.I., et al., 2001. Regulation of the Mycobacterium tuberculosis hypoxic response gene encoding alpha-crystallin. Proc. Natl. Acad. Sci. U. S. A. 98, 7534–7539. Sohaskey, C.D., 2008. Nitrate enhances the survival of Mycobacterium tuberculosis during inhibition of respiration. J. Bacteriol. 190 (8), 2981–2986. Sohn, H., Lee, K.S., Kim, S.Y., Shin, D.M., Shin, S.J., et al., 2009. Induction of cell death in human macrophages by a highly virulent Korean isolate of Mycobacterium tuberculosis and the virulent strain H37Rv. Scand. J. Immunol. 69, 43–50. Talaat, A.M., Lyons, R., Howard, S.T., Johnston, S.A., 2004. The temporal expression profile of Mycobacterium tuberculosis infection in mice. Proc. Natl. Acad. Sci. U. S. A. 101 (13), 4602–4607. Timm, J., Post, F.A., Bekker, L.G., Walther, G.B., Wainwright, H.C., Manganelli, R., Chan, W.T., Tsenova, L., Gold, B., Smith, I., Kaplan, G., McKinney, J.D., 2003. Differential ex- pression of iron-, carbon-, and oxygen-responsive mycobacterial genes in the lungs of chronically infected mice and tuberculosis patients. Proc. Natl. Acad. Sci. U. S. A. 100 (24), 14321–14326. 27S. Devasundaram, A. Raja / Infection, Genetics and Evolution 40 (2016) 21–28
- 8. Triccas, J.A., Gicquel, B., 2000. Life on the inside: probing Mycobacterium tuberculosis gene expression during infection. Immunol. Cell Biol. 78, 311–317. Tsolaki, A.G., Gagneux, S., Pym, A.S., Goguet de la Salmoniere, Y.O., Kreiswirth, B.N., et al., 2005. Genomic deletions classify the Beijing/W strains as a distinct genetic lineage of Mycobacterium tuberculosis. J. Clin. Microbiol. 43, 3185–3191. Voskuil, M.I., Bartek, I.L., Visconti, K., Schoolnik, G.K., 2011. The response of Mycobacterium tuberculosis to reactive oxygen and nitrogen species. Front. Microbiol. 2, 105. Wayne, L.G., Hayes, L.G., 1996. An in vitro model for sequential study of shiftdown of Mycobacterium tuberculosis through two stages of nonreplicating persistence. Infect. Immun. 64, 2062–2069. Wei, J., Guo, N., Liang, J., Yuan, P., Shi, Q., Tang, X., et al., 2013. DNA microarray gene expression profile of Mycobacterium tuberculosis when exposed to osthole. Polish. J. Microbiol. 62 (1), 23–30. WHO, 2014. http://apps.who.int/iris/bitstream/10665/137094/1/9789241564809_eng. pdf?ua=1. 28 S. Devasundaram, A. Raja / Infection, Genetics and Evolution 40 (2016) 21–28