More Related Content
Similar to FINAL EXAM Poster
Similar to FINAL EXAM Poster (20)
FINAL EXAM Poster
- 1. RESEARCH POSTER PRESENTATION DESIGN © 2012
www.PosterPresentations.com
In my research, I set out to help in the lab’s efforts to prove the
legitimacy of a mouse model for Hepatitis A Virus (HAV). My
specific focus was on the interferon-stimulated gene (ISG)
response in the mouse livers. I predicted that the interferon-
stimulated gene levels would be raised in the model, in a
manner that closely resembles the responses currently
observed in the available human and chimpanzee models
(Lanford et al. 2011). We hope to create a mouse model that will
reliably express the virus in a way that will be helpful and
conductive to research.
Animals are protected from infection by proteins in their bodies
called interferons. These interferons are a central part of the innate
immune system, in charge of beginning a signaling chain that leads
to the activation of genes called interferon-stimulated genes
(ISGs). These genes then produce the correct proteins to help the
host body combat the infection (Schneider et al. 2014). In humans
and chimpanzees, the protease-polymerase processing intermediate
3CD produced by HAV cleaves TRIF, a protein that is very
important in the ISG signaling pathway, preventing the proper
immune response (Qu 2011).
To easily study HAV, a small, accurate model is needed. An
effective mouse model would be a helpful resource, as it would
allow for in-depth study of HAV responses to become a wide-
spread field. The Lemon lab has created a mouse that they were
able infect with HAV by using gene-knockout to block the
signaling chain in a similar place to that of an infected human.
Cleavage of TRIF by HAV/Gene Knockout
All that remained was to prove the validity of our model. This sort
of research has not been conducted before, and many people
believed that it would be impossible to infect the mice by a simple
gene knockout. Because of this, there is no solid background
research to do on the mouse immune response to HAV infection.
However, it is very clear that a mouse model is the sort of animal
that will be very helpful in the long run and was the logical next
step into research on HAV. They have very similar physiology and
genetic information to that of humans. While not an exact model,
they are invaluable (Simmons 2008)
The goal of my research was to quantify the expression of
interferon stimulated genes (ISGs) in the livers of mouse models
infected with Hepatitis A virus (HAV). I looked for elevated levels
of ISG20, ISG15, ISG56, IP10, interferon alpha/beta, and
interferon gamma, to mirror the results found in studies on
naturally-infected chimpanzees (Lanford et al. 2011). The presence
of these genes shows that the immune response in the livers of the
mice accurately represents what occurs when humans and
chimpanzees are infected with HAV, taking one step forward to
proving the legitimacy of the Lemon lab mouse model for HAV. I
quantified the expression of ISGs by using qRT-PCR to measure
the levels of ISG-coding RNA in infected and uninfected mice. The
research turned out to be successful, showing elevated levels of the
expected genes. This supports the mouse model, which will
eventually allow for affordable, wide-spread research into the
innate immune responses to HAV in humans.
ABSTRACT
INTRODUCTION
In the human models for HAV, there have been noticeable (but
decreased) levels of ISG expression, despite the cleavage of TRIF
(Lanford et al. 2011). Do the mouse models show a similar
increase?
QUESTION
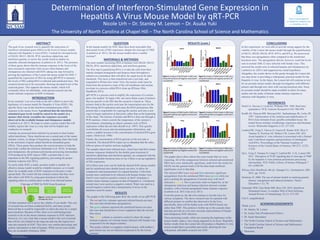
The graphs above show almost the exact results that we were
expecting. All of the comparisons between infected and uninfected
DKO mice were statistically significant, aside from the results for
ISG20, but the general trend of all the data lends unofficial
significance even to that data.
The infected DKO mice (red and blue) showed a significant
upregulation from the uninfected DKO mice (green) while not
quite reaching the upregulation of normal mice with SenV
infection (yellow). This is precisely what we hoped for, as the
chimpanzee infection and human infection showed a similar
situation, with a limited upregulated innate immune response
(Lanford et al. 2011) (Qu et al. 2011).
From this point on, the lab will continue to test the mice for
various symptoms. The above research may be repeated with
different primers to confirm the observed re In the liver,
specifically, there will be further tests with MAVS knock out,
rather than TRIF. This protein is further up on the cascade chain
and may provide an even more accurate representation of human
and chimpanzee HAV infection.
These promising results, while not ensuring the legitimacy of the
mouse model, make a very strong argument in its favor. Hopefully,
further results from the Lemon lab will produce a Hepatitis A virus
mouse model that is accessible and useful, allowing for true
widespread, affordable research into HAV.
RESULTS (cont.) CONCLUSIONS
In this experiment, we were able to provide strong support for the
viability of the Lemon lab mouse model through the quantification
of ISG15, ISG20, ISG56, IP10, IFN b, and IFN g. We discovered
that there was upregulation when compared to the uninfected
knockout mice. The upregulation did not, however, reach the levels
seen in normal AML12 mice infected with Sendai virus. This
mirrored the results seen in infected humans and chimpanzees by
Lanford et al. (2011) and supported my initial hypothesis.
Altogether, the results shown in this poster brought the Lemon lab
one step closer to providing a widespread, practical model for the
Hepatitis A virus. In the future, the Lemon lab will continue to test
for an accurate mouse model, through investigation with different
primers and through new mice with varying knockout sites. Soon,
an accurate model should be made available to allow for many
studies into the study of human innate immune response to
infection with Hepatitis A virus.
REFERENCES
Heid CA, Stevens J, Livak KJ, Williams PM. 1996. Real time
quantitative PCR. Genome Research 6 (10): 986-994.
Krafft AE, Duncan BW, Bijwaard KE, Taubenberger JK, Lichy JH.
1997. Optimization of the isolation and amplification of
RNA from formalin-fixed, paraffin-embedded tissue: the
armed forces institute of pathology experience and literature
review. Molecular Diagnosis 2 (3): 217-230.
Lanford RE, Feng Z, Chavez D, Guerra B, Brasky KM, Zhou Y,
Yamane D, Perelson AS, Walker CM, Lemon SM. 2011.
Acute hepatitis A virus infection is associated with a limited
type I interferon response and persistence of intrahepatic
viral RNA. Proceedings of the National Academy of
Sciences of the United States of America 108 (27): 11223-
11228.
Qu L, Feng Z, Yamane D, Liang Y, Lanford RE, Li K, Lemon SM.
2011. Disruption of TLR3 signaling due to cleavage of TRIF
by the hepatitis A virus protease-polymerase processing
intermediate, 3CD. Public Library of Science Pathogens 7
(9): e1002169.
RNeasy Mini Handbook, 4th ed., Quiagen Co., Germantown, MD,
2012, pp. 54-56.
Simmons D. 2008. The use of animal models in studying genetic
disease: transgenesis and induced mutation. Nature
Education 1 (1): 70.
Schneider WM, Chevillotte MD, Rice CM. 2014. Interferon-
Stimulated Genes: A complex Web of Host Defenses.
Annual Review of Immunology 32 (1): 513-545.
Urh N. (unpublished)
ACKNOWLEDGEMENTS
Thank you to
• Dr. Stanley M. Lemon
• Dr. Asuka Yuki (Postdoctoral Fellow)
• Dr. Sarah Shoemaker
• The North Carolina School of Science and Mathematics
• The North Carolina School of Science and Mathematics
Foundation Board
• Monsanto
The University of North Carolina at Chapel Hill – The North Carolina School of Science and Mathematics
Nicole Urh – Dr. Stanley M. Lemon – Dr. Asuka Yuki
Determination of Interferon-Stimulated Gene Expression in
Hepatitis A Virus Mouse Model by qRT-PCR
MATERIALS & METHODS
The most notable increasing ISGs in humans were ISG20, ISG15,
ISG56, IP10, interferon alpha/beta, and interferon gamma.
The first step in quantifying RNA is to take the cells from their
natural clumped arrangement and disperse them throughout a
solution in a monolayer that will allow for equal access by later
chemicals. This layer is then transferred into a test tube, and
suspended in RNase-free water. Next, the nucleic acids must be
freed from the protective coats of the cell membrane and nuclear
envelope in a process called RNA clean up (RNeasy Mini
Handbook 2012).
qRT-PCR is a process used to amplify the expression of a certain
gene o be studied. To begin with, one must obtain a pair of primers
that are specific to the ISG that the research is based on. These
primers bind to the nucleic acid near the transcription area for the
ISG during RNA replication and cause the RNA polymerase (the
protein that is responsible for copying the nucleic acid into a new
copy) to begin replication at that point, rather than at the beginning
of the chain. The mixture of primer and RNA is then run through a
PCR machine, which controls the temperature of the mixture’s
environment, stimulating an almost constant cycle of RNA
replication within the test tube (Krafft et al. 1997). This quickly
overwhelms all excess and unwanted genetic information, and
causes a sudden increase in the concentration of desired RNA gene
copies. (Heid et al. 1996)
Finally, the concentration of RNA particles in the test tube is
measured. The desired RNA copies are so abundant that the other,
leftover pieces of nucleic acid are negligible.
The samples taken from infected mice, which have had their innate
immune responses hindered by the double gene knockout of
interferon alpha/beta and interferon gamma, are compared with the
uninfected double knockout mice to see if there is an up-regulation
of ISG expression.
All of these tests were run for both the desired HAV mouse models
and for uninfected mice double knock out mice, to allow for
comparison and measurement of a natural baseline. Cells from
normal mice confirmed to be infected with human Sendai virus
(SenV) were used as a positive control, as SenV stimulates a
similar innate immune response to that of Hepatitis A. Uninfected
normal mice were used as a negative control. Water was used as a
second negative control and a measurement of noise on the
machines used for assays.
RESULTS
The graphs in the following pane show the results of our qRT-PCR.
• The red and blue columns represent infected knock-out mice
(the ones that should shoe upregulation).
• The green columns represent the uninfected knock-out mice
(the ones that should have a lower regulation than the red and
blue mice).
• The yellow column is a positive control to show the innate
immune response of a normal mouse infected with Sendai virus
(expected to be the largest column).
• The purple column is a negative control mouse, with neither a
gene knock-out, nor an infection (expected to be the lowest
column).
Figure 2: Analysis of ISG20 levels in DKO mice,
along with positive and negative control (Urh
unpublished).
Figure 3: Analysis of ISG56 levels in DKO mice,
along with positive and negative control (Urh
unpublished).
Figure 4: Analysis of IFNb1 levels in DKO mice,
along with positive and negative control (Urh
unpublished).
Figure 5: Analysis of ISG15 levels in DKO mice,
along with positive and negative control (Urh
unpublished).
Figure 6: Analysis of IFNg levels in DKO mice,
along with positive and negative control (Urh
unpublished).
Figure 7: Analysis of IP10 levels in DKO mice,
along with positive and negative control (Urh
unpublished).
HAV enters
body
Protein TRIF
senses dsRNA
Activates IFN-β
signaling
cascade
Body enters
antiviral state
HAV/
Gene
Knock-
out
Figure 1: Innate immune cascade with HAV
cleavage (Qu 2011)