
Downloaded 40 times
![Simulation approach
Wavelength [nm]
400 600 800 1000 1200
Measureddifferential
spectralresponsivitys[mA/Wm
2
]
0.0
0.2
0.4
0.6
0.8
900 950 1000 1050 1100
0.4
0.5
0.6
0.7
0,10,25 & 50
W/m
2
100
200
300
400
600-1200
SR
~
Bias intensity [W/m2
]
0 200 400 600 800 1000
Differentialsandintegrated
spectralresponsivitys[mA/Wm
2
]
0.0
0.2
0.4
0.6
0.8
300nm
500nm
1100nm
700nm
900nm
286 317
305
bias ramp
~
s~
s
p-type Cz Si
τSRH,n0 = 80 µs
τSRH,p0 = 800 µs
J0r,c = 790 fA/cm²
J0e = 59 fA/cm²
SiOSn = 1.22×104 cm/s
Sp = 5.92 cm/s
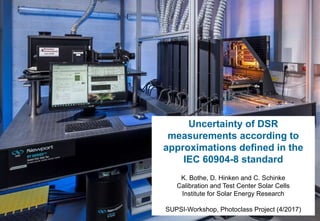
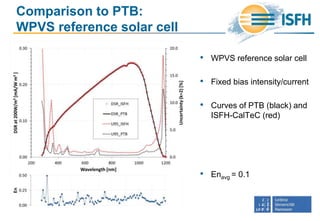
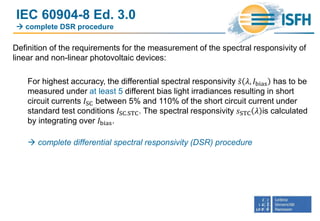
• FEM simulation of a PERC c-Si solar
cell using SENTAURUS DEVICE
• Silicon dioxide dielectric layer at the
rear side with very high interface
defect density of 3×1010 cm-2
• 𝑠 𝜆, 𝐸bias curves show high non-
linearity
• Bias ramps at different wavelengths
yield bias intensity setpoints E0 from
286 to 317 W/m²](https://image.slidesharecdn.com/20supsiworkshopschinke-170404211414/85/20-supsi-workshop-schinke-13-320.jpg)
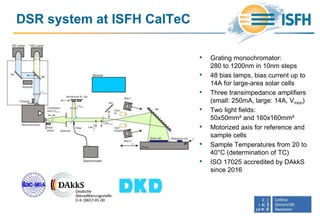
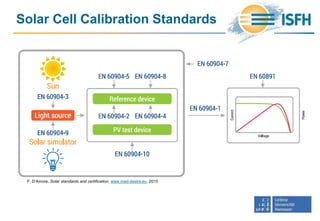
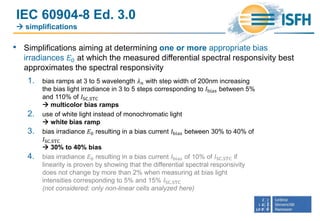
![Impact of bias ramp wavelength
and bias irradiance
• How much do the simplifications
deviate from the complete DSR
method?
• Simplification 1 (Multicolor bias ramps):
Deviations below -1.3%
• Simplification 2 (White bias ramp):
Deviations below 4.6%
• Simplification 3 (30% bias):
Deviations below 3.9%
Wavelength [nm]
200 400 600 800 1000 1200
DeviationofsfromsSTC[%]
-2
-1
0
1
2
3
4
5
bias intensity
fixed bias irradiance
E0=300 W/m
2
white bias ramp
E0=304 W/m
2
multicolor ramp
adjusted bias irradiance
~](https://image.slidesharecdn.com/20supsiworkshopschinke-170404211414/85/20-supsi-workshop-schinke-14-320.jpg)
![Measurement
Wavelength [nm]
400 600 800 1000 1200
Measureddifferential
spectralresponsivitys[mA/Wm
2
]
0.00
0.01
0.02
0.03
0.04
0.05
800 900 1000 1100
0.30
0.35
0.40
0.45
0.50
10 W/m
2
100
20
200
900
1100
~
Bias intensity [W/m2
]
0 200 400 600 800 1000 1200
Differentialsandintegrated
spectralresponsivitys[mA/Wm
2
]
0.01
0.02
0.03
0.04
0.05
300nm
500nm
1100nm
700nm
900nm
E0=287 301
s
bias ramp
~
s~
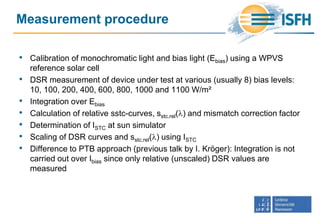
Si3N4
p-type Cz Si
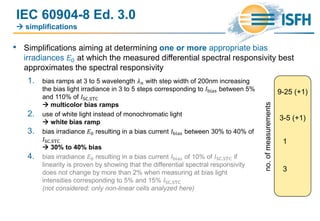
• p-type Cz Si without AlOx but with SiN
• 𝑠 𝜆, 𝐸bias curves show high non-
linearity
• Bias ramps at different wavelengths
yield bias intensity setpoints from 287
to 301 W/m²
(Simulation: 286 – 317 W/m²)](https://image.slidesharecdn.com/20supsiworkshopschinke-170404211414/85/20-supsi-workshop-schinke-15-320.jpg)
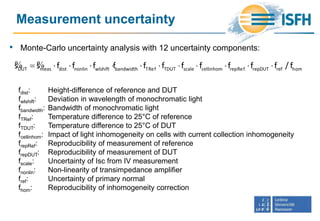
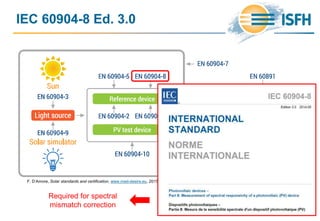
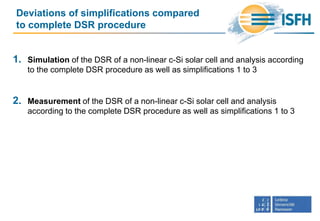
![Impact of bias ramp wavelength
and bias irradiance
• How much do the simplifications
deviate from the complete DSR
method?
• Simplification 1 (Multicolor bias ramps):
Deviations below -0.2%
• Simplification 2 (White bias ramp):
Deviations below -1%
• Simplification 3 (30% bias):
Deviations below -1%
Wavelength [nm]
200 400 600 800 1000 1200 1400
DeviationofsfromsSTC[%]
-10
-8
-6
-4
-2
0
2
4
bias ramp wavelength
and corresponding bias intensity
500nm / 169 W/m
2
700nm / 126 W/m
2
1100nm / 353 W/m
2
~
900nm / 301 W/m
2
300nm / 146 W/m
2
Wavelength [nm]
200 400 600 800 1000 1200
DeviationofsfromsSTC[%]
-2
-1
0
1
2
3
multicolor ramp
adjusted bias irradiance
fixed bias irradiance
E0=300 W/m
2
~ bias intensity
white bias ramp / E0=314 W/m
2](https://image.slidesharecdn.com/20supsiworkshopschinke-170404211414/85/20-supsi-workshop-schinke-16-320.jpg)
![Bias light intensities
0
500
1000
BiasIntensity[W/m
2
]
0
500
1000
Wavelength [nm]
300 700700 900900 1200
0
500
1000
0.5%
accepted deviation
of DSR from SR
1.0%
5.0%
280 - 290
290
250 - 350
W/m2
W/m2
W/m2](https://image.slidesharecdn.com/20supsiworkshopschinke-170404211414/85/20-supsi-workshop-schinke-18-320.jpg)
1) The document discusses uncertainties in differential spectral response (DSR) measurements according to approximations defined in IEC 60904-8. 2) It analyzes the impact of using simplified DSR measurement procedures compared to the complete DSR procedure, through simulations and measurements of non-linear crystalline silicon solar cells. 3) The results show deviations below 5% for all approximations in simulations, and below 1% for measurements when using multicolor bias light ramps.


![5G Explained! A High Level Overview [Introduction]](https://cdn.slidesharecdn.com/ss_thumbnails/5gexplainedahighleveloverview-260119165306-cc137a3e-thumbnail.jpg?width=640&height=640&fit=bounds)


