
Recommended
More Related Content
Similar to market equilibrium.pptx
Similar to market equilibrium.pptx (20)
More from sadiqfarhan2
More from sadiqfarhan2 (20)
Recently uploaded
Recently uploaded (20)
market equilibrium.pptx
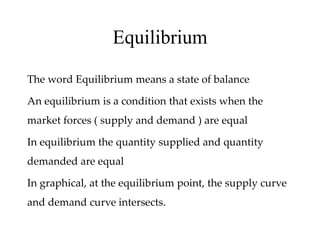
- 1. Equilibrium The word Equilibrium means a state of balance An equilibrium is a condition that exists when the market forces ( supply and demand ) are equal In equilibrium the quantity supplied and quantity demanded are equal In graphical, at the equilibrium point, the supply curve and demand curve intersects.
- 2. Equilibrium Price The price that balances quantity supplied and quantity demanded. On a graph, it is the price at which the supply and demand curves intersect. Equilibrium Quantity The quantity supplied and the quantity demanded at the equilibrium price. On a graph it is the quantity at which the supply and demand curves intersect.
- 6. Example Lets recall our previous example, the following is the market supply ad market demand schedule of an ice cream
- 7. The market becomes equilibrium when the market forces become balanced. i.e. demand and supply are equal At the above table, the market is equilibrium at the midpoint, where price is 4 and quantity supplied and demanded is 8 The equilibrium price is 4 And equilibrium quantity is 8 Let show in a graph
- 8. EQUILIBRIUM POINT Price per cone 7 6 5 4 3 2 1 S E D 8 10 14 12 4 6 2
- 9. All other points, except point E, the quantity supplied and quantity demanded are not equal. Therefore; Excess Supply Occurs when the quantity supplied is greater than quantity demanded in a market Excess Demand Occurs when the quantity demanded is greater than quantity supplied It can be shown graphically as follows
- 10. Example 2
- 11. EQUILIBRIUM POINT A Price per DVD $5.00 4.00 3.50 3.00 2.50 2.00 1.50 1.00 S C Excess demand D 1 2 3 4 5 6 7 8 9 10 11 12 Quantity of DVDs supplied and demanded Excesssupply E
- 12. Exercise Using the following table; Graph the supply and demand curves Show the equilibrium point What is the equilibrium price What is the equilibrium quantity How many points excess supply exists? show How many points there is excess demand? show
- 13. Price Market Demand Market supply 1 7 7 2 6 6 3 5 5 4 4 4 5 3 3 6 2 2 7 1 1
- 14. ELASTICITY elasticity, in economics, a measure of the responsiveness of one economic variable to another. For example, Elasticity of demand or supply explains the relationship between a change in price and consequent change in amount demanded or supplied . Elasticity is measurement of the percentage change in one variable that results from a 1% change in another variable.
- 15. Elasticity is an important economic measure, because it indicates how quantity supplied and quantity demanded change when price or other determinants are changed. The measure can be either Elastic, Unit Elastic, or Inelastic Elastic A small change in variable may lead to a great change in the other. For example, A small change in price may lead to a great change in quantity demanded. In this case, demand is elastic.
- 16. In-Elastic A big change in variable is followed by a small change in the other variable. For example; a big change in price is followed by a small change in demanded then the demand in “inelastic”. Unit Elastic A change in variable may lead to an equivalent change in the other variable.
- 17. Elasticity of Demand/ Supply
- 30. Utility Concepts