RESEARCH ARTICLE Open Access
Long-term disability in anxiety disorders
Sanne M. Hendriks1*, Jan Spijker2, Carmilla M. M. Licht3, Florian Hardeveld4, Ron de Graaf5, Neeltje M. Batelaan3,
Brenda W. J. H. Penninx3 and Aartjan T. F. Beekman3
Abstract
Background: This longitudinal study aims to investigate differences in long-term disability between social anxiety
disorder (SAD), panic disorder with agoraphobia (PDA), panic disorder without agoraphobia (PD), generalized
anxiety disorder (GAD) and multiple anxiety disorders (multiple AD), focusing on the effects of different course
trajectories (remission, recurrence and chronic course) and specific symptom dimensions (anxiety arousal and
avoidance behaviour).
Methods: Data were used from participants with no psychiatric diagnosis (healthy controls, n = 647) or with a
current anxiety disorder (SAD, n = 191; PDA, n = 90; PD, n = 84; GAD, n = 110; multiple AD, n = 480). Severity of
anxiety arousal and avoidance behaviour symptoms was measured using the Beck Anxiety Inventory and the Fear
Questionnaire. The World Health Organization Disability Assessment Schedule II was used to measure disability.
Results: Long-term disability was most prevalent in participants with SAD and multiple AD, and lowest in PDA and
PD. GAD had an intermediate position. Anxiety arousal and avoidance behaviour were associated with more
long-term disability in anxiety disorders than course trajectories.
Conclusions: Various anxiety disorders have different disability levels over 4 years of time, therefore diagnostic
distinction is important for treatment focus. Anxiety arousal and avoidance behaviour are major predictors for
long-term disability in anxiety disorders.
Background
Disability is often defined as ‘any restriction or lack of
capacity to perform an activity in a manner or within a
range considered normal for a human being’ [1]. Anxiety
disorders are associated with severe disability [2–6] and
the negative impact of anxiety is substantial [3, 7, 8].
Previous research showed that anxiety disorders differ in
disability levels. Overall, multiple anxiety disorders (mul-
tiple AD, i.e. comorbidity with other anxiety disorders)
are associated with more disability than pure anxiety dis-
orders [9]. Furthermore, social anxiety disorder (SAD)
and generalized anxiety disorder (GAD) are associated
with higher disability levels compared to panic disorder,
[3, 10–12] although other research points out otherwise
[13–15]. However, it remains unclear whether contrasts
in disability levels among anxiety disorders persist over a
longer period.
More severe symptoms and more comorbidity are associ-
ated with a chronic course in anxiety disorders [16–20].
Therefore, we expect that long-term disability is more com-
mon in anxiety patients with a chronic course. However,
some research gave indications that disability can still be
present after remission of the anxiety disorder [21]. Because
SAD and multiple AD are more strongly asso ...
RESEARCH ARTICLE Open AccessLong-term disability in anxiet.docx
1. RESEARCH ARTICLE Open Access
Long-term disability in anxiety disorders
Sanne M. Hendriks1*, Jan Spijker2, Carmilla M. M. Licht3,
Florian Hardeveld4, Ron de Graaf5, Neeltje M. Batelaan3,
Brenda W. J. H. Penninx3 and Aartjan T. F. Beekman3
Abstract
Background: This longitudinal study aims to investigate
differences in long-term disability between social anxiety
disorder (SAD), panic disorder with agoraphobia (PDA), panic
disorder without agoraphobia (PD), generalized
anxiety disorder (GAD) and multiple anxiety disorders (multiple
AD), focusing on the effects of different course
trajectories (remission, recurrence and chronic course) and
specific symptom dimensions (anxiety arousal and
avoidance behaviour).
Methods: Data were used from participants with no psychiatric
diagnosis (healthy controls, n = 647) or with a
current anxiety disorder (SAD, n = 191; PDA, n = 90; PD, n =
84; GAD, n = 110; multiple AD, n = 480). Severity of
anxiety arousal and avoidance behaviour symptoms was
measured using the Beck Anxiety Inventory and the Fear
Questionnaire. The World Health Organization Disability
Assessment Schedule II was used to measure disability.
Results: Long-term disability was most prevalent in participants
with SAD and multiple AD, and lowest in PDA and
PD. GAD had an intermediate position. Anxiety arousal and
avoidance behaviour were associated with more
2. long-term disability in anxiety disorders than course
trajectories.
Conclusions: Various anxiety disorders have different disability
levels over 4 years of time, therefore diagnostic
distinction is important for treatment focus. Anxiety arousal and
avoidance behaviour are major predictors for
long-term disability in anxiety disorders.
Background
Disability is often defined as ‘any restriction or lack of
capacity to perform an activity in a manner or within a
range considered normal for a human being’ [1]. Anxiety
disorders are associated with severe disability [2–6] and
the negative impact of anxiety is substantial [3, 7, 8].
Previous research showed that anxiety disorders differ in
disability levels. Overall, multiple anxiety disorders (mul-
tiple AD, i.e. comorbidity with other anxiety disorders)
are associated with more disability than pure anxiety dis-
orders [9]. Furthermore, social anxiety disorder (SAD)
and generalized anxiety disorder (GAD) are associated
with higher disability levels compared to panic disorder,
[3, 10–12] although other research points out otherwise
[13–15]. However, it remains unclear whether contrasts
in disability levels among anxiety disorders persist over a
longer period.
More severe symptoms and more comorbidity are associ-
ated with a chronic course in anxiety disorders [16–20].
Therefore, we expect that long-term disability is more com-
mon in anxiety patients with a chronic course. However,
some research gave indications that disability can still be
present after remission of the anxiety disorder [21]. Because
SAD and multiple AD are more strongly associated with a
chronic course than other anxiety disorders [19, 22–24] we
4. http://crossmark.crossref.org/dialog/?doi=10.1186/s12888-016-
0946-y&domain=pdf
mailto:[email protected]
http://creativecommons.org/licenses/by/4.0/
http://creativecommons.org/publicdomain/zero/1.0/
This longitudinal study among a large cohort of partici-
pants with anxiety disorders investigates: 1) differences in
long-term disability between participants with social anxiety
disorder (SAD), panic disorder with agoraphobia (PDA),
panic disorder without agoraphobia (PD), generalized anx-
iety disorder (GAD) and multiple anxiety disorders (mul-
tiple AD); 2) differences in long-term disability for different
course trajectories; and 3) the role of anxiety arousal and
avoidance behaviour in long-term disability.
Methods
Study sample
As reported before, [11, 19, 20]. The Netherlands Study
of Depression and Anxiety (NESDA) is a naturalistic co-
hort study to examine the long-term course and conse-
quences of anxiety and depressive disorders [26]. In short,
a total of 2981 participants were included, aged 18 through
65 years. The research protocol was approved centrally by
the ethical review board of VU University Medical Center.
Subsequently it was approved by the local ethical review
boards of Leiden University Medical Center and University
Medical Center Groningen. The study was performed in
accordance with the ethical standards of the Declaration of
Helsinki. All participants provided written informed con-
sent. Participants with a current or lifetime diagnosis of
anxiety or depression, and healthy controls were included.
Exclusion criteria were (1) a primary diagnosis of psych-
otic, obsessive compulsive, bipolar or severe addiction dis-
order, and (2) not being fluent in Dutch.
5. Participants with an anxiety disorder (SAD, PDA, PD,
GAD and multiple AD) at baseline (6-month recency
diagnosis) and healthy controls were included for this study
(Fig. 1). A follow-up assessment was done two (T1) and
4 years (T2) after the baseline measurement. In total 1602
participants met these criteria at T0 (baseline); 191 partici-
pants (11.9 %) with pure SAD, 90 participants (5.6 %) with
pure PDA, 84 participants (5.2 %) with pure PD, 110 par-
ticipants (6.9 %) with pure GAD, 480 participants (30.0 %)
with multiple AD and 647 healthy controls (40.4 %). 1351
participants (84.3 %) had a follow-up assessment at T1,
and 1235 participants (77.1 %) at T2.
Psychiatric status
As done before, [11, 19, 20] the Composite International
Diagnostic Interview (CIDI version 2.1) was used to
diagnose the presence of SAD, PDA, PD, GAD and mul-
tiple AD, a highly reliable and valid instrument for asses-
sing anxiety disorders [27].
Course trajectory
The clinical course trajectory categorized the participants
into four groups: a) healthy controls (no history of anxiety
disorder and no anxiety disorder at T0, T1 and T2), b) re-
mission (remission of baseline anxiety disorder at T1 and/
or T2 without recurrence), c) recurrence (remission of
baseline anxiety disorder at T1 but with recurrence at T2),
and d) chronic course (baseline anxiety disorder at T0, T1
and T2).
Anxiety arousal and avoidance behaviour
As done before, [11, 19, 20] the Beck Anxiety Inventory
(BAI) [28] and the Fear Questionnaire (Fear Q) [29]
6. Fig. 1 Flowchart of study sample
Hendriks et al. BMC Psychiatry (2016) 16:248 Page 2 of 8
were used to measure baseline severity of anxiety arousal
and avoidance behaviour symptoms, respectively. The BAI
and the Fear Q are both widely used and have proven to
be highly valid and reliable [30, 31]. The Cronbach’s α in
this study for the BAI and the Fear Q were .94 and .89,
respectively.
Disability
To measure disability at baseline, after two and after
4 years, we used the total score of the World Health
Organization Disability Assessment Schedule II.(WHO-
DAS-II) [32]. The WHODAS-II provides a functioning
profile for six activity domains (cognition, mobility, self-
care, social interaction, life activities and participation).
To measure general disability, domain scores were com-
bined into a total score. The WHODAS-II shows good
inter-item reliability with a Cronbach’s α of .96 for the total
score. In Hendriks et al. [11] a cross sectional study was
conducted to compare the different disability domains of
the WHODAS-II between different anxiety disorders and
healthy controls. The results showed that disability was
generally highest in multiple anxiety disorder (e.g. mean
disability in cognition = 33.7) and social anxiety dis-
order (mean = 32.7), followed by generalized anxiety
disorder (mean = 27.2) and panic disorder with agorapho-
bia (mean = 26.3), and lowest in panic disorder without
agoraphobia (mean = 22.1). This pattern was consistently
present across different disability domains, therefore for
this study we choose to use only the total score of the
WHODAS-II.
7. Covariates
As done before, [11] covariates at baseline were set: age,
gender, years of education attained, partner status, num-
ber of somatic illnesses and comorbid depressive dis-
order. Previous studies showed that these covariates are
associated with both anxiety and disability [33, 34].
Statistical analyses
SPSS Version 20.0 (SPSS Inc, Chicago, Illinois) was used
for the statistical analyses. We used chi-square statistics for
categorical and analyses of variance for continuous vari-
ables to compare sociodemographic, clinical psychiatric
characteristics and long-term disability between healthy
controls and participants with anxiety disorders. Linear
mixed models (LMM) [35] were used to analyse the rela-
tionship between 1) baseline psychiatric status, 2) course
trajectories and 3) symptom dimensions with the outcome
long-term disability.
Results
Table 1 presents the demographic and clinical characteris-
tics of the total sample. A chronic course was most preva-
lent in the multiple AD group (35.1 %). After 4 years
64.9 % of the participants with SAD, 68.6 % of PDA, 65.6 %
of PD, 79.7 % of GAD and 51.1 % of multiple AD were
without an anxiety disorder (X2 = 355.5, df = 25, p < .001).
Anxiety arousal and avoidance behaviour symptoms were
highest in the multiple AD group compared to other
groups (BAI F = 286.2, df = 5, p < .001; Fear Q F = 205.12,
df = 5, p < .001).
Figure 2 shows 4-year disability patterns between partici-
pants with SAD, PDA, PD, GAD, multiple AD and healthy
controls (n = 1235) at each time point. Healthy controls ex-
8. perienced less disability compared to participants with any
anxiety disorder and this differed significantly at baseline
(all p-values < .001), 2-year follow-up (all p-values < .05) and
4-year follow-up (all p-values < .04). Generally, SAD and
multiple AD participants experienced most disability. Dis-
ability was lowest in PDA and PD, and GAD had an inter-
mediate position. At baseline, participants with SAD, GAD
and multiple AD experienced more disability than partici-
pants with PDA and PD (all p-values < .03). Participants
with multiple AD had more disability than participants with
PD at 2 years (T1) (p = .01). At 4 years (T2), participants
with SAD showed more disability than participants with
PDA (p = .02), and participants with multiple AD showed
more disability than participants with PD (p = .01) and
PDA (p = .02).
Table 2 shows LMM analyses for long-term disability.
Univariable analyses indicate that having an anxiety dis-
order at baseline predicts long-term disability. SAD x time,
PDA x time, GAD x time and multiple AD x time showed
significant negative associations. This indicates that during
follow-up the impact of the disorders on long-term disabil-
ity became smaller. Course trajectories (remission, re-
currence and chronic course) and symptom dimensions
(anxiety arousal and avoidance behaviour) were also as-
sociated with long-term disability. No associations were
found for symptom dimensions x time, suggesting that
associations did not significantly change over time.
In Model 1 the degree was examined to which course
trajectories contribute to long-term disability across anxiety
disorders. Baseline psychiatric status and chronic course
remained significant predictors. Also SAD x time, PDA x
time, GAD x time and multiple AD x time remained sig-
nificant. This indicates that during follow-up the impact of
baseline SAD, PDA, GAD and multiple AD on long-term
9. disability became smaller.
In Model 2 baseline psychiatric status and symptom
dimensions were assessed together. The results show that
all coefficients decreased notably and only SAD, GAD,
multiple AD, anxiety arousal and avoidance behaviour
remained significant. PDA and PD did not remain sig-
nificant. This indicates that anxiety arousal and avoid-
ance behaviour lead to more long-term disability in
anxiety disorders, which especially explain the found
disability levels in PD and PDA.
Hendriks et al. BMC Psychiatry (2016) 16:248 Page 3 of 8
Fig. 2 Disability (total score WHODAS-II) over 4 years of time
for baseline psychiatric status (n = 1235) *
Table 1 Demographic and clinical characteristics of the total
sample (healthy controls and participants with different anxiety
disorders,
n = 1602)
Healthy controls SAD PDA PD GAD Multiple AD pa
n = 647 n = 191 n = 90 n = 84 n = 110 n = 480
Sociodemographics
Age (mean, SD) 41.1 (14.6) 37.3 (11.9) 40.1 (12.5) 38.3 (11.1)
37.4 (12.0) 40.8 (11.7) .001
Sex (% female) 61.7 64.9 74.4 59.5 69.1 68.5 .05
Education (mean, SD) 12.8 (3.2) 12.6 (3.2) 12.1 (3.4) 12.4 (3.1)
11. Anxiety arousal (BAI, mean, SD) 4.1 (4.9) 13.9 (9.1) 19.1
(11.6) 14.2 (8.9) 14.6 (8.2) 23.1 (11.1) <.001
Avoidance behaviour (Fear Q, mean, SD) 12.1 (12.2) 34.4
(18.8) 32.1 (19.0) 22.8 (18.1) 25.0 (16.3) 43.7 (20.6) <.001
ap-value based on chi-square statistics for categorical variables
and analyses of variances for continuous variables
Hendriks et al. BMC Psychiatry (2016) 16:248 Page 4 of 8
In Model 3, baseline psychiatric status, course trajector-
ies and symptom dimensions were assessed together.
SAD, GAD, multiple AD, anxiety arousal and avoidance
behaviour remained significant but course trajectories not.
Furthermore, SAD x time and GAD x time remained sig-
nificant. This indicates that the impact of SAD and GAD
on long-term disability remained irrespective of course
and symptom dimensions.
Discussion
The results showed that all anxiety disorders were associ-
ated with more disability over 4 years of time compared to
healthy controls, though differences became smaller over
time.
Long-term disability was most prevalent in participants
with SAD and multiple AD, and lowest in PDA and PD.
GAD had an intermediate position. Furthermore, we found
differences between course trajectories; a chronic course
predicts long-term disability better than remission and re-
currence. However, symptom dimensions seem to be
stronger predictors of long-term disability than course
trajectories.
12. Our finding that long-term disability is more prevalent in
SAD and multiple AD compared to other anxiety disor-
ders, is in line with previous results [36, 37] Because SAD
and multiple AD are more associated with a chronic course
than other anxiety disorders [20, 22, 23] and a chronic
course is associated with more disability, [21] we expected
that long-term disability is more prevalent in SAD and
multiple AD. Our results showed that a chronic course is
indeed associated with long-term disability. Avoidance be-
haviour was also associated with long-term disability in our
study. We hypothesised that long-term disability would be
high in SAD, PDA and multiple AD because of the high
levels of avoidance behaviour in these disorder. However,
PDA had a low position. So the assumption that avoidance
behaviour predicts long-term disability better than anxiety
arousal seems to be debatable.
Our findings showed intermediate associations for
long-term disability and GAD. The association between
GAD and disability may be particularly strong because
Table 2 Linear mixed model analyses for long-term disability
(total score WHODAS-II)a
Disability
Univariable Model 1 Model 2 Model 3
ß (SE) p ß (SE) p ß (SE) p ß (SE) p
Baseline psychiatric status
Healthy controls Ref Ref Ref Ref
SAD 15.28 (1.55) <.001 14.26 (1.74) <.001 5.09 (1.42) <.001
14. Chronic course 14.65 (1.32) <.001 3.65 (1.48) <.001 0.94 (1.08)
.35
Symptom dimensions
Anxiety arousal 24.28 (0.04) <.001 12.49 (0.06) <.001 12.51
(0.06) <.001
Anxiety arousal x time 1.49 (0.02) .14 0.90 (0.03) .37 0.86
(0.03) .39
Avoidance behaviour 23.28 (0.02) <.001 10.58 (0.03) <.001
10.57 (0.03) <.001
Avoidance behaviour x time -1.40 (0.01) .16 0.17 (0.01) .87
0.14 (0.01) .89
aAnalyses corrected for covariates age, sex, education, partner
status, number of somatic illnesses and comorbid depression
Model 1: baseline psychiatric status and course trajectories;
Model 2: baseline psychiatric status and symptom dimensions;
Model 3: final model
Hendriks et al. BMC Psychiatry (2016) 16:248 Page 5 of 8
worry is pervasive and can be focused on any area (more
general concerns, including social situations and physical
concerns), whereas the focus of distress for SAD, PDA
and PD is more narrow. Nevertheless, this finding is
only partly in line with previous results. Naragon-Gainey
et al. [12] found that GAD at baseline was more associ-
ated with severe disability in certain areas (i.e. work,
household, family, private leisure) compared to SAD and
PDA/PD. However, after 2 years participants with GAD
15. at baseline experienced no more disability than partici-
pants with SAD and PDA/PD. Previous research showed
that comorbidity between GAD and other mental disor-
ders is high (e.g. major depressive disorder) [5, 38–41].
Possibly, this high comorbidity can explain the inconsist-
ent results among previous research. However, other re-
search pointed out that the disability seen in GAD
cannot be explained by comorbidity [42].
The results showed that long-term disability is lowest
in PDA and PD which is partly in line with other studies
[12, 13]. As mentioned in our previous study [11], dis-
ability in PDA and PD is generally associated with phys-
ical disability [14, 37]. Unfortunately, physical disability
is not measured by the WHODAS-II very well and we
can therefore not establish whether PDA and PD partici-
pants in this study have more physical disability com-
pared to other participants.
Baseline psychiatric status and symptom dimensions
were stronger predictors for long-term disability than
course trajectories. This indicates that participants with
SAD, GAD and multiple AD remain more disabled than
PDA and PD, despite the course. Furthermore, although
remission rates were relatively high, participants with
anxiety disorders at baseline remain more disabled than
healthy controls after 4 years. Possibly, baseline psychi-
atric status contains important information which was
not measured in our study, such as age of onset, envir-
onmental factors, personality characteristics, and pre-
morbid functioning. Another possibility is that when
participants remit over 4 years, subthreshold anxiety
symptoms may still be present and cause disability. Pre-
vious research indeed showed that subthreshold anxiety
is also associated with long-term disability [43, 44].
This study has several strengths. Adequate analyses were
16. performed because of the structured psychiatric interview,
the large representative sample, and the longitudinal de-
sign. LMM analyses made it possible that all available in-
formation was used, even from participants with partly
missing data. This study has also limitations. First, not all
anxiety disorders are included in NESDA (e.g., obsessive
compulsive disorder, posttraumatic stress disorder and spe-
cific phobia). However, in this study DSM-IV diagnoses
were used instead of DSM-5. In DSM-5 obsessive compul-
sive disorder and posttraumatic stress disorder do not be-
long to the anxiety disorders chapter anymore and are
discussed in separate chapters. Next, participants with de-
pressive disorders were not excluded but analyses were
corrected for comorbid depression. Furthermore, there can
be differences in disability in the duration of a chronic dis-
order. For example, having a chronic anxiety disorder for
20 years causes possibly a different level of disability than
having a chronic anxiety disorder for 5 years.
Conclusions
Generally, long-term disability was highest in participants
with SAD and multiple AD, followed by participants with
GAD, and lowest in participants with PDA and PD. This
means that various anxiety disorders have different disabil-
ity levels over 4 years of time, so diagnostic distinction is
important for treatment focus. When there is more than
one anxiety disorder present there must be examined which
anxiety symptoms are the most severe and disabling for the
patient so treatment can focus on these symptoms. Our re-
sults show that anxiety arousal and avoidance behaviour
lead to more long-term disability in anxiety disorders com-
pared to course trajectories. Taken together, symptom di-
mensions in anxiety disorders give important information
about disability over time. The use of symptom dimensions
17. could eventually give more insight in all the complex asso-
ciations in psychopathology and determine how psychiatric
problems develop over time. The efficacy of transdiagnostic
interventions for anxiety disorder patients (e.g. acceptance
and commitment therapy and cognitive behavioural ther-
apy) which are targeting these underlying processes might
be evaluated or new interventions can be developed in
order to prevent long-term disability. The results of our
studies support the concepts of the DSM-5, which includes
dimensional aspects of diagnosis along with categories.
Acknowledgements
The infrastructure for the NESDA study (www.nesda.nl) is
funded through
the Geestkracht program of the Netherlands Organisation for
Health Research
and Development (zon-Mw, grant number 10-000-1002) and is
supported by
participating universities and mental health care organisations
(VU University
Medical Center, GGZ inGeest, Arkin, Leiden University
Medical Center, GGZ
Rivierduinen, University Medical Center Groningen, Lentis,
GGZ Friesland, GGZ
Drenthe, Scientific Institute for Quality of Healthcare (IQ
healthcare), Netherlands
Institute for Health Services Research (NIVEL) and Netherlands
Institute of
Mental Health and Addiction (Trimbos Institute)).
Availability of data and materials
The data of NESDA will not be made available in order to
protect the
participant’s identity.
Authors’ contributions
18. AB and BP designed the Netherlands Study of Depression and
Anxiety and
wrote the protocol. SH designed the analysis plan, managed the
literature
searches and analyses, and wrote the manuscript. CL
contributed to the
statistical analyses. SH, JS, CL, FH, RG, NB, BP and AB had
full access to all of
the data in the study and take responsibility for the integrity of
the data and
the accuracy of the data analysis. SH, JS, CL, FH, RG, NB, BP
and AB critically
revised the manuscript. SH, JS, CL, FH, RG, NB, BP and AB
read and approved
the final manuscript.
Hendriks et al. BMC Psychiatry (2016) 16:248 Page 6 of 8
http://www.nesda.nl
Competing interests
On behalf of all authors, the corresponding author states that
there are no
competing interests.
Consent for publication
Non applicable.
Ethics approval and consent to participate
The research protocol was approved centrally by the ethical
review board of
VU University Medical Center. Subsequently it was approved
by the local
ethical review boards of Leiden University Medical Center and
University
19. Medical Center Groningen. The study was performed in
accordance with the
ethical standards of the Declaration of Helsinki. All participants
provided
written informed consent.
Author details
1Department of Psychiatry, Pro Persona Mental Health Care,
Zandstraat 54,
Veenendaal 3905 ED, The Netherlands. 2Pro Persona Mental
Health Care,
Radboud University Nijmegen, Reinier Postlaan 6, Nijmegen
6525 GC, The
Netherlands. 3Department of Psychiatry/EMGO Institute, VU
University
Medical Center, AJ Ernststraat 887, Amsterdam 1081 HL, The
Netherlands.
4Pro Persona Mental Health Care, Willy Brandtlaan 20, Ede
6717 RR, The
Netherlands. 5Netherlands Institute of Mental Health and
Addiction, Da
Costakade 45, Utrecht 3521 VS, The Netherlands.
Received: 2 September 2015 Accepted: 24 June 2016
References
1. Sherbourne CD, Wells KB, Meredith LS, Jackson CA, Camp
P. Comorbid
anxiety disorders and the functioning and well-being of
chronically ill
patients of general medical providers. Arch Gen Psychiatry.
1996;53:889–94.
2. Alonso J, Angermeyer MC, Bernert S, Bruffaerts R, Brugha
TS, Bryson H, et al.
20. Disability and quality of life impact of mental disorders in
Europe: results
from the European Study of the Epidemiology of Mental
Disorders
(ESEMeD) project. Acta Psychiatr Scand Suppl. 2004;420:38–
46.
3. Bijl RV, Ravelli A. Current and residual functional disability
associated with
psychopathology: findings from the Netherlands Mental Health
Survey and
Incidence Study (NEMESIS). Psychol Med. 2000;30:657–68.
4. Stein MB, Roy-Byrne PP, Craske MG, Bystritsky A, Sullivan
G, Pyne JM, et al.
Functional impact and health utility of anxiety disorders in
primary care
outpatients. Med Care. 2005;43:1164–70.
5. Olfson M, Fireman B, Weissman MM, Leon AC, Sheehan
DV, Kathol RG, et al.
Mental Disorders and disability among patients in a primary
care group
practice. Am J Psychiatry. 1997;154:1734–40.
6. Mendlowicz MV, Stein MB. Quality of life in individuals
with anxiety
disorders. Am J Psychiatry. 2000;157:669–82.
7. Norberg MM, Diefenbach GJ, Tolin DF. Quality of life and
anxiety and
depressive disorder comorbidity. J Anxiety Disord.
2008;22:1516–22.
8. Henning ER, Turk CL, Mennin DS, Fresco DM, Heimberg
RG. Impairment and
21. quality of life in individuals with generalized anxiety disorder.
Depress
Anxiety. 2007;24:342–9.
9. World Health Organization. International Classification of
Impairments,
Disabilities and Handicaps. Geneva: World Health
Organization; 1980.
10. Comer JS, Blanco C, Hasin DS, Liu S, Grant BF, Turner B,
et al. Health-related
quality of life across the anxiety disorders: results from the
National
Epidemiologic Survey on alcohol and related conditions
(NESARC). J Clin
Psychiatry. 2011;72:43–50.
11. Hendriks SM, Spijker J, Licht CMM, Beekman ATF,
Hardeveld F, de Graaf R, et
al. Disability in anxiety disorders. J Affect Disord.
2014;166:227–33.
12. Naragon-Gainey K, Gallagher MW, Brown TA. A
longitudinal examination of
psychosocial impairment across the anxiety disorders. Psychol
Med.
2014;44:1691–700.
13. Sherbourne C, Sullivan G, Craske MG, Roy-Byrne P,
Golinelli D, Rose RD, et al.
Functioning and disability levels in primary care outpatients
with one or
more anxiety disorders. Psychol Med. 2010;40:2059–68.
14. Schonfeld WH, Verboncoeur CJ, Fifer SK, Lipschutz RC,
Lubeck DP,
22. Buesching DP. The functioning and well-being of patients with
unrecognized anxiety disorders and major depressive disorder.
J Affect Disord. 1997;43:105–19.
15. Olatunji BO, Cisler JM, Tolin DF. Quality of life in anxiety
disorders: A meta-
analytic review. Clin Psychol Rev. 2007;27:572–81.
16. Fichter MM, Quadflieg N, Fischer UC, Kohlboeck G.
Twenty-five-year course
and outcome in anxiety and depression in the Upper Bavarian
Longitudinal
Community Study. Acta Psychiatr Scand. 2010;122:75–85.
17. Merikangas KR, Zhang H, Avenevoli S, Acharyya S,
Neuenschwander M,
Angst J. Longitudinal trajectories of depression and anxiety in a
prospective
community study: the Zurich Cohort Study. Arch Gen
Psychiatry.
2003;60:993–1000.
18. Rherbergen D, Batelaan NM, de Graaf R, Nolen WA,
Spijker J, Beekman AT,
et al. The 7-year course of depression and anxiety in the general
population. Acta Psychiatr Scand. 2011;123:297–306.
19. Hendriks SM, Spijker J, Licht CMM, Beekman ATF,
Penninx BWJH. Two-year
course of anxiety disorders: different across disorders or
dimensions? Acta
Psychiatr Scand. 2013;128:212–21.
20. Hendriks SM, Spijker J, Licht CMM, Beekman ATF,
Hardeveld F, de Graaf R, et
al. Long-term work disability and absenteeism in anxiety and
23. depressive
disorders. J Affect Disord. 2015;178:121–30.
21. Iancu SC, Batelaan NM, Zweekhorst MBM, Bunders JFG,
Veltman DJ, Penninx
BWJH, et al. Functional recovery after remission from anxiety
disorders. Two-
year course and predictors. Psychol Med. 2014;44:593–605.
22. Bruce SE, Yonkers KA, Otto MW, Eisen JL, Weisberg RB,
Pagano M, et al.
Influence of psychiatric comorbidity on recovery and recurrence
in
generalized anxiety disorder, social phobia, and panic disorder:
A 12-year
prospective study. Am J Psychiatry. 2005;162:1179–87.
23. Keller MB. Social anxiety disorder clinical course and
outcome: review of
Harvard/Brown Anxiety Research Project (HARP) findings. J
Clin Psychiatry.
2006;67:4–19.
24. Batelaan NM, Rhebergen D, Spinhoven P, van Balkom AJ,
Penninx BW. Two-
year course trajectories of anxiety disorders: do DSM
classifications matter?
J Clin Psychiatry. 2014;75:985–93.
25. Penninx BWJH, Nolen WA, Lamers F, Zitman FG, Smit JH,
Spinhoven P, et al.
Two-year course of depressive and anxiety disorders: results
from the
Netherlands Study of Depression and Anxiety (NESDA). J
Affect Disord.
2011;133:76–85.
24. 26. Penninx BWJH, Beekman ATF, Smit JH, Zitman FG, Nolen
WA, Spinhoven PH,
et al. The Netherlands Study of Depression and Anxiety
(NESDA): rationale,
objectives and methods. Int J Methods Psychiatr Res.
2008;17:121–40.
27. Wittchen HU. Reliability and validity studies of the WHO-
Composite
International Diagnostic Interview (CIDI): a critical review. J
Psychiatr Res.
1994;28:57–84.
28. Beck AT, Epstein N, Brown G, Steer RA. An inventory for
measuring clinical
anxiety: psychometric properties. J Consult of Clin Psychol.
1988;56:893–7.
29. Marks IM, Mathews AM. Brief standard self-rating for
phobic patients. Behav
Res Ther. 1979;17:263–7.
30. Fydrich T, Dowdall D, Chambles DL. Reliability and
validity of the Beck
Anxiety Inventory. J Anxiety Disord. 1992;6:55–61.
31. Van Zuuren FJ. The fear questionnaire. Some data on
validity, reliability and
layout. Br J Psychiatry. 1988;153:659–2.
32. World Health Organization. Disability Assessment Schedule
II. Geneva: World
Health Organization; 2000.
33. Ansseau J, Fischler B, Dierick M, Albert A, Leyman S,
25. Mignon A. Socioeconomics
correlates of generalized anxiety disorder and major depression
in primary care:
the GADIS II study (generalized Anxiety and Depression Impact
Survey II).
Depress Anxiety. 2008;25:506–13.
34. Roy-Byrne PP, Davidson KW, Kessler RC, Asmundson GJG,
Goodwin RD,
Kubzansky L, et al. Anxiety disorders and comorbid medical
illness. Gen
Hosp Psychiatry. 2006;30:208–25.
35. Twisk JWR. Inleiding in de toegepaste biostatistiek.
Maarssen: Elsevier
Gezondheidszorg; 2007.
36. Stein MB, Kean YM. Disability and quality of life in social
phobia:
epidemiologic findings. Am J Psychiatry. 2000;157:1606–13.
37. Lochner C, Mogotsi M, du Toit PL, Kaminer D, Niehaus DJ,
Stein DJ, et al.
Quality of life in anxiety disorders: a comparison of obsessive-
compulsive
disorder, social anxiety disorder, and panic disorder.
Psychopathology.
2003;36:255–62.
38. Bruce SE, Mahan JT, Dyck I, Keller MB. Infrequency of
“pure” GAD: impact of
psychiatric comorbidity on clinical course. Depress Anxiety.
2001;14:219–25.
39. Kessler RC, Nelson CB, McGonagle KA, Liu J, Swartz M,
Blazer DG. Comorbidity
26. of DSM-III-R major depressive disorder in the general
population: results from
the US National Comorbidity Survey. Br J Psychiatry
1996;30(l):17-30.
Hendriks et al. BMC Psychiatry (2016) 16:248 Page 7 of 8
40. Kessler RC, Chiu WT, Demler O, Walters EE. Prevalence,
severity, and comorbidity
of twelve-month DSM-IV disorders in the National Comorbidity
Survey
Replication (NCS-R). Arch Gen Psychiatry. 2005;62:617–27.
41. Kessler RC, Gruber M, Hettema JM, Hwang I, Sampson N,
Yonkers KA.
Comorbid major depression and generalized anxiety disorders in
the
National Comorbidity Survey follow-up. Psychol Med.
2008;38:365–74.
42. Weisberg RB, Beard C, Pagano ME, Maki KM, Culpepper L,
Keller MB.
Impairment and functioning in a sample of primary care patients
with
generalized anxiety disorder: results from the primary care
anxiety project.
Prim Care Companion J Clin Psychiatry 2010;12.
43. Karsten J, Penninx BW, Verboom CE, Nolen WA, Hartman
CA. Course and
risk factors of functional impairment in subtreshold depression
and anxiety.
Depress Anxiety. 2013;30:386–94.
27. 44. Rai D, Skapinakis P, Wiles N, Lewis G, Araya R. Common
mental disorders,
subthreshold symptoms and disability: longitudinal study. Br J
Psychiatry.
2010;197:411–2.
• We accept pre-submission inquiries
• Our selector tool helps you to find the most relevant journal
• We provide round the clock customer support
• Convenient online submission
• Thorough peer review
• Inclusion in PubMed and all major indexing services
• Maximum visibility for your research
Submit your manuscript at
www.biomedcentral.com/submit
Submit your next manuscript to BioMed Central
and we will help you at every step:
Hendriks et al. BMC Psychiatry (2016) 16:248 Page 8 of 8
BioMed Central publishes under the Creative Commons
Attribution License (CCAL). Under
the CCAL, authors retain copyright to the article but users are
allowed to download, reprint,
distribute and /or copy articles in BioMed Central journals, as
long as the original work is
properly cited.
Defining Cognitive Behavior Management Cognitive behavior
management is the use of intervention strategies designed to
teach students to control their own behaviors. Through
28. cognitive behavior management, students are taught how their
behaviors create ripple effects that affect their relationships
with others and their academic and behavior outcomes, just as
dropping a pebble in still waters creates ripples emanating
outward that affect everything in their path. Under a universal
design for classroom management, cognitive behavior
management is a proactive strategy. Teaching students to
manage their own behaviors can prevent the occurrence of
behavior difficulties in the classroom. When students can
manage their own behaviors, they do not rely on external
controls (Rafferty, 2010) such as nonverbal and verbal
interventions, reinforcements, and token economies.
Implementing a Self-Management Plan Self-management
techniques may be effective alternatives to teacher-mediated
interventions in reducing incidents of disruptive behavior
(Briesch & Chafouleas, 2009). Self-management is an umbrella
term that includes a number of techniques specifically designed
to teach students to control their own behaviors (Chafouleas,
Hagermoser Sanetti, Jaffery, & Fallon, 2012). Much of the
research conducted on self-management has involved students
with disabilities; however, self-management techniques have
also been found to be effective for students without disabilities
(Moore, Anderson, Glassenbury, Lang, & Didden, 2013). Self-
management techniques vary in a number of ways, but common
features among these techniques include identification of the
target behavior, self-observation, and self-recording. Both
general education students and students with disabilities can be
taught to manage their own behavior. Students can be taught to
use any of several different techniques to change their behavior.
Whatever techniques teachers choose, they need to take the
following steps in implementing a self-management plan:
Identify the target behavior. Determine the criteria for mastery
of the appropriate behavior. Discuss with the student the
relevance of the appropriate behavior. Introduce the self-
management technique. Model the technique. Provide guided
practice in the technique. Practice the technique in authentic
29. settings. (King-Sears, 2008; Patton, Jolivette, & Ramsey, 2006)
The first step in implementing a self-management plan is to
identify the target behavior. Target behaviors are observable,
measurable, and repeatable, and they are usually expressed in
terms of action in a positive tone (see Chapter 8). For example,
Charlie, a third grader, often pushes peers during transition
times, when in line going to lunch or recess, and when the
teacher is not looking. Since the inappropriate behavior is
pushing peers, Charlie’s target behavior would be to keep his
hands to himself. Once the inappropriate behavior has been
identified, the teacher needs to determine the criteria for
mastery of the target behavior. Charlie’s teacher monitored
Charlie’s behavior during transition times, while in line, during
lunch, and during recess. The teacher noted that over a 2-day
period, Charlie displayed his inappropriate behavior eight times.
The third step is to discuss the relevance of the appropriate
behavior. Charlie needs to understand the benefits to himself for
displaying the target behavior, such as developing positive
relationships with his peers, being able to eat lunch in the
cafeteria, being able to go to recess, and having positive notes
sent home. Once Charlie understands the difference between the
inappropriate behavior and the target behavior, the teacher
selects a self-management technique and explains the technique
to Charlie. The teacher provides a worksheet for Charlie to use
in monitoring his behavior across settings and shows him how
to mark the worksheet. For example, Charlie is to circle “yes”
or “no” depending on whether he displayed the appropriate
behavior in specific settings (see Figure 7.1). At the end of each
day, if Charlie has answered yes four times on the worksheet, he
rewards himself in a way that he and his teacher previously
determined. After a self-management technique has been
chosen, the teacher needs to model how to use it. Charlie’s
teacher verbalizes her thought process while she models
appropriate and inappropriate behaviors, and while she marks
the self-management worksheet as yes, she did keep her hands
to herself, or no, she did not keep her hands to herself. Then the
30. teacher provides Charlie an opportunity to practice using the
self-management worksheet. During guided practice, the teacher
offers feedback and helps Charlie learn the self-management
procedures. Finally, the self-management plan is implemented
in “authentic” settings. In Charlie’s case, this means he
demonstrates appropriate behavior during transitions within the
classroom, while in line, and during lunch and recess. Figure
7.1 Self-Monitoring Worksheet for Charlie Self-Management
Techniques Teachers often use five common techniques of self-
management to help students regulate their own behavior: goal
setting, self-instruction, self-monitoring, self-evaluation, and
self-reinforcement (Mooney, Ryan, Uhing, Reid, & Epstein,
2005). Goal Setting As part of ringing in the New Year, many
adults begin self-improvement plans by engaging in goal
setting. They may set goals for getting in shape, eating healthy,
or learning a new hobby. Students can also set goals, and they
can be taught how to do so. In the classroom, students set goals
for performance in both academic and behavioral areas. Here we
focus on student goal setting for behavior improvement. In
setting a behavior improvement goal, it is best to address a
behavior that the student can already perform in some situations
and that will result in positive outcomes when it is used in
naturally occurring environments. It is also recommended that
the student and teacher choose an emerging skill for the student
and set a goal to increase the student’s independent use of that
skill, rather than set a goal that the student will acquire a new
skill. It is useful for the teacher to have a discussion with the
student about what the student would like to have happen with
regard to his or her behavior. Finally, a student might select an
individual behavioral goal that is aligned with a classroom or
school-wide behavior expectation (Oakes et al., 2012). Self-
Instruction Prior to teaching the student self-instruction
strategies, the teacher should make sure that the behavioral goal
chosen during goal setting is observable and measurable. In
other words, the student needs to know what the target behavior
looks like in order to be able to record when it happens. For
31. example, if the target behavior chosen during goal setting is on-
task behavior, then the student should understand that on-task
behavior means that the student is either looking at the teacher
or looking at and engaging with materials during a lesson. Self-
instruction involves self-talk that assists in regulating
behaviors. It includes self-statements that students are taught to
use to direct their own behavior. That is, students literally talk
to themselves to help them finish tasks, solve problems, or
mediate social situations (Menzies, Lane, & Lee, 2009). Most
individuals have engaged in self-instruction at one time or
another, talking themselves through difficult tasks or situations.
When they do so silently, the self-instruction is covert.
Sometimes, however, people engage in overt self-instruction,
speaking to themselves aloud, especially for the most difficult
of tasks. Most guidelines for teaching self-instruction to
students have been adapted from seminal work by Meichenbaum
and Goodman (1971). In teaching self-instruction to a student,
the following steps can be used: The teacher models the task for
the student while talking aloud. The student performs the task
while the teacher talks aloud. The teacher uses a quiet voice and
the student talks aloud while performing the task. The student
whispers while performing the task. The teacher may mouth the
words to the task or use body language or facial expressions to
guide or prompt the student to complete the task. The student
performs the task while using silent self-instruction. Self-
Monitoring During self-monitoring, students observe their own
behaviors and self-record whether they are exhibiting particular
behaviors (Rafferty, 2010). A student can record the
occurrences of behavior to be decreased (e.g., talking without
permission) or behavior to be increased (e.g., time on task).
Examples of self-monitoring include crossing things off a to-do
list and tracking how much water one drinks in a day. In the
classroom, students can be taught to self-monitor just about any
behavior, from completing homework tasks to speaking out
inappropriately. Successful self-monitoring can enhance and
improve academic and social performance. Although self-
32. monitoring can be used in isolation, it is most often used in
tandem with self-evaluation, in which the student compares the
data collected from self-recording with an established
performance standard (Briesch & Chafouleas, 2009). Self-
recording can be cued or noncued. In cued self-recording,
students record their behavior when a signal is given. The signal
is usually a recorded tone, such as a chime or bell. When
students hear the tone, they indicate on a data collection sheet if
they are engaged in a given behavior at that time. In noncued
self-recording, students are asked to make a notation on a data
collection sheet each time they perform the target behavior. It is
recommended that teachers take the following steps in
implementing self-monitoring strategies with students: Select a
target behavior, if this was not done during the goal-setting
phase of the behavior management plan. Define the behavior in
observable, measurable terms. Help the student recognize
examples as well as nonexamples of the behavior. For example,
the teacher may ask the student, “Belinda, are you on task or off
task?” Instruct the student in the use of an appropriate data
collection system and its corresponding form. For example, for
discrete behaviors (those with a clear beginning and end), event
recording (recording each time the target behavior occurs) is
most appropriate (see Figure 7.2). To self-record continuous
behaviors, such as being on task, students might use time
sampling or interval recording (see Figure 7.3). Instruct the
student how to self-monitor. The student should be able to
determine the difference between engaging and not engaging in
the target behavior. Monitor the student during a practice data-
recording time period. The teacher may want to keep her own
record in order to compare accuracy. Fade the use of the
intervention, so that the student self-monitors without the
intervention. (Rafferty, 2010) Self-Evaluation During self-
evaluation, students compare their performance to a set criterion
(Menzies et al., 2009). Examples of self-evaluation include a
person’s assessment of his own job performance and an
athlete’s determination of how well she ran a race or played a
33. game. In the classroom, students may evaluate how well they
did in a musical performance, or they may assess their
participation in a group project. When a student uses self-
evaluation, he compares his own behavior to a predetermined
standard set either by the student himself or by the teacher.
Self-evaluation occurs after the student has collected data
during the self-monitoring phase of self-management of
behavior. Additionally, self-evaluation determines self-
reinforcement and therefore takes place before such
reinforcement. The self-monitoring charts presented in Figures
7.2 and 7.3 have been modified in Figures 7.4 and 7.5 to include
self-evaluation components. The addition of the “my
achievements” line allows the student to evaluate himself
against the goal that was set at the beginning of the self-
monitoring period. Figure 7.2 Self-Monitoring Chart for Class
Preparedness Figure 7.3 Self-Monitoring Chart for On Task
Behavior What Would You Do? Belinda Belinda is a sixth
grader in her first month at Sheffield Middle School. She is a
good student and is thrilled to be in middle school. She has
made a lot of friends and likes all her new classes and teachers.
She particularly likes that she moves from class to class and has
a different teacher for each class. Belinda’s teachers state that
she does well in class. She is very attentive, her time on task is
excellent, and she seems to learn new concepts quickly. The
only thing that Belinda seems to be struggling with is
remembering to bring her homework and the correct notebook
and materials to each class. For example, when she arrives at
math class, she has her English homework and her biology
notebook, but not her materials for math. She also usually
forgets her pencil, and the teacher does not accept work done in
pen in math class. As one of her teachers, what would you do to
help Belinda remember to bring the correct homework and
materials to each of her classes? Self-Reinforcement With self-
reinforcement, students manage their behaviors by rewarding
themselves when they successfully complete self-prescribed
activities (Bandura, 1976). Many of us have engaged in self-
34. reinforcement in our daily lives. For example, you may buy
yourself new clothes when you have lost 10 pounds or go out on
a Friday night with friends after you have completed your
workweek productively. The behavior management
interventions described above are more effective when
combined with self-reinforcement—that is, when students give
themselves reinforcers if they conclude they have met the
standard for the target behavior. Reinforcers may be points,
tokens, or activities—whatever the student decides. Figure 7.4
Self-Evaluation for Class Preparedness Figure 7.5 Time
Sampling or Interval Recording with Self-Evaluation When
using self-reinforcement strategies with students as part of a
behavior management plan, it is best to start with teacher-
initiated contingencies with which students are already
involved. Students may already be allowed to choose their own
reinforcers, such as extra computer time after finishing a
worksheet. The transition from teacher-mediated reinforcement
of behavior to student-managed reinforcement is made easier
when students are explicitly taught to use self-reinforcement.
Self-reinforcement may involve the students choosing their own
reinforcers, setting criteria for earning reinforcers, or both.
Goal setting, self-instruction, self-monitoring, self-evaluation,
and self-reinforcement form the basis for effective cognitive
behavior management interventions. The learning and behavior
of students with and without disabilities in the general
education classroom setting can be enhanced through the use of
self-management techniques (Moore et al., 2013). Furthermore,
self-management meets the criteria for being an evidence-based
practice that can be used across age groups and settings
(Rafferty, 2010). Case Study Jane and Ms. Daniels Jane is a
third grader at Abydos Elementary School. Her physical
education teacher, Ms. Daniels, has recently noticed that Jane
has been consistently arriving late at the gymnasium for class
after changing into her gym clothes in the locker room. Ms.
Daniels talks to Jane, and she finds out that Jane likes and can
do the activities in the class. It seems to Ms. Daniels that what
35. is making Jane late is that she is socializing in the locker room
rather than concentrating on changing clothes and getting to
class in a timely fashion. Ms. Daniels decides to use a self-
management strategy with Jane. Together, Jane and Ms. Daniels
define the target behavior as follows: Jane will leave the locker
room at 9:10 a.m. (in order to be on the gymnasium floor at
9:15) on 4 of 5 class days each week for 1 month. They design a
self-recording worksheet that consists of a chart with boxes for
20 days (5 days for 4 weeks) and tape it to the inside of Jane’s
locker. Jane puts a checkmark in a box each day she is ready to
leave the locker room and the clock says 9:10 a.m. If Jane is at
her station in the gym by 9:15 a.m., Ms. Daniels also records a
checkmark on a chart. So that Jane does not have to wait until
the end of the month for reinforcement, Jane and Ms. Daniels
decide that if Jane meets her goal for a week, she will be
allowed to pass out the equipment the following Monday. If
Jane meets her goal for the month, she will be allowed to be the
team leader for the activity of her choice during the next “free
choice” Friday. Additionally, every time Jane is on time and
ready for class by 9:15, Ms. Daniels gives her a thumbs-up.
Jane’s on-time arrival to PE class increases significantly over
the next few weeks. Eventually, Ms. Daniels is able to fade the
self-monitoring sheet and Jane continues to arrive to class on
time when she is reinforced, on a variable-interval schedule,
with being allowed to pass out team equipment. Problem-
Solving Strategies In addition to the components discussed
previously, cognitive behavior management programs rely on
students’ use of problem-solving strategies. Problem solving is
a “systematic process in which concerns are identified, defined,
actions taken, and solutions evaluated” (Miller & Nunn, 2001,
p. 472). Teachers need to provide problem-solving strategy
instruction for those students who fail to use effective problem-
solving strategies on their own (e.g., students with
emotional/behavioral disabilities). Teachers should provide
instruction in the area of problem solving just as they would
provide instruction in an academic subject. Modeling
36. appropriate problem-solving skills as part of daily classroom
routines is also important (Robinson, 2007). Teachers can use
self-instruction as an approach to teaching problem-solving
skills. Using a five-step process, students are first taught to
define the problem. Next, students identify as many solutions as
possible. Then, students evaluate the potential outcomes of the
possible solutions identified in the previous step. Next, students
choose and implement a solution. Finally, students evaluate the
outcome and begin the process over if the solution was not
successful (Robinson, 2007; Robinson, Smith, & Miller, 2002).
Social problem solving is the “process of solving all types of
problems that may affect a person’s ability to function in the
natural environment, or ‘real world’” (Isbell & Jolivette, 2011,
p. 32). Using a strategy called “stop, think, proceed,” students
use steps with visual cues and questions to prompt them through
the social problem-solving process. In the first phase, stop,
students recognize the emotional clues, take a few breaths to
calm down, and identify the problem. In the second phase,
think, students come up with possible solutions, evaluate each
solution, and decide which solution to try. In the final phase,
proceed, students carry out the solution, verify the outcomes,
and try another solution if the problem is unresolved (Isbell &
Jolivette, 2011). Social problem-solving strategies can be
integrated into class meetings (Gartrell, 2006) or group
discussions (Miller & Nunn, 2001) in which all students are
allowed to become participants who work together to solve a
problem. Class meetings should be regular activities in
classrooms, especially at the preschool and primary levels.
Holding class meetings on a consistent basis allows the group to
address students’ concerns before they become problems or
conflicts. Teachers and students are likely to appreciate the full
potential of class meetings when they are used to resolve
problems and conflicts that affect the whole group. Teachers
can be proactive leaders during classroom meetings by first
setting guidelines for interactions. Teachers should make sure
students understand that everyone will be given a chance to
37. speak, that students should listen to one another, and that
students should treat one another with respect. When solving
problems during class meetings, teachers should follow a five-
step procedure: Calm everyone, including themselves if
necessary, and orient the students to the process. Define the
problem cooperatively. Brainstorm possible solutions together.
Decide together on a plan using the solutions suggested. Take
an active role in guiding the plan’s implementation. (Gartrell,
2006, p. 55) Problem-solving instruction can also take place
within the framework of bibliotherapy. Bibliotherapy allows
students to identify with characters from books that are similar
to them, so that they can discuss their own behaviors and
situations through the safe distance of fictional characters
(Cook, Earles-Vollrath, & Ganz, 2006). Teachers can use
children’s literature to help students generate possible solutions
to problems. This happens as students discuss the conflict that a
character encounters and brainstorm and evaluate possible
solutions using a problem-solving method (Konrad, Helf, & Itoi,
2007). Teachers can use bibliotherapy in their classrooms by
engaging students in prereading, guided reading, postreading,
and problem-solving/reinforcement activities (Forgan, 2002).
During prereading, materials are selected and the teacher
activates students’ background knowledge in order to help them
link their past experiences to the content of the book they will
read. During guided reading, the teacher reads the book aloud to
the students. After finishing the book, the teacher may want to
allow students to react to the book by writing in journals before
discussion begins. During the postreading discussion, students
can first retell the story. Then the teacher asks probing
questions that help the students engage with the book’s main
character and the situation the character is facing. During the
ensuing discussion, students come to understand that others
experience the same problems they do and can gain insight into
the problem as they come up with possible solutions.
Throughout the discussion, the teacher should see students
passing through the stages of identification, catharsis, and
38. resolution as they learn to problem solve (Forgan, 2002).
During the final phase of teaching with bibliotherapy, students
can apply the I SOLVE problem-solving strategy, which uses
the following steps: I Identify the problem. S
Solution
s to the problem? O Obstacles to the solutions? L Look at the
solutions again—choose one. V Very good! Try it! E Evaluate
the outcome. (Forgan, 2002, p. 78) Allen and colleagues (2012)
have suggested four similar steps in the use of bibliotherapy:
Identify the problem. Come up with possible solutions.
Consider the consequences of different actions. Choose the best
solution. Finally, teachers should provide some type of
reinforcement activity so that students can practice applying the
solutions they have learned. A sample lesson plan that includes
the four steps of bibliotherapy is presented in Figure 7.6. Figure
7.6 Sample Bibliotherapy Lesson Plan Source: Adapted from
Forgan (2002). Anger Management Strategies In Chapter 1, we
discussed the distinction between classical conditioning, which
accounts for respondent behaviors, and operant conditioning.
The behavior management strategies examined so far in this
chapter are effective in either increasing appropriate behaviors
or decreasing inappropriate behaviors—that is, operant
behaviors, or learned behaviors. Some respondent behaviors,
particularly conditioned emotional responses, such as anger and
39. anxiety, can also be addressed using management strategies,
including relaxation techniques (Sarafino, 2012). Before
teaching anger management strategies to students, it is
important for teachers to help students understand that anger is
a human and sometimes common emotion. Everyone feels angry
at one time or another. Some individuals get angry more
frequently than others. Some students get angry over things like
bad grades, while others get angry over things like parents
fighting. Students need to understand that it is okay to feel
angry, but it is not okay is for them to hurt themselves or others
when they are angry. Students can be taught to recognize anger
and practice positive responses to anger. These responses might
include going for a walk, talking to someone, counting to 10,
writing about the feeling, or distracting oneself. Students who
demonstrate disruptive behavior in the classroom often have
problems expressing anger in acceptable ways. Some students
learned when they were young that they could control
circumstances and get what they wanted through anger. When
people gave into their aggressive behavior, the connection
between demonstrating inappropriate behavior when angry and
control was strengthened. These students need to learn
acceptable ways of showing frustration and anger. Teaching
students to manage anger, and other emotions, should begin
with young children in the preschool classroom. Cognitive
behavioral intervention (CBI) can provide students with the
40. skills they need to control anger and handle disappointment.
CBI strategies can help them to interact appropriately in school
and other settings (Robinson, 2007). In preschool and
elementary settings, many incidents occur in which children
bump into and knock over constructions made by others.
Sometimes students interpret these accidents as purposeful and
hostile acts. The “turtle technique” (Robin, Schneider, &
Dolnick, 1976) is a CBI strategy that has been used successfully
with preschool and kindergarten children. Through an
illustrative story, children are told about a turtle that has
problems at school because he does not stop and think: Little
Turtle was very upset about going to school. When he was there
he got into trouble because he fought with his mates. Other
turtles teased, bumped, or hit him. He then became angry and
started fights. The teacher then punished him. One day he met
the big old tortoise, who told him that his shell was the secret
answer to many problems. The tortoise told Little Turtle to
withdraw into his shell whenever he felt angry, and rest until he
felt better. Little Turtle tried it the next day and it worked. He
no longer became angry or started fights, his teacher now
smiled at him, and he began to like school. (Robin et al., 1976,
p. 450) The turtle technique consists of four basic steps:
Recognizing that you feel angry Thinking “stop” Going into
your “shell” and taking three deep breaths and thinking
calming, coping thoughts (“It was an accident. I can calm down
41. and think of good solutions. I am a good problem solver.”)
Coming out of your “shell” when calm and thinking of some
solutions to the problem (Joseph & Strain, 2010) This technique
can be adapted for use with both large and small groups.
Research findings support the use of a metaphor, such as this
technique’s turtle, in teaching relaxation strategies. In one
study, all children selected the “turtle game” as their favorite
technique over others, such as literal instruction, for engaging
in relaxation exercise (Heffner, Greco, & Eifert, 2003). In a
recent study, Drogan and Kern (2014) studied the use of the
turtle technique as a Tier 2 intervention with preschool children
who engaged in problem behavior. At the end of the
intervention, the researchers found a decrease in the level of
problem behavior for all participants. The primary goal of
strategies like the turtle technique and accompanying teaching
supports is to offer children the cognitive and behavioral
repertoire they need to be good managers of their feelings—
particularly those occasioned by frustrating and anger-
provoking circumstances (Joseph & Strain, 2010). Anger
management programs address a variety of skills, including
coping, emotional awareness, self-control, problem solving, and
relaxation (Candelaria, Fedewa, & Ahn, 2012). An example of
one such program is In Control (Kellner, 2001), which is
designed to teach coping skills to middle school students as a
way of managing anger. The program can be used with an entire
42. class, with small groups, or with individuals. It consists of step-
by-step lessons with teaching guidelines, materials, scripts, and
activities. The lessons and activities can be adapted to meet
student needs, abilities, and interests. Student Created
Aggression Replacement Education (SCARE) is a school-based
anger and aggression management program. The primary goals
of the program are to “teach young people how to control
impulsive, aggressive emotions, to encourage them to make
better decisions in responding to provocative situations, and to
provide alternatives to violent behavior” (Herrmann &
McWhirter, 2001, p. xxii). The program has 15 sessions and is
organized into three sections: recognizing anger and violence in
our community, managing/reducing anger in yourself, and
defusing anger and violence in others/prevention strategies.
(SCARE, which is considered a model program by the U.S.
Department of Justice’s Office of Juvenile Justice and
Delinquency Prevention and a promising program by the U.S.
Department of Education, is available at
http://www.arizonachildpsychology.com/The%20SCARE%20Pr
ogram.pdf.) The violence prevention curriculum Second Step
(Committee for Children, 2002) is designed to help children,
grades pre-K to 8, increase their social competency skills,
thereby reducing impulsive and aggressive behavior. The
elementary curriculum uses group discussion, modeling,
coaching, and practices to “increase students’ social
43. competence, risk assessment, decision-making ability, self-
regulation, and positive goal setting” (Office of Juvenile Justice
and Delinquency Prevention, n.d.). It includes empathy training,
impulse control, problem solving, and anger management. In
addition to this content, middle school students learn how to
deal with peer pressure and bullying, how to resist gang
pressure, and how to defuse fights. Stress Management
Strategies Students can use anxiety management/relaxation
training (AM/RT) interventions to manage anxiety caused by
stressors, both major and minor, in their lives. Individuals’
responses to stressors have impacts on their anxiety levels. If
they can learn more appropriate ways to respond to life’s
stressors, they can avoid the negative effects of anxiety,
including depression (Lane, Cook, & Tankersley, 2013).
Although AM/RT interventions vary in content, they tend to
have several common components. One of these is their
emphasis that “it is important for students to understand how
their stress and anxiety are related to feelings of depression and
how managing their reactions to stress can lessen depressive
symptoms” (Lane et al., 2013, p. 65). Another commonality is
the use of some form of progressive relaxation training, a
technique first described by Jacobson (1938) and later adapted
by Wolpe (1958). Relaxation Procedures Students’ anger, stress,
and anxiety can be tempered through the use of relaxation
procedures that are easy to learn. Anger management
44. interventions typically include relaxation exercises for stress
and anxiety reduction, and these exercises often focus breathing
(Gaines & Barry, 2008). Relaxation has been defined as “a state
of calmness with low psychological and physiological tension or
arousal” (Sarafino, 2012, p. 323). Relaxation therapy is an
effective, self-regulatory intervention that allows students to
develop direct self-control of their behaviors (Robinson, 2007).
Progressive muscle relaxation (PMR) and yoga are two
examples of relaxation technique approaches. The goal of PMR
is to improve daily performance by reducing factors such as
arousal (increases in muscle tension, respiration, and heart
rate), anxiety, tension, and stress, thus producing a relaxed and
calm state that is inconsistent with aggressive behavior. PMR
exercises consist of systematic tensing and releasing of
different muscle groups. While performing these exercises,
students gain increased awareness of the resulting sensations of
tension and relaxation (Lopata, Nida, & Marable, 2006). PMR
can be utilized in various settings, including the classroom,
with all types of students. For instance, one study examined the
effectiveness of PMR as an intervention for preventing
aggression in elementary students with emotional/behavior
disorders. Students who participated in PMR showed a
significant decrease in physical aggression following the
treatment phase, whereas students who did not participate in
PMR showed no change in physical aggression (Lopata, 2003).
45. Additional studies have demonstrated the positive psychological
and physiological effects of PMR (Gaines & Barry, 2008;
Lopata et al., 2006). When using PMR in the general education
or special education classroom, the teacher should use a calm
and reassuring tone of voice to provide students with a sense of
security and promote participation and relaxation. The PMR
technique is very adaptable and can be integrated into different
dynamics of the classroom routine and modified to
accommodate student needs (Lopata, 2003; Lopata et al., 2006).
Figure 7.7 details the PMR technique. In addition to PMR, yoga
is recommended as a relaxation technique in self-regulatory
intervention treatment. The National Institute of Mental Health
(2005) has suggested that mild exercise or yoga may have
positive effects on various aspects of mental and physical
health. Yoga therapy is one type of psychophysiological
treatment, and yogic practices (including breathing, relaxation,
and meditation techniques) have been found to influence the
activity of the autonomic nervous system in studies of
participants with and without externalizing and internalizing
behaviors. The yoga nidra relaxation technique has been found
to improve stability in amplitude and rate in breathing patterns
in boys between the ages of 10 and 15 with disruptive behavior.
Teachers can be trained to use this technique in the classroom
(Jensen, Stevens, & Kenny, 2012). Figure 7.7 Progressive
Muscle Relaxation Summary Cognitive behavior management
46. includes intervention strategies designed to teach students to
control their own behaviors. It is considered a proactive
strategy in the universal design for classroom management.
Self-management techniques include goal setting, self-
instruction, self-monitoring, self-evaluation, and self-
reinforcement. Cognitive behavior management programs use
problem-solving strategies with students. Students who fail to
use effective problem-solving strategies on their own will
require problem-solving strategy instruction. The “stop, think,
proceed” technique is an example of a problem-solving strategy
that teachers might use. Additionally, bibliotherapy provides
opportunities for students to solve problems through the reading
and discussion of books. This procedure includes the steps of
prereading, guided reading, postreading, and problem-
solving/reinforcement activities. Anger management strategies,
such as the “turtle technique” for younger students and anger
management programs such as In Control, SCARE, and Second
Step, provide teachers with ways to help children and youth
manage their anger and aggression. Finally, progressive muscle
relaxation and yoga are two examples of relaxation procedures
that can help students manage stress.
The Evolution of Response-to-Intervention With the passage of
the Education for All Handicapped Children Act in 1975,
schools began identifying children with learning disabilities
through the use of a discrepancy model. Under such a model, a
47. child is identified as having a specific learning disability if
there is a severe difference between the child’s potential
(measured by IQ) and the child’s achievement. For example, if a
student has an average IQ score (around 100) and an average
score on achievement tests (again, around 100), then the student
is performing as expected. If a student has an IQ score of 100
and an average score of 65 on achievement tests, then a severe
discrepancy exists between the student’s potential and
achievement. The discrepancy model is objective and uses
statistical, quantitative procedures to identify learning
disabilities. Despite the advantages of this method, many
educators became concerned that the use of the discrepancy
model requires students to fail before they can be identified as
having learning disabilities. Additionally, the discrepancy
model is not practical for use with young students. As a result,
response-to-intervention was developed as an alternative to the
discrepancy model. Response-to-intervention (RTI) has been
conceptualized as a multitiered approach to the provision of
interventions and services at increasing levels of intensity for
students with academic and behavior problems. RTI became an
important intervention strategy after the passage of the No
Child Left Behind Act of 2001, which mandated that
educational professionals use scientifically based research
methods in instruction and interventions. Mirroring No Child
Left Behind, the Individuals with Disabilities Education
48. Improvement Act (IDEA, 2004) states that schools are no longer
required to use the discrepancy model when determining
whether a child has a learning disability, but “may use a process
that determines if the child responds to scientific, research-
based intervention as part of the evaluation procedures”
(Section 1414[b][6]). While response-to-intervention is not
mentioned in IDEA, the law emphasizes scientifically based
interventions as means to identify students with learning
disabilities (Sugai & Horner, 2009). Response-to-intervention is
not a new concept. It is an outgrowth of earlier prereferral
intervention strategies in which interventions were made in the
general education classroom before students were referred for
special education services. However, while accommodations
were developed for students with academic difficulties, these
interventions were not carried out to the degree needed to meet
the needs of the students. RTI provides interventions through an
inclusive service delivery model by integrating general
education and special education (Sanger, Friedli, Brunken,
Snow, & Ritzman, 2012). Although response-to-intervention
was initially developed as an alternative to the discrepancy
model for identifying students with learning disabilities, it is
increasingly being used to identify and provide interventions for
students with emotional and behavioral disorders (Fairbanks,
Sugai, Guardino, & Lathrop, 2007; Gresham, Hunter, Corwin, &
Fischer, 2013), autism spectrum disorders (Hammond,
49. Campbell, & Ruble, 2013), anxiety disorders (Sulkowski, Joyce,
& Storch, 2012), blindness and visual impairments (Kamei-
Hannan, Holbrook, & Ricci, 2012), and attention-
deficit/hyperactivity disorder (Vujnovic & Fabiano, 2011). As
part of a universal design for classroom management, RTI can
be used as a universal screening strategy and to provide
interventions for all students with academic, behavioral, and
emotional difficulties. Components of RTI The major
components of response-to-intervention include universal
screening, early intervention, problem solving with emphasis on
continuous progress monitoring, and increasingly intensive
interventions at different levels (National Association of State
Directors of Special Education, 2008). The basic premise of RTI
requires school personnel to develop effective instruction and
interventions using scientifically based methods appropriate to
the needs of the students. The three different levels or tiers of
RTI provide interventions and services at progressive levels of
intensity for students with academic and behavioral problems. If
a student shows adequate response to an intervention at the first
level, then he remains at that level and continues to receive the
intervention. However, if the student does not meet benchmarks
after he has received appropriate intervention, he is provided
services at the next level, which involves more intensive
instruction or interventions. If the student does not show
adequate response to the interventions at this stage, he proceeds
50. to the final level. The three levels of the standard treatment RTI
model are known as the primary, secondary, and tertiary tiers.
Primary Tier The primary tier is the “point of entry into
subsequent tiers” of response-to-intervention (Johnson, Melard,
Fuchs, & McKnight, 2006). This tier involves all students and
has three functions. First, culturally responsive teachers provide
high-quality instruction (Klingner & Edwards, 2006) and
effective classroom management within the general education
classroom. Teachers need to provide opportunities for
differentiated instruction with accommodations that allow all
students access to the high-quality instructional and behavior
programs of the primary tier (Fuchs, Fuchs, & Compton, 2012).
A number of strategies for universal design for classroom
management can be implemented at the primary tier. These
include development and implementation of a hierarchical
behavior management plan, development and implementation of
culturally responsive strategies, management of content,
management of conduct, teaching of routines and expectations,
equitable treatment, and universal interventions (see Chapters 2
and 5). Schools need to teach school-wide expectations to
students, consistently provide consequences for inappropriate
behaviors and acknowledgments of appropriate behaviors, and
review their progress toward meeting school-wide goals
(Fairbanks et al., 2007; Sanger et al., 2012). Second, the
primary tier provides for universal screening to identify
51. students who are at risk for academic, behavioral, and social
difficulties (Ferri, 2012). This universal screening generally
includes routine assessments of all students, including group
intelligence tests, achievement tests (such as state-mandated
examinations), and vision and hearing tests. For example,
Alexander, a second-grade student, is having difficulty paying
attention when his teacher presents lessons in class. A vision
examination reveals that Alexander is nearsighted and unable to
see the front of the classroom from his seat at the back of the
room. He is provided with eyeglasses and the teacher moves
him to the front of the classroom. As a result of these
interventions, Alexander now can focus on the lessons.
Universal screening may also include school data about
students, such as numbers of days absent or tardy, and
behavioral observations. Information on the frequency of and
reasons for a student’s time-outs or office referrals can shed
valuable light on the student’s academic and behavior
difficulties. During the screening process, teachers should use
the problem-solving model of response-to-intervention when
determining interventions for students with academic,
behavioral, and social difficulties. Teachers should develop
interventions based on individual students’ needs, working in
consultation with the students’ other teachers and the students’
parents. At the primary tier, many of the interventions for
students displaying inappropriate behaviors in the classroom are
52. basic classroom management strategies, such as positive and
negative reinforcement, token economies, and time-outs (see
Chapter 6). The final function of the primary tier is continuous
progress monitoring (Klingner & Edwards, 2006; Sanger et al.,
2012). Continuous progress monitoring is a procedure in which
a teacher gathers information on a student’s behaviors to
determine whether interventions are effective in modifying the
behaviors (Gresham et al., 2013). By implementing continuous
progress monitoring, teachers can determine whether students
are responding to the interventions that are provided and
making adequate progress or need to be referred to the next tier.
What Would You Do? Luis Luis is a first-generation Hispanic
student in the third grade. His parents emigrated from Mexico,
and the primary language the family speaks at home is Spanish.
Luis has had difficulty complying with requests made by Mrs.
Clarke, his general education teacher; Ms. Vermilyer, his music
teacher; and Mrs. Daily, his art teacher. He has not had any
difficulty in his class with Mr. Salyer, his teacher for physical
education. As a teacher, how would you develop a primary tier
of a response-to-intervention program for Luis? Secondary Tier
When a student does not show adequate progress after receiving
appropriate interventions at the primary tier, she is provided
more intensive intervention at the secondary tier. The main
focus of the secondary tier is to provide specific services for
students with academic, behavioral, and social difficulties in
53. instructional groups that are smaller and more homogeneous
than those of the general education classroom (Sugai, O’Keeffe,
& Fallon, 2012). Along with smaller instructional groups, four
additional strategies increase the intensity of interventions for
students at the secondary tier: More teacher-centered instruction
More frequent instruction Increased duration of instruction
Inclusion of educational personnel with greater expertise in
specific areas. (Fuchs & Fuchs, 2006, p. 94) Behavior and
classroom management strategies appropriate for the secondary
tier include contingency contracts (see Chapter 6), self-
management techniques (see Chapter 7), functional
communication training, differential reinforcements (see
Chapter 9), and social skills training (see Chapter 14). Teachers
also need to determine whether students’ inappropriate
behaviors stem from skill deficits or performance deficits when
trying to decide on interventions. A student who has a skill
deficit does not have the ability to perform the appropriate
behavior or skill. For example, Benjamin punches peers in the
arm because he does not know any other way to initiate a
conversation with a peer. Knowing that this is a skill deficit, the
teacher provides social skills training to address the deficiency.
Conversely, a student who has a performance deficit has the
ability to perform the appropriate behavior or skill but chooses
not to do so. For example, Natalie is always tardy to math class
because she does not like math class. Since this is a
54. motivational issue, the teacher may try to modify the behavior
through differential reinforcements. For example, if Natalie is
on time for class, she gets to pass out the math worksheets to
other students (a preferred activity). As with the primary tier,
teachers should continue to monitor students’ progress at the
secondary tier to determine whether they have made adequate
progress or need to be referred to the next tier. Tertiary Tier At
the final level of response-to-intervention, the tertiary tier,
students are provided intensive, individualized interventions
(Bradley, Danielson, & Doolittle, 2005; Sanger et al., 2012).
Interventions at the tertiary level often include functional
assessments of the unacceptable behaviors and behavior
intervention plans (Gresham et al., 2013). Again, continuous
progress monitoring should be incorporated at the tertiary level.
Teachers can use progress monitoring data to evaluate the
adequacy of student progress, determine when instructional
changes are necessary, and determine when modifications to
interventions are necessary. Additionally, teachers can use these
data to develop goals for students’ individualized education
programs if they need special education services (Stecker,
2007). Case Study Timothy Timothy is a fifth-grade student at
Washington Elementary School, a school that has adopted a
response-to-intervention program to identify at-risk students
and provide interventions designed to meet their academic,
behavioral, and social needs. Timothy’s teachers have noted
55. that he is not completing his assignments and is failing or close
to failing nearly all of his classes. Additionally, Timothy does
not interact with peers, often choosing to keep to himself.
School records indicate that he had some academic and social
difficulties last year, but not to the extent he is having
difficulties this year. During the primary tier of response-to-
intervention, Timothy was provided differential instruction with
accommodations in many of his classes. He was allowed more
time to complete assignments, was provided with peer tutors,
and had the numbers of questions on examinations reduced. A
review of Timothy’s performance on a state-mandated
standardized test revealed that while he scored poorly on the
test because of a number of unanswered questions, the answers
he did provide were generally correct. Unfortunately,
continuous progress monitoring showed that the interventions
Timothy received were not effective, even though universal
screening seemed to indicate that Timothy had the ability to do
his academic assignments. The at-risk team determined that
Timothy needed to move to the next tier for more intensive
interventions. At the secondary tier, Timothy received
instruction with a small of group of students also experiencing
academic difficulties. Believing that Timothy’s difficulties
stemmed from a performance deficit, the at-risk team
implemented various types of differential reinforcement as a
primary intervention, but it was difficult finding an alternative
56. behavior that was effective with Timothy. Additionally,
Timothy was provided social skills training in an effort to
improve his peer interactions. However, continuous progress
monitoring indicated that the interventions at the secondary tier
were ineffective; in fact, Timothy’s academic and social
difficulties had increased. He was no longer attempting to
complete assignments or making any effort to interact with
peers. Timothy was moved to the tertiary tier, where he was
provided intensive, individualized instruction and interventions.
A voluntary classroom assistant was assigned to Timothy to
help him with his assignments. Differential instruction and
differential reinforcements were continued. Additionally, a
clinical mental health counselor from the community was asked
to evaluate Timothy. She determined that Timothy was suffering
from depression. Timothy’s parents were never married, and his
father was increasingly absent from Timothy’s life. The pain of
his father’s absence became more acute for Timothy as he grew
older. The at-risk team determined that Timothy should remain
on the tertiary tier with weekly counseling sessions to treat the
depression. However, if Timothy did not show any improvement
in a reasonable amount of time, the team would refer him for a
nondiscriminatory evaluation to determine whether he might
qualify for classification as a student with emotional and
behavioral disorders. While response-to-intervention was
initially conceived as an alternative method for identifying
57. students with learning disabilities, it has evolved into a strategy
for addressing the academic, behavioral, and social difficulties
of all students. As a result, disagreements have arisen regarding
whether special education should have a role in RTI (Fuchs et
al., 2012). Since special education teachers often have expertise
that many general education teachers do not have, their
involvement in the development of intensive, individualized
interventions at the tertiary tier can be helpful. However, the
tertiary tier should not be considered the “special education
level”; rather, it is the level at which experts provide intensive
interventions in the general education setting. Under a universal
design for classroom management, response-to-intervention
should be embedded in the second level of a school-wide
positive behavior support program (see Chapter 13). If a student
does not make adequate progress at this level, she should move
to the third level, or comprehensive level, of the school-wide
positive behavior support program. At this level, the student
should receive a nondiscriminatory evaluation. The Individuals
with Disabilities Education Improvement Act requires a
nondiscriminatory evaluation to determine if a student has a
disability and whether the child needs special education and
related services. A culturally sensitive, multidisciplinary team
should conduct the nondiscriminatory evaluation and compile
student data based on a variety of assessments. These
assessments must be free of cultural and linguistic biases. RTI
58. and Culturally and Linguistically Diverse Students Response-to-
intervention can improve educational opportunities for
culturally and linguistically diverse students by providing
supports and interventions to meet these students’ academic,
behavioral, and social needs (McKinney, Bartholomew, & Gray,
2010; Xu & Drame, 2008). Additionally, RTI has the potential
to address long-standing issues of equity in the representation
of culturally and linguistically diverse learners among students
with learning disabilities and emotional and behavioral
disorders (Artiles, Bal, & King Thorius, 2010). However, some
education professionals have raised concerns that, owing to the
rapid acceptance of response-to-intervention, little empirical
evidence exists to support the efficacy of RTI for culturally and
linguistically diverse students (Artiles et al., 2010; Reynolds &
Shaywitz, 2009). Response-to-intervention is predicated on the
belief that students receive high-quality instruction and
effective behavior and classroom management strategies.
However, teachers cannot assume that instructional and
behavior strategies that work for European American students
will also work for culturally and linguistically diverse students.
Teachers need to determine whether students with academic and
behavioral difficulties, particularly culturally and linguistically
diverse students, are receiving adequate instruction in the
general education classroom (Klingner & Edwards, 2006). A
strong foundation of high-quality instruction and effective
59. behavior management strategies is necessary at the primary
level if RTI is to be successful. Figure 12.1 Tiers of Response-
to-Intervention RTI can also give teachers false confidence that
assessments and instructional practices are aligned with the
educational needs of culturally and linguistically diverse
students (Orosco & Klingner, 2010). In other words, teachers
might believe that since assessments and instructional practices
are scientifically based, they are effective for all students.
However, culturally and linguistically diverse students are often
not included when benchmarks for assessments and instructional
practices are normed (Linan-Thompson, Cirino, & Vaughn,
2007). Thus, diverse students are often provided interventions
and more restrictive services based on invalid assessment data.
Many teachers assume that the implementation of response-to-
intervention removes cultural bias from their decisions to move
students from one tier to another or to refer students for special
education services. As a result, they employ the same deficit-
based assumptions as the discrepancy model—that is, they
assume that students who exhibit academic or behavioral
difficulties do not have the ability to perform well academically
or behave appropriately (Ferri, 2012; Klingner & Edwards,
2006). As part of a universal design for classroom management,
teachers must consider the needs of culturally and linguistically
diverse students when developing and implementing the
response-to-intervention model in schools. Teachers need to
60. reflect on whether their behavior and classroom management
strategies are effective with culturally and linguistically diverse
students and whether these strategies are in conflict with the
cultural backgrounds of students. For example, research has
shown that structured cooperative methods and small-group
instruction are effective with culturally and linguistically
diverse students (Calderón, Slavin, & Sánchez, 2011). These are
especially important strategies for the primary level, where
cooperative learning can be effective for diverse students who
put the needs of the group first. Teachers should also
incorporate local norms, or local achievement levels, that
include culturally and linguistically diverse students in
continuous progress monitoring procedures (Linan-Thompson et
al., 2007). Since it should be used in all three tiers, continuous
progress monitoring that accurately evaluates the progress of
diverse students is crucial for providing culturally responsive
instruction and behavior management for students. The need to
use reliable norms that include diverse students applies also to
assessments used for nondiscriminatory evaluations at the
tertiary tier. To put it simply, the use of strategies and
assessments that do not consider the characteristics of culturally
and linguistically diverse students is unacceptable in behavior
and classroom management programs. Concerns of RTI
Although RTI has gained national acceptance, some education
professionals have voiced concerns regarding its
61. implementation and effectiveness. RTI is aligned with the
premise of inclusion and a universal design for classroom
management, but little empirical research has been conducted
on the efficacy of the approach (Ferri, 2012). This lack of
research is most problematic for the implementation of the
primary tier (Hill, King, Lemons, & Partanen, 2012; Xu &
Drame, 2008), which is where all students should be provided
high-quality, evidence-based instruction and behavior
management strategies. The primary tier is the gateway to the
succeeding levels and the foundation on which interventions and
strategies for the secondary and tertiary tiers are based. High-
quality instruction, effective behavior management strategies,
universal screening, and continuous progress monitoring are
essential elements of an effective RTI program. If the primary
tier is not fully implemented, a number of students will be
moved inappropriately to the secondary tier. Further, teachers
may assume that students who do not respond to instruction or
interventions are deficient and need more intensive
interventions. Such assumptions are often supported by the
belief that instruction and interventions embedded in RTI
programs are evidenced based. However, this does not consider
the fact that what may be effective for a majority of students is
not effective for all students (Ferri, 2012). This belief is the
complete antithesis of inclusion, differential instruction, and a
universal design for classroom management, and it reduces
62. response-to-intervention to a deficit-based model similar to the
discrepancy model. It is assumed that the student is deficient
rather than the instructional strategies or interventions.
Teachers and administrators need to determine whether students
with academic, behavioral, and social difficulties are receiving
adequate instruction and interventions in the general education
classroom before making decisions regarding response-to-
intervention. Finally, RTI does not include a formal process for
evaluating the cognitive ability of students; such a process
could lead to identifying slow learners as having specific
learning disabilities (Lindstrom & Sayeski, 2013). Additionally,
response-to-intervention cannot differentiate specific learning
disabilities from emotional and behavioral disorders,
intellectual disabilities, attention-deficit/hyperactivity disorder,
or other disabilities (Mastropieri & Scruggs, 2005). For
response-to-intervention to be effective in providing preventive
and intervention strategies for all students with academic,
behavioral, and social difficulties, administrators and teachers
must be fully committed to making it work. The essential
elements of a successful RTI program are as follows: A
scientifically based method of screening a large number of
students who are at risk for academic, behavioral, and social
difficulties Teachers who have the knowledge and pedagogy to
provide high-quality core academic instruction and effective
behavior and classroom management strategies Evidence-based
63. continuous progress monitoring Well-defined benchmarks to
determine whether students are responding to academic and
behavior interventions Resources to implement supplemental
strategies and programs for students who are at risk for
academic, behavioral, and social difficulties (Vaughn & Fuchs,
2003) If teachers and school administrators are not committed
to implementing an effective program, response-to-intervention
becomes another deficit-based method in which teachers feel
justified in moving students from one tier to another until they
are referred for special education services or more restrictive
settings. Response-to-intervention is not simply noticing that
students are having difficulties, providing them with
interventions, and checking their progress (Barnes & Harlacher,
2008). It is a carefully developed and implemented program that
addresses the academic, behavioral, and social needs of all
students by providing evidence-based instruction, interventions,
strategies, and evaluation at all levels. Summary Response-to-
intervention has fundamentally changed general education into a
multilevel system of early intervention (e.g., National
Association of State Directors of Special Education & Council
of Administrators of Special Education, 2006). While RTI was
initially developed as an alternative to the discrepancy model
for identifying students with learning disabilities, it is
increasingly being used to identify and provide interventions for
all students with academic, behavioral, and social difficulties.
64. Response-to-intervention has three levels or tiers of progressive
intensity for providing interventions and services for students
with academic and behavior problems. The primary tier
provides all students with high-quality instruction and effective
classroom management, universal screening, and continuous
progress monitoring. The secondary tier provides specific
services for students in smaller and more homogeneous
instructional groups. The tertiary tier provides students with
intensive, individualized interventions. Response-to-
intervention has the potential to improve educational
opportunities for culturally and linguistically diverse students
by providing them with appropriate supports and interventions.
Additionally, RTI may provide a means of addressing the issue
of overrepresentation of culturally and linguistically diverse
students in special education (Artiles et al., 2010). Teachers
need to consider the needs of culturally and linguistically
diverse students when developing and implementing a response-
to-intervention model. Teachers should also incorporate local
norms that include culturally and linguistically diverse students
in continuous progress monitoring procedures. Some education
professionals have voiced concerns regarding the
implementation and effectiveness of response-to-intervention,
and little empirical research has examined the efficacy of RTI.
Essential elements of an effective RTI program include high-
quality instruction, appropriate interventions and behavior
65. management strategies, universal screening, and continuous
progress monitoring. An effective response-to-intervention
program should be part of a systemic school-wide positive
behavior support program (Hernández Finch, 2012).
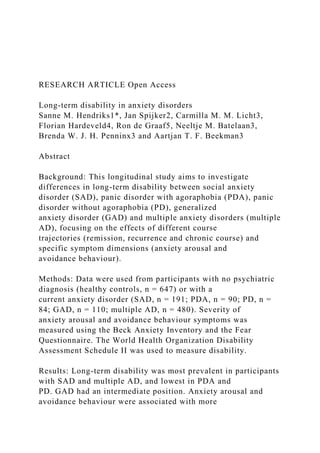
![long-term disability in anxiety disorders than course
trajectories.
Conclusions: Various anxiety disorders have different disability
levels over 4 years of time, therefore diagnostic
distinction is important for treatment focus. Anxiety arousal and
avoidance behaviour are major predictors for
long-term disability in anxiety disorders.
Background
Disability is often defined as ‘any restriction or lack of
capacity to perform an activity in a manner or within a
range considered normal for a human being’ [1]. Anxiety
disorders are associated with severe disability [2–6] and
the negative impact of anxiety is substantial [3, 7, 8].
Previous research showed that anxiety disorders differ in
disability levels. Overall, multiple anxiety disorders (mul-
tiple AD, i.e. comorbidity with other anxiety disorders)
are associated with more disability than pure anxiety dis-
orders [9]. Furthermore, social anxiety disorder (SAD)
and generalized anxiety disorder (GAD) are associated
with higher disability levels compared to panic disorder,
[3, 10–12] although other research points out otherwise
[13–15]. However, it remains unclear whether contrasts
in disability levels among anxiety disorders persist over a
longer period.
More severe symptoms and more comorbidity are associ-
ated with a chronic course in anxiety disorders [16–20].
Therefore, we expect that long-term disability is more com-
mon in anxiety patients with a chronic course. However,
some research gave indications that disability can still be
present after remission of the anxiety disorder [21]. Because
SAD and multiple AD are more strongly associated with a
chronic course than other anxiety disorders [19, 22–24] we](data:image/gif;base64,R0lGODlhAQABAIAAAAAAAP///yH5BAEAAAAALAAAAAABAAEAAAIBRAA7)