This document summarizes a systematic review of 56 studies that validated online psychometric instruments for common mental health disorders. The following key points were reported:
- The studies evaluated 62 different online instruments for conditions like depression, anxiety disorders, stress, and suicidal ideation.
- Several instruments like the CES-D and MADRS-S for depression have accumulating evidence for adequate psychometric properties in online formats. However, evidence is scattered across different instruments and characteristics.
- Few studies included patient populations, with most recruiting samples from the general community or university students.
- The review provides an overview of validated online instruments but also indicates a need for more research, especially among clinical groups.
![RESEARCH ARTICLE Open Access
Validation of online psychometric
instruments for common mental health
disorders: a systematic review
Wouter van Ballegooijen1,2,3*
, Heleen Riper2,3
, Pim Cuijpers2,3
, Patricia van Oppen1,3
and Johannes H. Smit1,3
Abstract
Background: Online questionnaires for measuring common mental health disorders such as depression and
anxiety disorders are increasingly used. The psychometrics of several pen-and-paper questionnaires have been
re-examined for online use and new online instruments have been developed and tested for validity as well. This
study aims to review and synthesise the literature on this subject and provide a framework for future research.
Methods: We searched Medline and PsycINFO for psychometric studies on online instruments for common mental
health disorders and extracted the psychometric data. Studies were coded and assessed for quality by independent
raters.
Results: We included 56 studies on 62 online instruments. For common instruments such as the CES-D, MADRS-S
and HADS there is mounting evidence for adequate psychometric properties. Further results are scattered over
different instruments and different psychometric characteristics. Few studies included patient populations.
Conclusions: We found at least one online measure for each of the included mental health disorders and
symptoms. A small number of online questionnaires have been studied thoroughly. This study provides an
overview of online instruments to refer to when choosing an instrument for assessing common mental health
disorders online, and can structure future psychometric research.
Keywords: Internet, Depression, Anxiety, Measurement, Psychometrics, Systematic review
Background
Assessment of common mental health disorders, which
include depression and anxiety disorders [1], is increas-
ingly conducted online, usually employing self-report
questionnaires. Current online instruments are often
paper questionnaires that have been adapted for online
use [2]. Paper and online versions of the same instru-
ment correlate strongly, but mean scores and psycho-
metrics may differ [2] and, therefore, equivalence cannot
be assumed.
Several studies have re-examined the psychometrics of
paper questionnaires for use online, e.g. for measuring
social phobia [3], panic and agoraphobia [4] and
depression [5]. Besides the established paper instruments
that are used online, new instruments are being devel-
oped and investigated for validity specifically for use on-
line. These instruments can have technological
advantages, such as the use of audio and video [6, 7], or
automatically skipping irrelevant items based on previ-
ous answers [8].
To date, the psychometrics of both the digitalised
paper questionnaires and newly developed online instru-
ments have not been systematically studied. An overview
and synthesis of the literature would provide a frame-
work for future research and development, and would
guide researchers, clinicians and other professionals
when choosing an instrument suitable for a specific pur-
pose. The current study aims to systematically review
and synthesise the scientific literature on the psychomet-
rics of internet-based instruments that measure common
mental health disorders and related symptoms. We aim
* Correspondence: w.van.ballegooijen@vu.nl
1
Department of Psychiatry, VU Medical Centre / GGZ inGeest, Amsterdam,
Netherlands
2
Department of Clinical Psychology, Vrije Universiteit Amsterdam,
Amsterdam, Netherlands
Full list of author information is available at the end of the article
© 2016 van Ballegooijen et al. Open Access This article is distributed under the terms of the Creative Commons Attribution
4.0 International License (http://creativecommons.org/licenses/by/4.0/), which permits unrestricted use, distribution, and
reproduction in any medium, provided you give appropriate credit to the original author(s) and the source, provide a link to
the Creative Commons license, and indicate if changes were made. The Creative Commons Public Domain Dedication waiver
(http://creativecommons.org/publicdomain/zero/1.0/) applies to the data made available in this article, unless otherwise stated.
van Ballegooijen et al. BMC Psychiatry (2016) 16:45
DOI 10.1186/s12888-016-0735-7](https://image.slidesharecdn.com/60a327b5-f4e4-42b6-b277-54ac7740d7ff-161110111818/75/Validation-of-Psychometric-Properties-1-2048.jpg)
![to provide an overview of the psychometric characteris-
tics of these instruments, the evidence for these charac-
teristics, and an indication of how these findings can be
generalised to various populations.
Methods
This systematic review was conducted in accordance with
the PRISMA Statement [9]. See Additional file 1. The ex-
traction of psychometric data was based on the
COnsensus-based Standards for the selection of health sta-
tus Measurement Instruments (COSMIN) Checklist. [10]
Study selection
We conducted a comprehensive literature search in
PubMed and PsycInfo, which is updated up to January
1st 2014. For the PubMed search we applied a previously
developed search string for psychometric studies [11]
and additional key words to focus on online assessment
and common mental health disorders (Additional file 2).
The PsycInfo search was a translation of the PubMed
search, with additional keywords unique to PsycInfo and
the omission of generic terms such as ‘methods’ and ‘in-
strumentation’, to increase the specificity of the search
(Additional file 2).
Study inclusion
After excluding studies that were not written in English,
studies were included in three a priori defined steps, as
depicted in the flow chart (Fig. 1). The first inclusion
step was to select all studies that applied online self-
report assessments, i.e. data were collected using
internet-connected devices that individuals used to fill in
questions about themselves. We excluded assessments
through stand-alone devices (e.g. in a clinic), or other
self-report measurement within a clinic, in order to re-
tain comparability between results. We also excluded
studies on assessments through unique devices specific-
ally developed for the study, face-to-face interviews con-
ducted by videoconference, and interactive voice
response measures by telephone. As second inclusion
step, we included only those studies that aimed at asses-
sing psychometrics and that provided data of at least
one psychometric variable. The third and final inclusion
step included studies that described instruments for
assessing symptoms of common mental health disorders
[1]. These disorders include ICD-10 [12] and DSM-5
[13] unipolar depressive disorders, social phobia, panic
disorder with or without agoraphobia (PD/A), agorapho-
bia without panic, specific phobia, generalised anxiety
disorder (GAD), post-traumatic stress disorder (PTSD)
and obsessive-compulsive disorder (OCD). We also in-
cluded instruments that assessed specific symptoms of
these disorders or general distress that can accompany
these disorders, i.e. psychological stress (only when un-
related to physical disorders), worrying, suicidal ideation
and self-harm.
Data extraction
First, we coded the data that are relevant for generalising
a study’s findings, which are the sample size, characteris-
tics of the participants (age, gender, disease characteris-
tics), population (e.g. patients or general population),
recruitment method, country in which the study was
conducted, language of the measurement instrument,
Literature search
PubMed: 2644 hits
PsycINFO: 762 hits
2839 papers assessed for eligibility
Excluded:
392 duplicates
145 not in English
30 errata, conference proceedings, etc.
1159 papers applied online measurement
194 papers on psychometrics
56 papers included
62 papers on instruments that measure
depression, anxiety, stress, self-harm, or
suicide ideation
Excluded:
6 papers did not report relevant data
Fig. 1 Flow chart of included studies
van Ballegooijen et al. BMC Psychiatry (2016) 16:45 Page 2 of 12](https://image.slidesharecdn.com/60a327b5-f4e4-42b6-b277-54ac7740d7ff-161110111818/75/Validation-of-Psychometric-Properties-2-2048.jpg)
![any subgroups the results were reported for, and amount
of missing data. Next, we extracted the psychometric data
provided in the study. The following variables were en-
tered into the tables (Tables 1, 2, 3 and 4; Additional file
3): internal consistency (usually expressed as Cronbach’s
alpha); test-retest reliability (usually kappa); measurement
error; factor structure, including type of analysis (explora-
tory or confirmatory factor analysis, or principal compo-
nent analysis) and model fit or variance explained;
equivalence of paper and online versions of the instru-
ment (usually a correlation); difference in mean scores be-
tween online and paper versions; convergent validity, i.e.
the relation with an instrument that measures the same
construct (usually a correlation); criterion validity in terms
of sensitivity, specificity (for the optimal cut-off point),
Area Under the Receiver Operating Characteristic Curve
(AUC), and other criterion-related outcomes (e.g. kappa);
and responsiveness, i.e. the degree to which the instru-
ment can measure change. These variables were extracted
for each instrument reported in the study. When an in-
strument was investigated in multiple samples, e.g. when
two studies on one instrument were described in one
paper, we listed the sample characteristics and outcomes
for each sample separately.
Criterion validity requires a criterion such as a diagno-
sis that can be objectively measured, but there is no
exact method to ascertain any of the included disorders.
Nevertheless, some psychometric studies do aim to as-
sess criterion validity, and the criterion is established by
an interview conducted face-to-face or by telephone by a
clinician or a trained interviewer. We report these data,
because it is not within the scope of the present review
to discuss the validity of the used criteria.
Quality assessment
Quality assessment was conducted in two ways. First, we
coded variables that affect the generalisability and risk of
bias of the findings, which are sample size, sample char-
acteristics, recruitment method and amount of missing
data. Second, we used the COSMIN Checklist with a 4-
point scale [10, 14–17]. This checklist contains quality
criteria for the psychometric variables described above.
For each variable, a quality score is obtained by taking
the lowest rating of any item in that list of criteria [10].
Double coding
The inclusion process was conducted by two independ-
ent raters (WvB and a research assistant). Differences
Table 1 Transdiagnostic online self-report instruments and the number of studies that report psychometric characteristics (between
parentheses)
Instrument Purpose N
studies
Population
/ setting
Countries in
which the studies
were conducted
Internal
consistency
(alpha)
Test-retest
reliability
Factor
structure
Mean score
difference with
paper version
Convergent
validity
Criterion
validity
(AUC)
Anxiety
BAI Symptom
severity
3 G1, P3 SE .88–.89 (2) 4 factors (1) None, lower (2)
Depression and anxiety
CIDI-SF Diagnosis
&
screening
1 G1 SE (1)
DASS Symptom
severity
1 G5 US .93–.95 (1) (1) (1)
HADS Screening
& symptom
severity
5 G1, G5, P5,
P7
NZ, SE, UK .76–.88 (5) (1) 3 factors (2) None (2) (1)
SQ-48 Screening
& symptom
severity
1 G1, P1 NL .84–.93 (1) 9 factors (1) (1) .75–.91 (1)
WB-DAT Screening 1 P8 CA (1)
WSQ Screening 1 G1 NL .65–.81 (1)
Depression and anxiety
(postpartum)
PDM Screening 1 G1 US .84–.88 (1) 2 factors (1) (1)
G1: General population; G2: Adult females; G3: Adult males; G4: General teenage population; G5: Student population; G6: General young adult population; G7:
Veteran population; P1: Patient population; P2: Adult psychiatric outpatients; P3: Adult social phobia patients; P4: Adult GP patients; P5: Hearing impaired clinical
population; P6: Deaf population; P7: Adults with chronic fatigue syndrome; P8: Participants in studies of the Centre for Addiction and Mental Health; AU: Australia;
CA: Canada; DK: Denmark; ES: Spain; NL: Netherlands; NO: Norway; NZ: New Zealand; SE: Sweden; TW: Taiwan; UK: United Kingdom; US: United States; AUC: Area
Under the Receiver Operating Characteristic Curve
van Ballegooijen et al. BMC Psychiatry (2016) 16:45 Page 3 of 12](https://image.slidesharecdn.com/60a327b5-f4e4-42b6-b277-54ac7740d7ff-161110111818/75/Validation-of-Psychometric-Properties-3-2048.jpg)
![between raters were solved by discussion and by confer-
ring with the co-authors. Three of the authors of this
study (WvB, JHS, PvO) and three other raters (research
assistants) participated in the data extraction and quality
assessment of the included studies. We double coded all
extracted data, including the four variables that may
affect generalisability and risk of bias. The COSMIN
quality ratings were mostly single coded, where 18 % of
the included studies were double coded.
Data synthesis
All extracted data (Additional file 3) were sorted on dis-
order or symptom and on instrument name, thereby cre-
ating a table of instruments for each disorder (Tables 1,
2, 3 and 4). When a study investigated multiple instru-
ments for multiple disorders (e.g. one instrument that
measures depression and one that measures anxiety), we
reported the instruments in the table for the appropriate
disorder. We created a separate table for instruments
that measured multiple disorders or general symptoms.
It was not possible to synthesise the data in a quantita-
tive analysis, such as a meta-analysis, because the in-
cluded studies investigated a variety of instruments,
applying various methods to obtain psychometric data
and reporting various outcome measures.
Results
Study selection
The PubMed search yielded 2644 results and the Psy-
cINFO search added 370 unique studies (Fig. 1). After
excluding studies that were not in English and search re-
sults that were irrelevant studies, we assessed 2839 stud-
ies for eligibility (Fig. 1). Step one of the inclusion, i.e.
assessment was conducted using online self-report in-
struments, left 1159 studies. Of these, 194 investigated
and reported psychometric data (step 2). Next, we in-
cluded 62 studies that investigated instruments for
assessing common mental health disorders (step 3). Fi-
nally, we excluded 6 studies that did not report psycho-
metric data that were relevant for our overview and
synthesis, so we included 56 studies in our review. See
Fig. 1 for a flow chart.
Study characteristics
The details of the 56 included studies and their results
are presented in Additional file 3. Combined, these stud-
ies described psychometric data for 62 different instru-
ments. These studies and instruments are presented in
Additional file 3. The data are summarised in Tables 1,
2, 3 and 4. The samples of most studies (48 of 56) con-
tained a larger percentage of women (range 0 % to
100 %; Additional file 3). Seven studies included a sam-
ple with an average age below 20. Most studies recruited
their samples from the general population using
advertisements or links on websites (i.e. self-referral).
Also common were studies among university students.
Patient populations were less common, as 14 of the 62
instruments were investigated among patient popula-
tions. See Tables 1, 2, 3 and 4 and Additional file 3. All
56 of the included studies investigated internet-based in-
struments that were completed on a desktop, laptop or
tablet computer, while none of the studies reported that
their instruments were completed on cellular phones or
smartphones.
Outcomes
We found instruments for all of the included mental
health disorders. An average of 2.5 psychometric charac-
teristics were reported for each instrument. None of the
studies reported measurement error or responsiveness of
instruments. We left the empty columns of these two
outcomes in Additional file 3, but omitted them in Ta-
bles 1, 2, 3 and 4. Of the 62 investigated instruments, 29
assessed depressive symptoms. Of these, the CES-D and
the Montgomery–Åsberg Depression Rating Scale Self
Report (MADRS-S) were most frequently studied (6
studies each). Least studied were instruments for meas-
uring suicidal ideation (1 study on 2 single items), self-
harm (1 study) and stress (1 study).
Transdiagnostic online instruments
Seven instruments assessed both depressive and anxiety
symptoms, or anxiety symptoms that apply to several
disorders, such as the Beck Anxiety Inventory (BAI).
These can be roughly divided in short instruments that
screen for disorders, e.g. the Web Screening Question-
naire (WSQ) [18] and the Web-Based Depression and
Anxiety Test (WB-DAT) [8], and scales that assess
symptom severity, e.g. the Hospital Anxiety and Depres-
sion Scale (HADS) [19] and the Depression Anxiety
Stress Scales (DASS) [20]. The short screening question-
naires had poor to adequate criterion validity for screen-
ing individual disorders [8, 18, 21]. Of the symptom
severity scales, the HADS was investigated in 5 studies
[19, 22–25]. These 5 studies showed a fair to good in-
ternal consistency. The online HADS is the only instru-
ment we found that was investigated among several
patient populations [19, 23, 24]. Although the factor
structure may be different from how the measure was
designed [19, 23], there is mounting evidence that sup-
port adequate validity of the online HADS.
Online assessment of depression
Our review includes 29 instruments that measure de-
pressive symptoms. These consist of 22 instruments that
measure depression alone and 7 transdiagnostic instru-
ments. The 22 studies on instruments for depression
generally reported recruiting their samples from the
van Ballegooijen et al. BMC Psychiatry (2016) 16:45 Page 4 of 12](https://image.slidesharecdn.com/60a327b5-f4e4-42b6-b277-54ac7740d7ff-161110111818/75/Validation-of-Psychometric-Properties-4-2048.jpg)
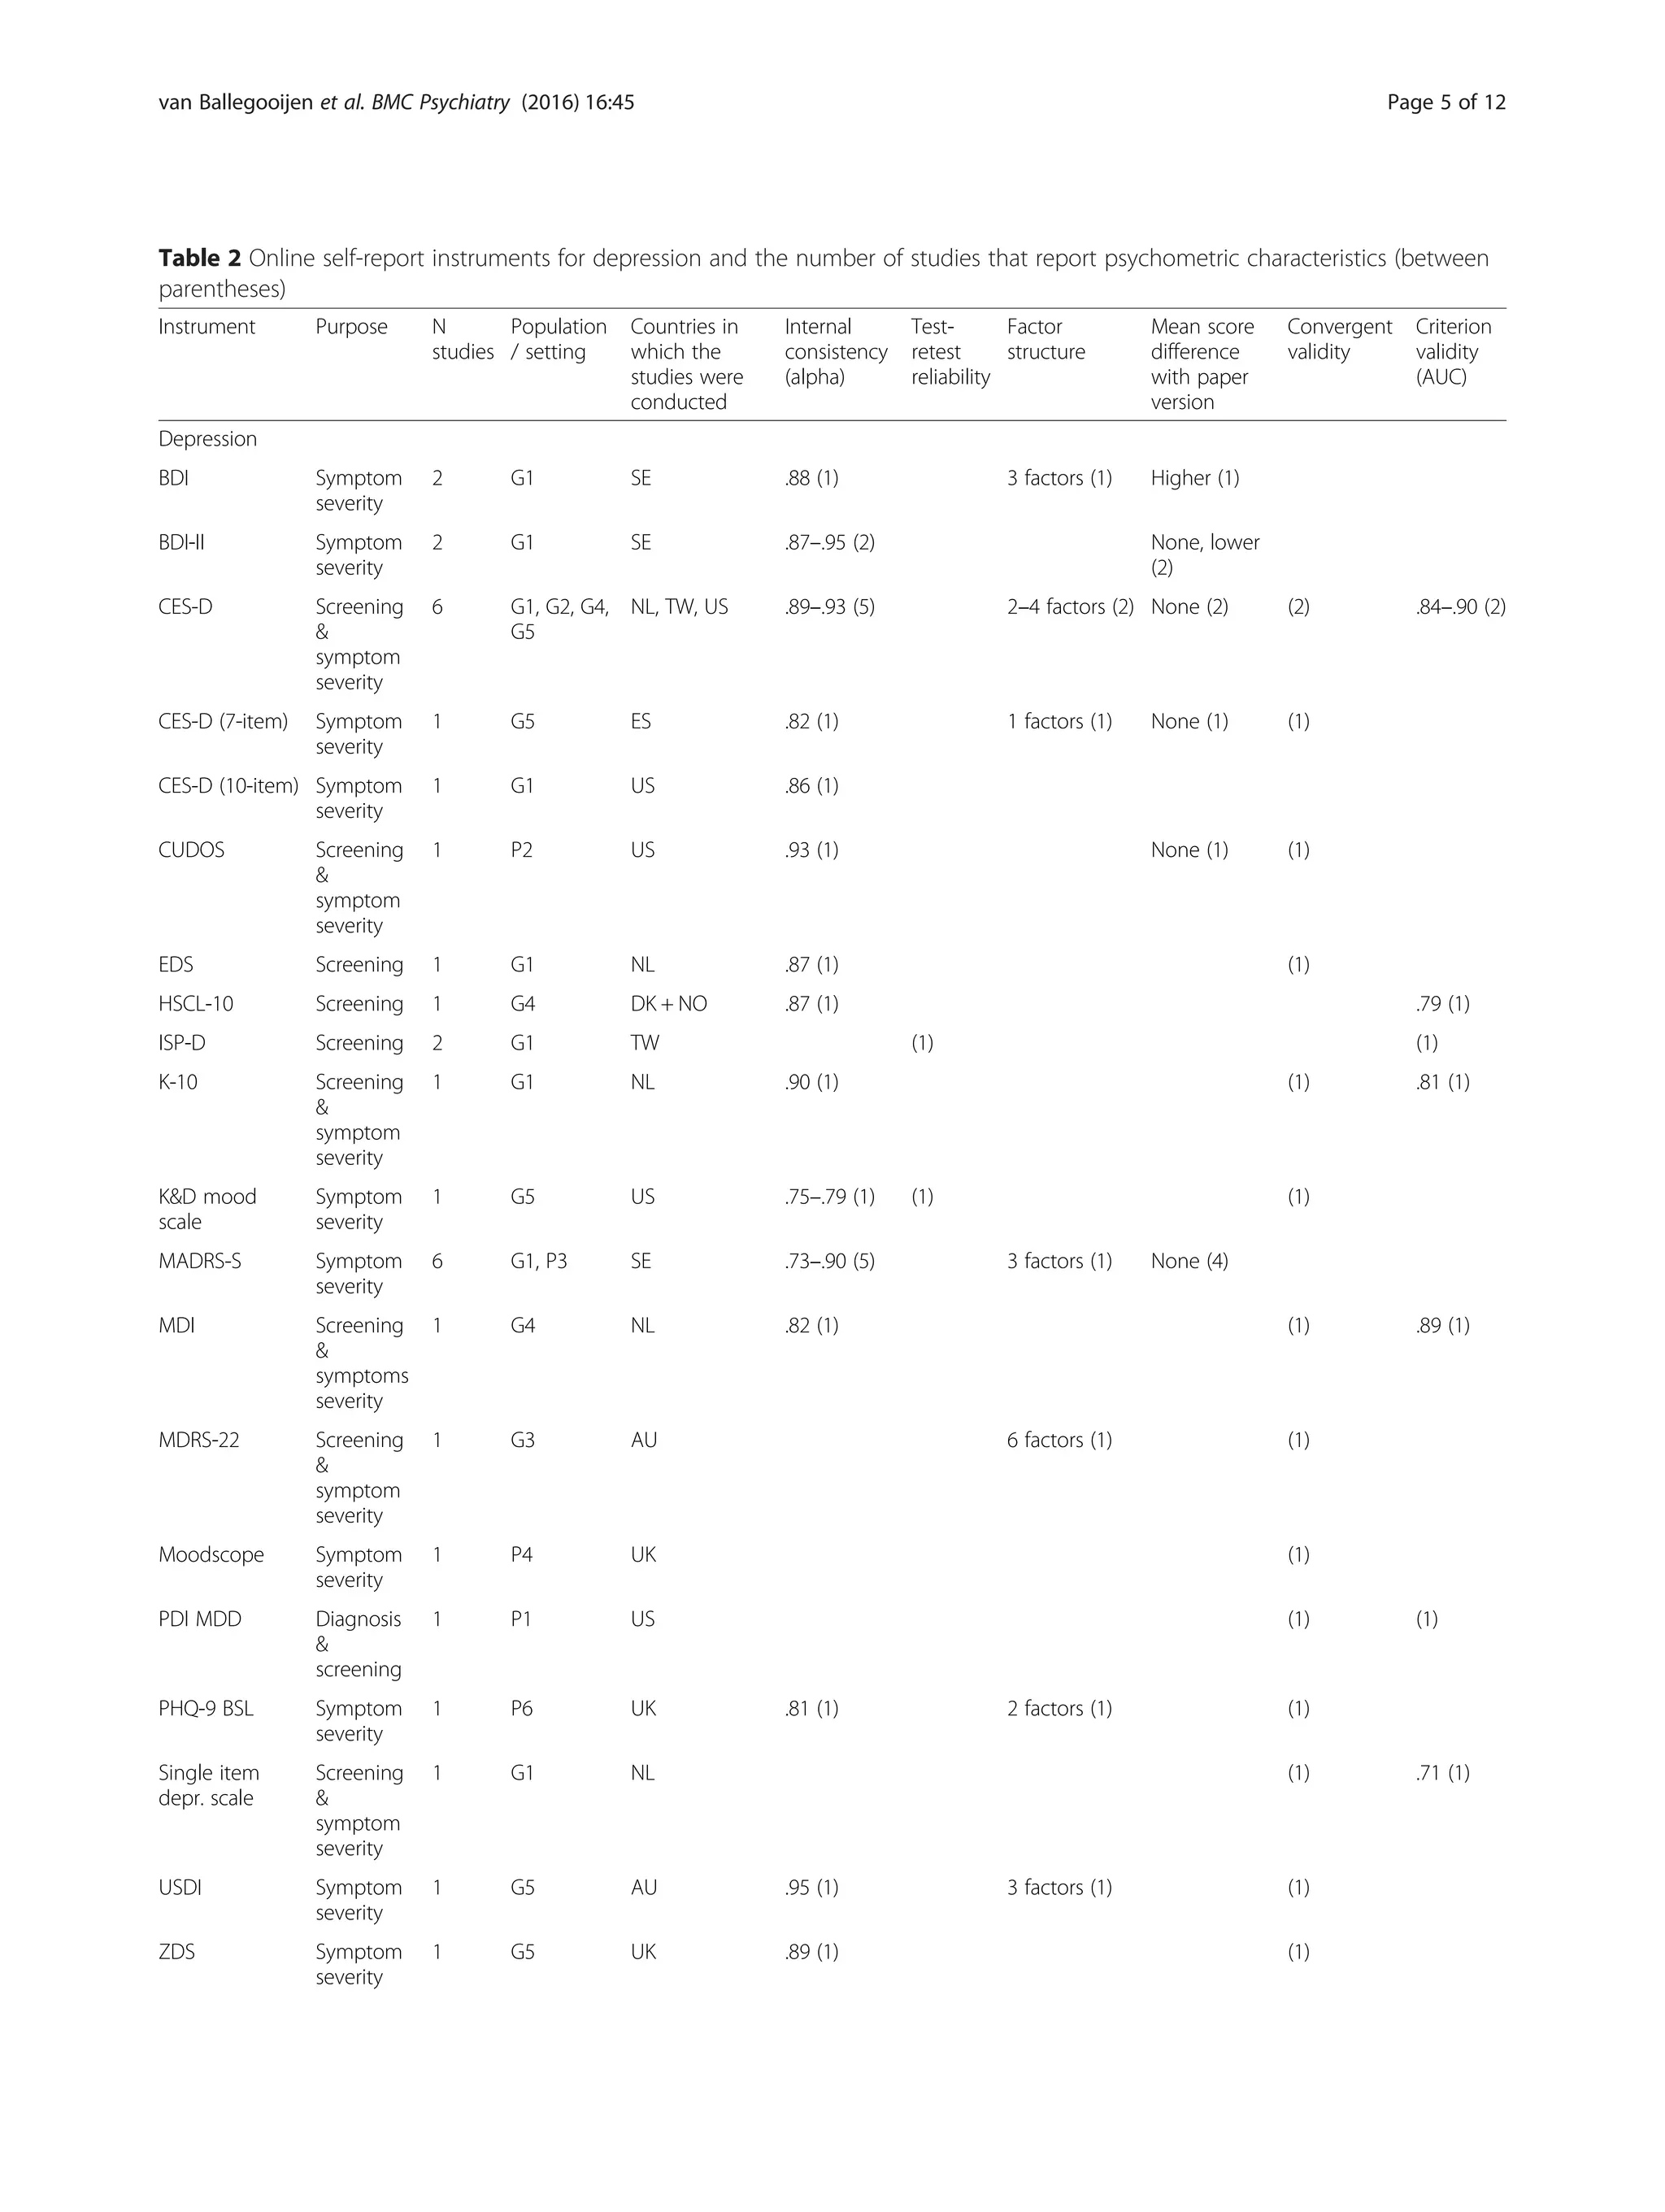
![general population. Five studies investigated instruments
for depression among patient populations [3, 6, 26–28],
each investigating a different instrument.
The full version of the CES-D has been evaluated in 6
studies [5, 29–33], and 5 characteristics were each re-
ported by at least 2 studies (Table 2). Moreover, all 6
studies recruited their samples among non-patients, so
the results can be considered complementary. The in-
ternal consistency was investigated in 5 of these studies,
reporting a Cronbach’s alpha of .89 to .93. Factor ana-
lysis showed that the CES-D consists of 2, 3 or 4 factors
[32, 33]. The 2-factor solution was among an English
speaking population, the 3-factor solution among a
Spanish speaking and the 4-factor solution among a
Chinese speaking population [32, 33]. Adequate psycho-
metric characteristics were found for the CES-D regard-
ing equivalence of mean scores with the paper version
[31, 33], convergent validity [5, 30] and criterion validity
[5, 30]. One study [33] conducted a full measurement in-
variance analysis using confirmatory factor analysis,
comparing paper and online formats, and found only a
negligible difference in the latent mean score of one fac-
tor. Overall, it can be concluded that the online CES-D
has good psychometric characteristics among non-
patient populations, and that a start has been made to
investigate its intercultural validity.
Another commonly investigated instrument was the
MADRS-S [3, 4, 34–37]. Five of these studies reported
Cronbach’s alpha, which is adequate to excellent (.73 to
.90, Table 2) [3, 4, 34–36]. Thorndike and colleagues
[37] found that the scale consists of 3 factors. Four stud-
ies found that the mean score of the MADRS-S does not
differ significantly between the online and the paper ver-
sion [3, 4, 35, 36].
Online assessment of GAD
The GAD-7 and two shorter versions were studied
among a sample recruited from the general population
[38]. The scale showed promising internal consistency,
convergent validity and predictive validity. The psycho-
metrics of the GAD-7 were similar among a population
of people with hearing loss [6].
Online assessment of panic disorder and agoraphobia
Internet interventions for PD/A, such as self-help courses,
have been relatively extensively researched. Therefore,
Austin and colleagues [39] and Carlbring and colleagues
[4] studied the online questionnaires usually employed for
such research. They focussed on equivalence of mean
scores with paper versions of the same instruments. This
equivalence could generally be assumed due to high corre-
lations, but the study of Carlbring [4] found that online
versions yield significantly lower mean scores for the Body
Sensations Questionnaire (BSQ) and Agoraphobic Cogni-
tions Questionnaire (ACQ) and higher scores for the Mo-
bility Inventory (MI) subscale Alone. Finally, an
agoraphobia screening item augmented with images was
found to have adequate criterion validity (AUC .73) [7].
All these studies recruited their samples from the general
population.
Online assessment of social phobia
Two studies [3, 40] independently investigated the
equivalence between online and paper versions of
the online versions of the Social Interaction Anxiety
Scale (SIAS) and Social Phobia Scale (SPS). Both did
not find a difference between formats in mean score,
but the factor structure did differ between formats
[40], indicating that scores cannot be compared
across formats. Adequate to good internal
consistency of these scales has also been found in
three studies [3, 40, 41], and adequate convergent
validity of the SIAS in two [40, 41]. Lindner and col-
leagues revised item 14 of the SIAS, because the ori-
ginal item only applied to heterosexual people. This
change did not alter the internal consistency or con-
vergent validity of the scale [41]. The study of Hed-
man and colleagues [3] recruited people classified
Table 2 Online self-report instruments for depression and the number of studies that report psychometric characteristics (between
parentheses) (Continued)
Postpartum depression
EPDS Screening,
symptom
severity
1 G2 unclear .90 (1) 3 factors (1) (1)
PDSS Screening
&
symptom
severity
1 G2 US .97 (1) (1)
G1: General population; G2: Adult females; G3: Adult males; G4: General teenage population; G5: Student population; G6: General young adult population; G7:
Veteran population; P1: Patient population; P2: Adult psychiatric outpatients; P3: Adult social phobia patients; P4: Adult GP patients; P5: Hearing impaired clinical
population; P6: Deaf population; P7: Adults with chronic fatigue syndrome; P8: Participants in studies of the Centre for Addiction and Mental Health; AU: Australia;
CA: Canada; DK: Denmark; ES: Spain; NL: Netherlands; NO: Norway; NZ: New Zealand; SE: Sweden; TW: Taiwan; UK: United Kingdom; US: United States; AUC: Area
Under the Receiver Operating Characteristic Curve
van Ballegooijen et al. BMC Psychiatry (2016) 16:45 Page 6 of 12](https://image.slidesharecdn.com/60a327b5-f4e4-42b6-b277-54ac7740d7ff-161110111818/75/Validation-of-Psychometric-Properties-6-2048.jpg)
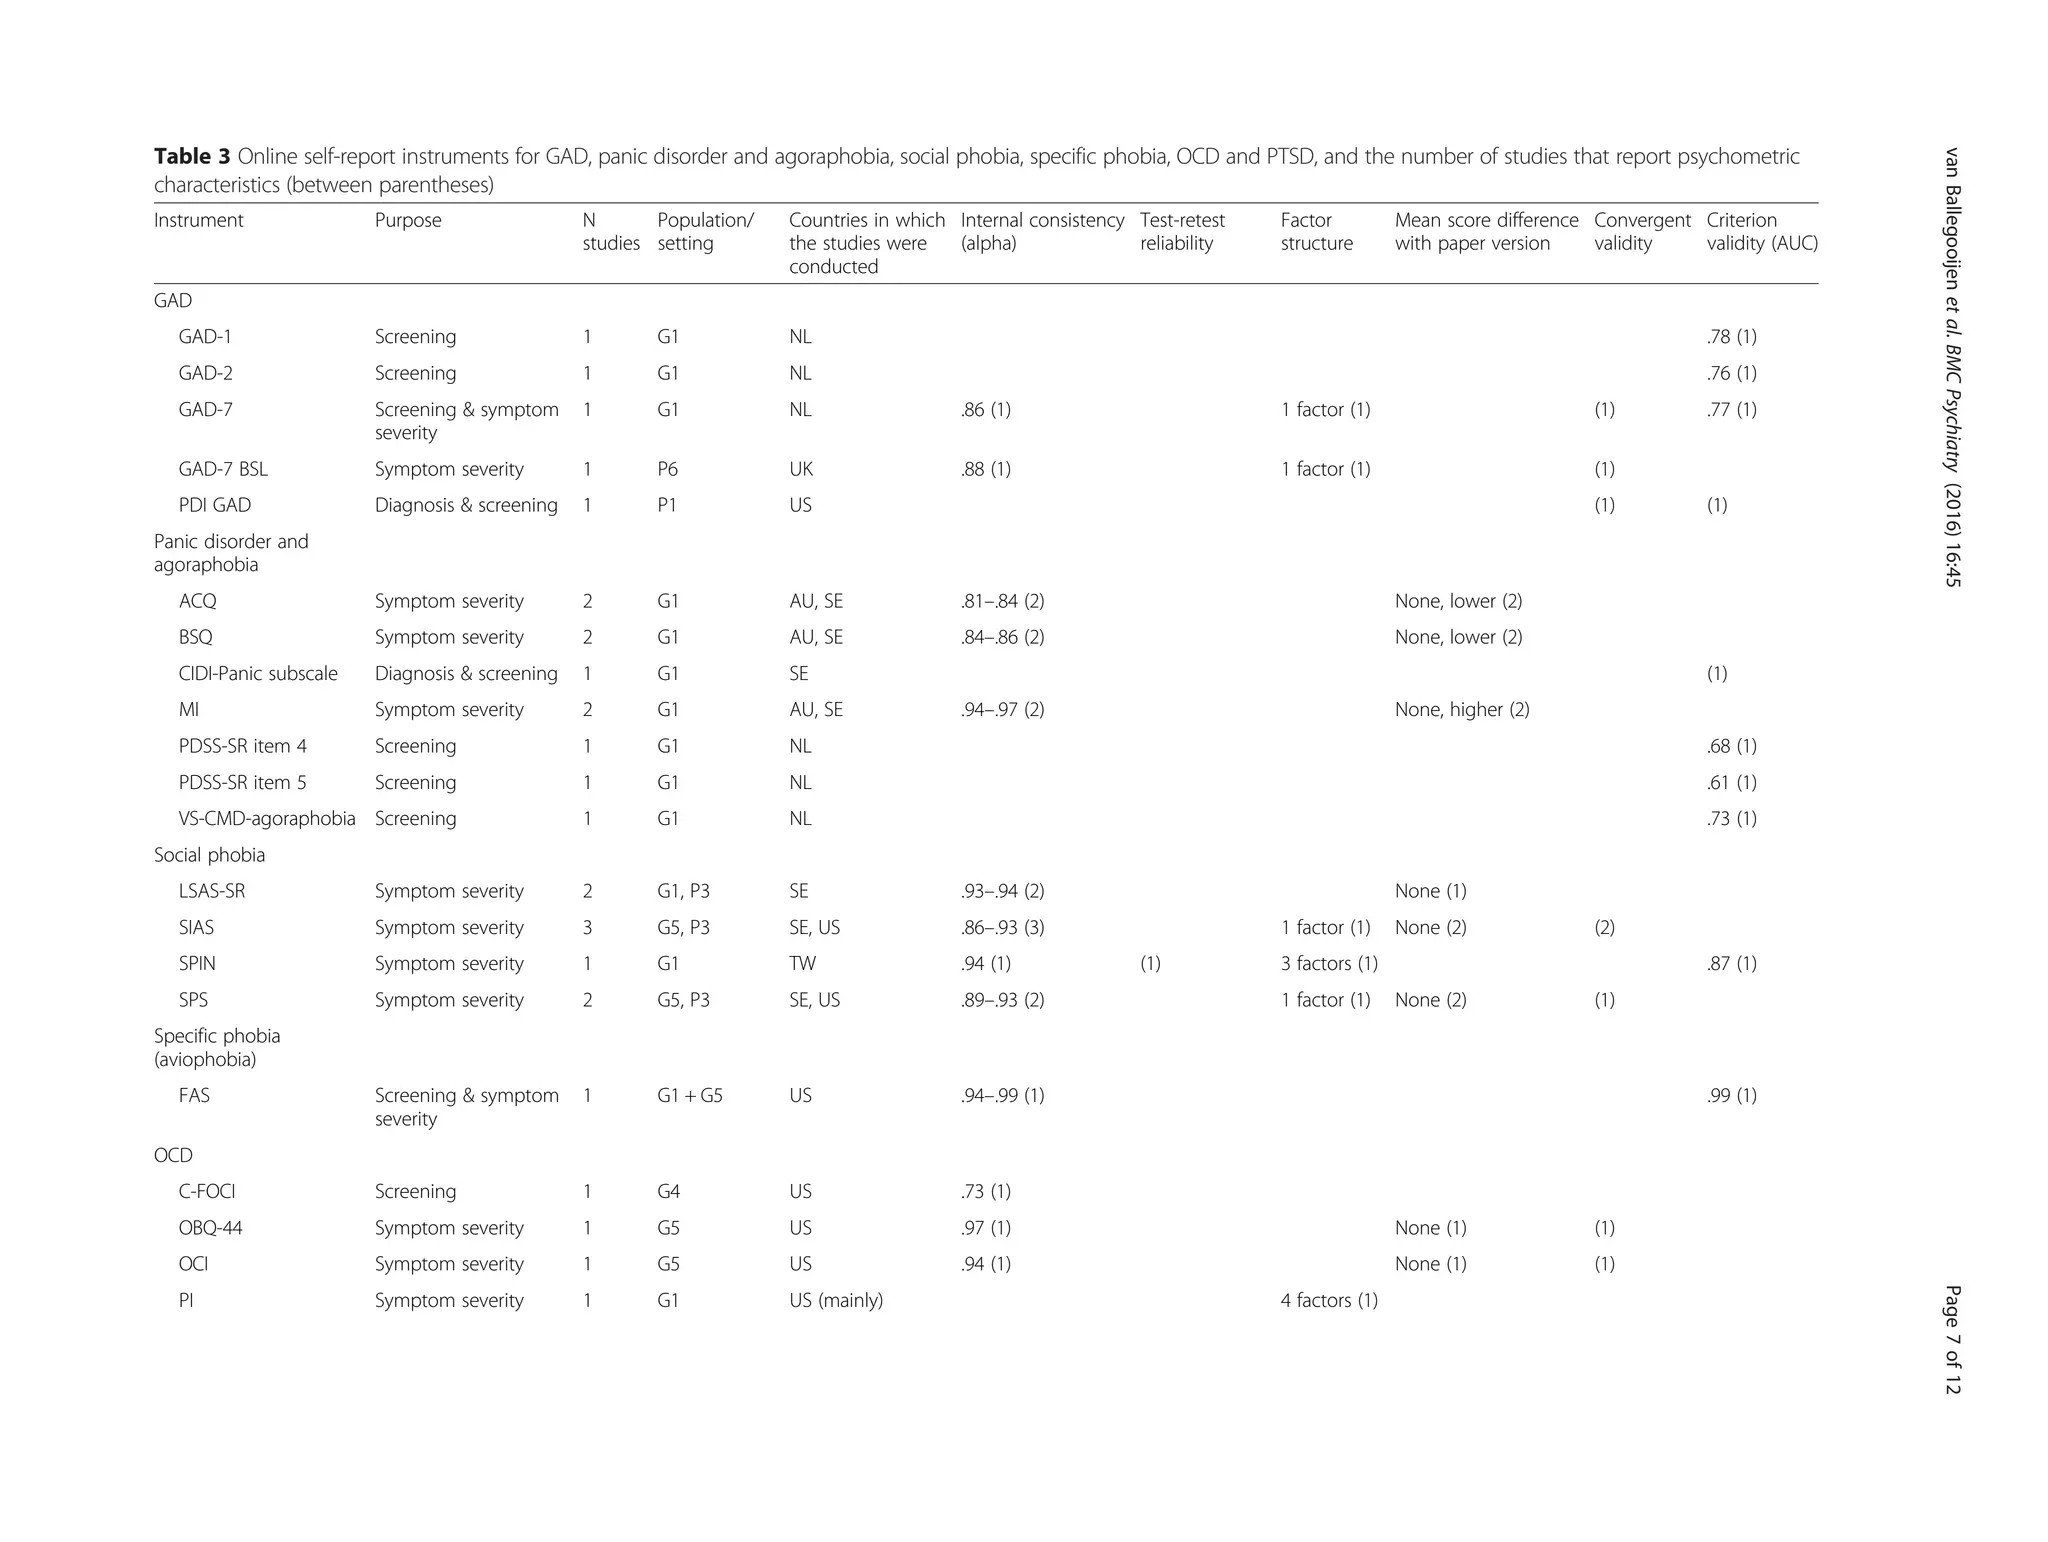
![with social phobia, but more research among patient
groups is recommended.
Online assessment of specific phobia
Two of the transdiagnostic screening measures [18, 21]
included specific phobia. These showed poor criterion
validity for specific phobia. One instrument, the Flight
Anxiety Situations Questionnaire (FAS), has been stud-
ied for aviophobia [42]. This study showed near perfect
criterion validity (AUC .99). Considering aviophobia is
only one of many different specific phobias, much more
development is needed in this area.
Online assessment of OCD
Four instruments for OCD have been studied, all in the
US and among the general population [43–45]. Each in-
strument was studied only once. Williams and col-
leagues [45] investigated differential item functioning
between black and white Americans, finding significant
differences for the Padua Inventory (PI). Next to these 4
instruments, the WSQ [18] and the CIDI-SF [21] also
screen for OCD.
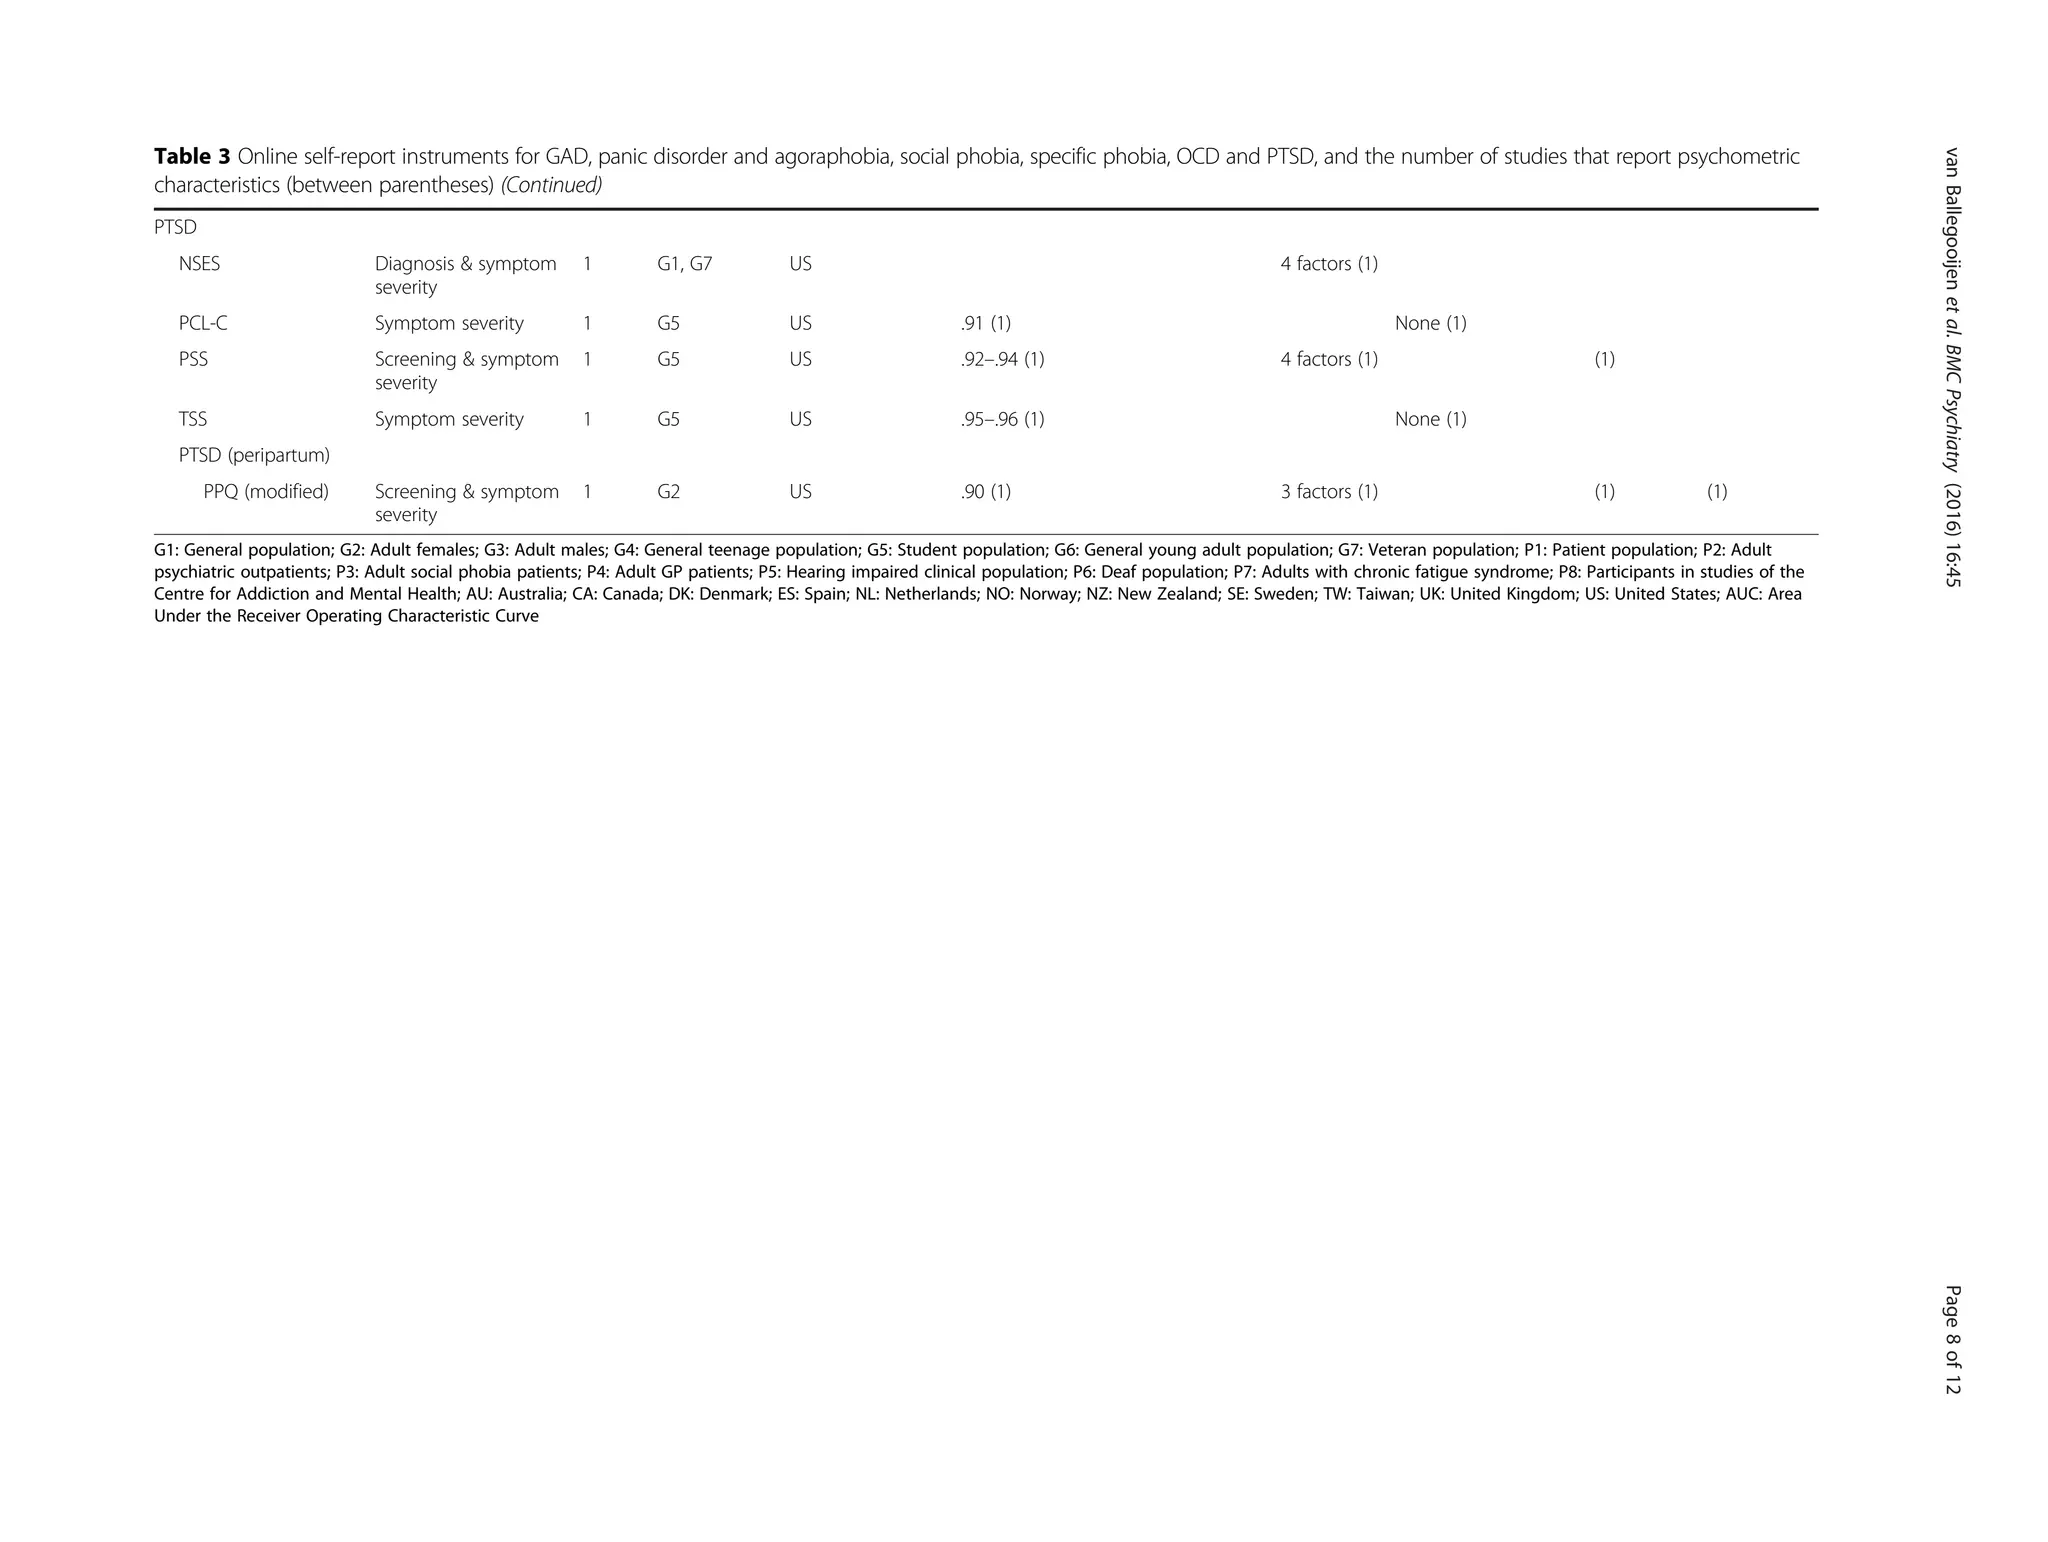
Online assessment of PTSD
Like instruments for OCD, 4 instruments for PTSD have
been studied, all in the US and among the general popu-
lation [31, 46–48]. The transdiagnostic WSQ [18] also
screens for PTSD. One additional study investigated an
instrument for perinatal PTSD [49]. Miller and col-
leagues [47] checked the factor structure of their meas-
ure for PTSD (National Stressful Events Survey) using
item-response theory. The factor structure was con-
firmed, but the items of the instrument may cover too
narrow a range of the latent factors.
Online assessment of worry and stress
The PSWQ, assessing worry, was studied twice [20, 50].
These studies found slightly differing values for internal
consistency (.73 and .88). We found one study on an in-
strument that assesses stress [51].
Online assessment of suicidal ideation and self-harm
We found one study on an instrument that assesses self-
harm. [52] This study used Rasch analysis to further con-
firm the factors of the Inventory of Statements About
Self-injury (ISAS), obtained by factor analysis, and their
unidimensionality. Furthermore, we found two single-item
measures for suicidal ideation, being item 9 of the BDI-II
and item 9 of the MADRS-S [36]. Item 9 of the online
BDI-II yielded lower scores than item 9 of the paper ver-
sion of the BDI-II [36]. The WSQ [18] also contains an
item that screens for suicidal ideation, but the validity of
this item was not investigated (also see [53]).
Table 4 Online self-report instruments for stress, worrying, suicidal ideation and self-harm, and the number of studies that report
psychometric characteristics (between parentheses)
Instrument Purpose N
studies
Population/
setting
Countries in which
the studies were
conducted
Internal
consistency
(alpha)
Test-retest
reliability
Factor
structure
Mean score
difference with
paper version
Convergent
validity
Criterion
validity
(AUC)
Stress
PSS Symptom
severity
1 G5 ES .72 (1) 1 factor (1) None/lower
(1)
(1)
Worry
PSWQ Symptom
severity
2 G1, G5 NL, US .73–.88 (2) (1) 1 factor (1) (1)
Worry
(postpartum)
PWS-R Symptom
severity
1 G2 US .64–.88 (1) 4 factors (1) (1)
Self-harm
ISAS Symptom
severity
1 G6 US + UK + CA +
AU
.77–.87 (1) 2 factors (1) (1)
Suicidal ideation
BDI-II item 9 Screening 1 G1 SE Lower (1)
MADRS-S item 9 Screening 1 G1 SE None (1)
G1: General population; G2: Adult females; G3: Adult males; G4: General teenage population; G5: Student population; G6: General young adult population; G7:
Veteran population; P1: Patient population; P2: Adult psychiatric outpatients; P3: Adult social phobia patients; P4: Adult GP patients; P5: Hearing impaired clinical
population; P6: Deaf population; P7: Adults with chronic fatigue syndrome; P8: Participants in studies of the Centre for Addiction and Mental Health; AU: Australia;
CA: Canada; DK: Denmark; ES: Spain; NL: Netherlands; NO: Norway; NZ: New Zealand; SE: Sweden; TW: Taiwan; UK: United Kingdom; US: United States; AUC: Area
Under the Receiver Operating Characteristic Curve
van Ballegooijen et al. BMC Psychiatry (2016) 16:45 Page 9 of 12](https://image.slidesharecdn.com/60a327b5-f4e4-42b6-b277-54ac7740d7ff-161110111818/75/Validation-of-Psychometric-Properties-9-2048.jpg)
![Generalisability and risk of bias
The sample sizes of the included studies were generally
adequate for analysing psychometric properties. Nine
studies contained over 1000 participants. The other
studies in the tables (n = 46) had an average sample size
of 261 participants. A sample size below 100 was found
in 10 studies, which generally gives too little statistical
power for psychometric analyses [54]. It should be noted
that required sample sizes differ per number of items
and type of analysis. Most results could be biased due to
selectively missing data. Two studies reported missing
data and included numbers. In 33 studies, the amount of
missing data was not specifically reported, but could be
deduced or estimated. Missing data were not reported
by or could not be deduced in 21 studies (see Additional
file 3). Overall, COSMIN quality ratings of ‘Excellent’
were rare and ‘Poor’, ‘Fair’ and ‘Good’ ratings were
equally common. Instead of adding the COSMIN ratings
to the tables and Additional file 3, we decided to report
the characteristics the ratings are based on, because the
ratings do not always do justice to a study’s quality. The
study characteristics give an objective and interpretable
indication of the robustness and generalisability of a
study’s findings. Lastly, 47 of the 62 instruments were
investigated in only one study (Tables 1, 2, 3 and 4), so
the robustness of the psychometric properties of these
instruments relies heavily on the aspects of the individ-
ual studies and cannot be easily generalised to other
populations or settings.
Discussion
This review systematically studied the scientific literature
on the psychometrics of online instruments that meas-
ure common mental health disorders. We report charac-
teristics of 62 instruments. Most of these instruments
were investigated among samples recruited from the
general population. We found at least one online meas-
ure for each of the included mental health disorders and
symptoms. The results are scattered over different in-
struments and different characteristics and, therefore,
can be synthesised for only a few instruments. We found
few instruments that measure specific phobia, stress,
worry self-harm and suicidal ideation. There were no
studies that reported that the questionnaires were com-
pleted on cellular phones or smartphones.
The CES-D is the most well-studied online instrument
and there is evidence for adequate psychometric proper-
ties among samples recruited from the general popula-
tion. The MADRS-S has been well-studied as well,
mostly showing mean score equivalence between online
and paper versions. Finally, the HADS is the only instru-
ment that was investigated among both the general
population and two patient populations, showing ad-
equate psychometric properties.
Ideally, two or more online instruments would be avail-
able for each disorder, with all of their characteristics ex-
amined in several studies, among various populations.
There are clear gaps in the tables presented in this study,
which warrant further research and development. The
psychometric properties measurement error and respon-
siveness were not reported for any instrument. Further-
more, while there is an abundance of online instruments
for depressive symptoms, there is a shortage of instru-
ments for other disorders. Although a few new instru-
ments have been developed in the meantime, e.g. for
suicidal ideation [55], more instruments are needed.
Equivalence between paper and online versions of an in-
strument has mostly been studied in the form of equiva-
lence of mean scores by correlations and t-tests. We can
conclude that correlations are high and differences are
small. However, mean score equivalence is only one aspect
of measurement invariance. Two studies conducted a
broad range of measurement invariance tests [33, 40].
While Yu and Yu [33] found only a negligible difference in
the mean score of the somatic factor of the CES-D, Hirai
and colleagues [40] found that factor structures of the
SIDAS and SPS differ between formats. Differing factor
structures indicate that different constructs are assessed
and scores cannot be compared across formats. It is im-
portant to note that possibly not only the format differs
between paper and online versions, but the setting as well.
Online questionnaires can be completed at the partici-
pant’s home on a device (s) he is familiar with. In the study
of Yu and Yu [33], participants completed the paper ques-
tionnaires at home, while in the study of Hirai and col-
leagues [40], participants completed the paper
questionnaires in a lab. It is recommended to study inter-
format equivalence in one setting, and to use a broad
range of measurement invariance aspects, e.g. using
multiple-group confirmatory factor analysis [56].
This systematic review has some limitations. Firstly, we
may not have included all studies on psychometrics of on-
line instruments for common mental health disorders, be-
cause there may be studies that applied online assessment
without mentioning it in the title or abstract. Online assess-
ment is increasingly common and increasingly less import-
ant to mention. Secondly, we decided not to label the
quality of the included studies, even though a quality as-
sessment is common practice in systematic reviews. Be-
cause psychometric properties are dependent on study
characteristics, it is more insightful to inspect these charac-
teristics in order to decide whether an instrument has been
investigated well enough for the purpose, population and
setting one wants to use it for. Thirdly, our search has been
updated up to January 1st
2014 and several psychometric
studies on online instruments have been published since.
Finally, our search strings (Additional file 2) can be made
more comprehensive by adding ‘distress’, ‘mhealth’ and
van Ballegooijen et al. BMC Psychiatry (2016) 16:45 Page 10 of 12](https://image.slidesharecdn.com/60a327b5-f4e4-42b6-b277-54ac7740d7ff-161110111818/75/Validation-of-Psychometric-Properties-10-2048.jpg)
![‘response processes’. The omission of these terms have not
impacted our results, however.
Future psychometric studies are encouraged to investi-
gate and explore different devices, formats and media.
Only one study in our review [37] investigated the effects
of different formats of online questionnaires and the pref-
erences of the participants. An instrument’s format, e.g.
the layout, design, font type and the number of items per
page, interacts with its content and with the characteris-
tics of the individual who completes the items. [57] Differ-
ent formats could also include other media than text, such
as audio, images and video, see e.g. [6] and [7]. Another
area to explore is measurement by smartphones, which
we did not encounter in the included studies. The validity
of measurement by smartphone applications has been
studied in other fields, such as psychotic symptoms. [58]
An advantage of measurement by smartphones is that it
enables momentary assessment, opposed to retrospective
assessment, because an individual can have access to his/
her smartphone all day long.
Conclusions
We found at least one online measure for each of
the included mental health disorders and symptoms,
and there is mounting evidence for adequate psycho-
metric properties of common instruments such as
the CES-D, MADRS-S and HADS. Overall, the re-
sults are scattered over different instruments and
different characteristics, and much work still has to
be done in this field. With this systematic review we
provide a framework for future research into psycho-
metrics of online instruments. Furthermore, our
overview of instruments can guide professionals
when choosing an instrument for assessing common
mental health disorders online. The tables (Add-
itional file 3) provided with this systematic review
are free to use and expand. We encourage re-
searchers to fill in the missing data and to add in-
novative instruments.
Additional files
Additional file 1: PRISMA Checklist. (DOC 60 kb)
Additional file 2: Search strings. (DOCX 18 kb)
Additional file 3: Included studies and extracted data. (XLS 117 kb)
Competing interests
The authors declare that they have no competing interests.
Authors’ contributions
WvB, HR and JHS designed the study. WvB conducted the literature searches.
WvB, JHS and PvO extracted the data. WvB drafted the manuscript. WvB, HR,
PC, PvO and JHS critically revised the manuscript and approved the final
version.
Acknowledgements
The authors would like to thank the research assistants who helped with
study inclusion and data extraction: Sumeyye Pinar, Chrysanthi Karampetsi,
Lisa Hegelmaier and Stefania Vacaru. No external funding sources were
involved in this study.
Author details
1
Department of Psychiatry, VU Medical Centre / GGZ inGeest, Amsterdam,
Netherlands. 2
Department of Clinical Psychology, Vrije Universiteit
Amsterdam, Amsterdam, Netherlands. 3
EMGO Institute for Health and Care
Research, VU Medical Centre, Amsterdam, Netherlands.
Received: 16 April 2015 Accepted: 4 February 2016
References
1. National Institute for Health and Clinical Excellence (NICE). Common mental
health disorders: Identification and pathways to care. London: NICE; 2011.
2. Alfonsson S, Maathz P, Hursti T. Interformat reliability of digital psychiatric
self-report questionnaires: a systematic review. J Med Internet Res. 2014;
16(12), e268. doi:10.2196/jmir.3395.
3. Hedman E, Ljotsson B, Ruck C, Furmark T, Carlbring P, Lindefors N, et al.
Internet administration of self-report measures commonly used in research on
social anxiety disorder: A psychometric evaluation. Comput Hum Behav. 2010;
26(4):736–40.
4. Carlbring P, Brunt S, Bohman S, Austin D, Richards J, Ost LG, et al. Internet vs.
paper and pencil administration of questionnaires commonly used in panic/
agoraphobia research. Comput Hum Behav. 2007;23(3):1421–34.
5. Cuijpers P, Boluijt P, Van SA. Screening of depression in adolescents
through the Internet : sensitivity and specificity of two screening
questionnaires. Eur Child AdolescPsychiatry. 2008;17(1):32–8. doi:10.1007/
s00787-007-0631-2.
6. Rogers KD, Young A, Lovell K, Campbell M, Scott PR, Kendal S. The British Sign
Language versions of the Patient Health Questionnaire, the Generalized
Anxiety Disorder 7-item Scale, and the Work and Social Adjustment Scale. J
Deaf Stud Deaf Educ. 2013;18(1):110–22. doi:10.1093/deafed/ens040.
7. van Ballegooijen W, Riper H, Donker T, Martin Abello K, Marks I, Cuijpers P.
Single-item screening for agoraphobic symptoms: validation of a web-
based audiovisual screening instrument. PLoS One. 2012;7(7):e38480. doi:10.
1371/journal.pone.0038480.
8. Farvolden P, McBride C, Bagby RM, Ravitz P. A Web-based screening
instrument for depression and anxiety disorders in primary care. J Med Internet
Res. 2003;5(3), e23. doi:10.2196/jmir.5.3.e23.
9. Moher D, Liberati A, Tetzlaff J, Altman DG, Group P. Preferred reporting
items for systematic reviews and meta-analyses: the PRISMA statement. BMJ.
2009;339:b2535. doi:10.1136/bmj.b2535.
10. Terwee CB, Mokkink LB, Knol DL, Ostelo RW, Bouter LM, de Vet HC. Rating
the methodological quality in systematic reviews of studies on
measurement properties: a scoring system for the COSMIN checklist. Qual
Life Res. 2012;21(4):651–7. doi:10.1007/s11136-011-9960-1.
11. Terwee CB, Jansma EP, Riphagen II, de Vet HC. Development of a
methodological PubMed search filter for finding studies on
measurement properties of measurement instruments. Qual Life Res.
2009;18(8):1115–23. doi:10.1007/s11136-009-9528-5.
12. World Health Organization. ICD-10 Version:2015. 2015. http://apps.who.int/
classifications/icd10/browse/2015/en. Accessed January 2015.
13. American Psychiatric Association. Diagnostic and statistical manual of mental
disorders, (DSM-5®). American Psychiatric Pub.; 2013.
14. Mokkink LB, Terwee CB, Patrick DL, Alonso J, Stratford PW, Knol DL, et al.
The COSMIN checklist for assessing the methodological quality of studies
on measurement properties of health status measurement instruments: an
international Delphi study. Qual Life Res. 2010;19(4):539–49. doi:10.1007/
s11136-010-9606-8.
15. Mokkink LB, Terwee CB, Patrick DL, Alonso J, Stratford PW, Knol DL, et al.
The COSMIN study reached international consensus on taxonomy,
terminology, and definitions of measurement properties for health-related
patient-reported outcomes. J Clin Epidemiol. 2010;63(7):737–45. doi:10.1016/
j.jclinepi.2010.02.006.
16. Mokkink LB, Terwee CB, Knol DL, Stratford PW, Alonso J, Patrick DL, et al. The
COSMIN checklist for evaluating the methodological quality of studies on
van Ballegooijen et al. BMC Psychiatry (2016) 16:45 Page 11 of 12](https://image.slidesharecdn.com/60a327b5-f4e4-42b6-b277-54ac7740d7ff-161110111818/75/Validation-of-Psychometric-Properties-11-2048.jpg)