The Cellphone Culture and Public Health
•
3 likes•373 views

Overview of mobile use in the US with a deep dive into examples of public health research and demonstration projects. Presented 5 August 2010 at The Institute 2010, Emory Conference Center, Atlanta, GA
![[object Object],[object Object],[object Object],[object Object],[object Object],[object Object],[object Object],[object Object],[object Object],[object Object]](data:image/gif;base64,R0lGODlhAQABAIAAAAAAAP///yH5BAEAAAAALAAAAAABAAEAAAIBRAA7)
Recommended
More Related Content
What's hot
What's hot (9)
Viewers also liked
Similar to The Cellphone Culture and Public Health
Similar to The Cellphone Culture and Public Health (20)
Recently uploaded
Recently uploaded (20)
The Cellphone Culture and Public Health
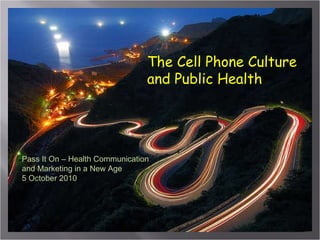
- 1. The Cell Phone Culture and Public Health Pass It On – Health Communication and Marketing in a New Age 5 October 2010
- 7. Eighty percent of the world’s population now lives within range of a cellular network – Sara Corbett, NYT Magazine 7 Apr 2008
- 9. Google 42 Yahoo! 38 Facebook 29.3 MSN/Windows Live/Bing 20.6 AOL Media Network 18.8 The Weather Channel 14.4 MySpace 14 Operator portals 13.6 ESPN 10.4 CNN 10.2
- 10. Whites (85%) Blacks (81%) Hispanics (81%) 84%* of the population reports owning a cell phone. Here is a breakdown of use among different groups. (shown as a percentage of population owning a cell phone) 18-29 Years Old (92%) 30-49 Years Old (90%) 50-64 Years Old (84%) 65+ Years Old (64%) No High School Degree (64%) College Graduates (94%) <$30K Income (73%) $75K+ Income (96%) Men (86%) Women (83%) High School Graduates (83%) *Source: Pew Internet & American Life Survey, December 2008. http://www.pewinternet.org
- 12. Source: Pew Internet & American Life Project Survey, December 2007, n=1,704 for those with cell phones or PDAs. Margin of error is +/- 3 points. Survey conducted in English
- 14. “ They’d send me a text saying, ‘Have papa come pick me up,’ and I couldn’t open it,” she said of her granddaughters. “They finally told me I had to learn.”
- 15. For English-speaking Hispanics, the cell phone is an oft-used and multifaceted device – more so than is the case for white or black Americans.
- 16. Source: Pew Internet & American Life Project Survey, December 2007, n=1,704 for those with cell phones or PDAs. Margin of error is +/- 3 points. Survey conducted in English.
- 38. Are we available when, where and how people want us to be ?
- 40. R. Craig Lefebvre, PhD University of South Florida School of Public Health, Tampa, FL social Shift , Sarasota, FL social|design, marketing and media On Social Marketing and Social Change http://socialmarketing.blogs.com http://twitter.com/chiefmaven
Editor's Notes
- Quote from 1908 Hampton’s magazine. Cover from Hampton’s 1909.
- Unisys study – 26 hours to report a loss wallet; 68 minutes for a phone 2. Replaces the wrist watch 3. 80% physically take it to bed – alarm, txt, phone calls
- Source: http://communities-dominate.blogs.com/brands/statistics/
- CTIA data msgs from CTIA
- Source; http://mobithinking.com/blog/mobile-net-stats
- According to the Centers for Disease Control and Prevention, Latinos were the most likely among racial and ethnic groups to have abandoned a landline, with 15.3 percent of adults saying they have cut the cord in favor of a mobile phone. More than one-half of all adults living with unrelated roommates (56.9%) lived in households with only wireless telephones. This is the highest prevalence rate among the population subgroups examined. Adults renting their home (30.9%) were more likely than adults owning their home (7.3%) to be living in households with only wireless telephones. More than one in three adults aged 25-29 years (34.5%) lived in households with only wireless telephones. Nearly 31% of adults aged 18-24 years lived in households with only wireless telephones. As age increased, the percentage of adults living in households with only wireless telephones decreased: 15.5% for adults aged 30-44 years; 8.0% for adults aged 45-64 years; and 2.2% for adults aged 65 years and over. Men (15.9%) were more likely than women (13.2%) to be living in households with only wireless telephones. Adults living in poverty (27.4%) were more likely than higher income adults to be living in households with only wireless telephones. Adults living in the South (17.1%) and Midwest (15.3%) were more likely than adults living in the Northeast (10.0%) to be living in households with only wireless telephones. Non-Hispanic white adults (12.9%) were less likely than Hispanic adults (19.3%) or non-Hispanic black adults (18.3%) to be living in households with only wireless telephones
- Source: John Horrigan MOBILE ACCESS TO DATA AND INFORMATION March 2008 Send or receive text messages 85 65 38 11 Send or receive email 28 21 12 6 Median number of activities ever done 4 2 1 0 Send or receive instant messages 26 18 11 7 Access the internet for news, weather, sports, or other information 31 22 10 6
- Nielsen's newly launched Mobile Kids Insights survey (September, 2008)
- In June, 75 billion text messages were sent in the United States, compared with 7.2 billion in June 2005, according to CTIA — the Wireless Association, the leading industry trade group. The consumer research company Nielsen Mobile, which tracked 50,000 individual customer accounts in the second quarter of this year, found that Americans each sent or received 357 text messages a month then, compared with 204 phone calls. That was the second consecutive quarter in which mobile texting significantly surpassed the number of voice calls. Teenagers and young adults have adopted text-messaging as a second language. Americans 13 to 17 years of age sent or received an average of 1,742 text messages a month in the second quarter, according to Nielsen. And according to one survey commissioned by CTIA, 4 of 10 teenagers said they could text blindfolded. Source – NYT, 19 Sept 2008 As text messages fly, danger lurks. J. Steinhauer and L.M. Holson http://www.nytimes.com/2008/09/20/us/20messaging.html?_r=1&th=&oref=slogin&emc=th&adxnnlx=1221919543-9DNZn9%20WBeIQY2lSbNxT6g&pagewanted=all
- Source: Pew Internet & American Life Project Survey, December 2007, n=1,704 for those with cell phones or PDAs. Margin of error is +/- 3 points. Survey conducted in English. 84% of English-speaking Hispanics have cell phones. 74% of white Americans have cell phones. 71% of black Americans have cell phones.
- Send or receive text messages 53% 68% 73% Send or receive email 17 19 25 Send or receive instant messages 14 26 27 Access the internet for news, weather, sports, or other information 18 27 22
- Read an RDID tag on anything anywhere Glucose monitoring and remote transmission Multiple chemical sensitivities and exposure to asthma triggers For homeland security, radiation exposure Product authentication to reduce counterfeiting of products – eg, pharmaceutical products Gentag's patented &quot;smart&quot; skin-patch technology combines low-cost, disposable RFID sensors with an adhesive skin patch. As with most of Gentag's sensor technologies, these disposable, non-invasive &quot;smart&quot; skin patches are directly readable with RFID-enabled cell phones. The first market application for the smart skin patch is a patient ID and fever onset bandage, integrating Gentag's proprietary sensor circuit in a disposable skin patch. Applications include using cell phones for monitoring the fever onset in a child, patient monitoring in hospitals, or remotely monitoring the well-being of elderly relatives or friends via cell phones or the Internet. Gentag has also patented other applications of its RFID smart skin-patch technology, including: * An RFID glucose-monitoring skin patch * An RFID cardiac-monitoring skin patch * An RFID UV-monitoring skin patch * A biomarker skin test patch Gentag has developed and tested a proprietary technology to combine immunoassays with a cell phone for on-the-spot diagnostics and remote monitoring of results, anywhere. Applications include pathogen detection, trace analysis detection in foods (e.g. peanuts) and Point-of-Care (POC) diagnostic applications. The company plans to merge this technology with specific biomarkers for advanced diagnostic applications using cell phones.
- Background: Less than 63% of individuals with diabetes meet professional guidelines target of hemoglobin A1c <7.0%, and only 7% meet combined glycemic, lipid, and blood pressure goals. The primary study aim was to assess the impact on A1c of a cell phone-based diabetes management software system used with web-based data analytics and therapy optimization tools. Secondary aims examined health care provider (HCP) adherence to prescribing guidelines and assessed HCPs' adoption of the technology. Methods: Thirty patients with type 2 diabetes were recruited from three community physician practices for a 3-month study and evenly randomized. The intervention group received cell phone-based software designed by endocrinologists and CDEs (WellDoc Communications, Inc., Baltimore, MD). The software provided real-time feedback on patients' blood glucose levels, displayed patients' medication regimens, incorporated hypo- and hyperglycemia treatment algorithms, and requested additional data needed to evaluate diabetes management. Patient data captured and transferred to secure servers were analyzed by proprietary statistical algorithms. The system sent computer-generated logbooks (with suggested treatment plans) to intervention patients' HCPs. Results: The average decrease in A1c for intervention patients was 2.03%, compared to 0.68% ( P < 0.02, one-tailed) for control patients. Of the intervention patients, 84% had medications titrated or changed by their HCP compared to controls (23%, P = 0.002). Intervention patients' HCPs reported the system facilitated treatment decisions, provided organized data, and reduced logbook review time. Conclusions: Adults with type 2 diabetes using WellDoc's software achieved statistically significant improvements in A1c. HCP and patient satisfaction with the system was clinically and statistically significant.
- Using Internet and Mobile Phone Technology to Deliver an Automated Physical Activity Program: Randomized Controlled Trial Robert Hurling 1 , PhD; Michael Catt 1 , BSc; Marco De Boni 1 , PhD; Bruce William Fairley 2 , PhD; Tina Hurst 1 , PhD; Peter Murray 1 , CStat, MPhil; Alannah Richardson 1 , PhD; Jaspreet Singh Sodhi 2 , PhD ABSTRACT Background: The Internet has potential as a medium for health behavior change programs, but no controlled studies have yet evaluated the impact of a fully automated physical activity intervention over several months with real-time objective feedback from a monitor. Objective: The aim was to evaluate the impact of a physical activity program based on the Internet and mobile phone technology provided to individuals for 9 weeks. Methods: A single-center, randomized, stratified controlled trial was conducted from September to December 2005 in Bedfordshire, United Kingdom, with 77 healthy adults whose mean age was 40.4 years (SD = 7.6) and mean body mass index was 26.3 (SD = 3.4). Participants were randomized to a test group that had access to an Internet and mobile phone–based physical activity program (n = 47) or to a control group (n = 30) that received no support. The test group received tailored solutions for perceived barriers, a schedule to plan weekly exercise sessions with mobile phone and email reminders, a message board to share their experiences with others, and feedback on their level of physical activity. Both groups were issued a wrist-worn accelerometer to monitor their level of physical activity; only the test group received real-time feedback via the Internet. The main outcome measures were accelerometer data and self-report of physical activity. Results: At the end of the study period, the test group reported a significantly greater increase over baseline than did the control group for perceived control ( P < .001) and intention/expectation to exercise ( P < .001). Intent-to-treat analyses of both the accelerometer data ( P = .02) and leisure time self-report data ( P = .03) found a higher level of moderate physical activity in the test group. The average increase (over the control group) in accelerometer-measured moderate physical activity was 2 h 18 min per week. The test group also lost more percent body fat than the control group (test group: −2.18, SD = 0.59; control group: −0.17, SD = 0.81; P = .04). Conclusions: A fully automated Internet and mobile phone–based motivation and action support system can significantly increase and maintain the level of physical activity in healthy adults.
- The difference between the test and control group accelerometer-measured physical activity was apparent for most of the 9-week intervention (see Figure 4 ). The control group began at the same level as the test group but then decreased to a greater extent. It is likely that both test and control groups had initially higher levels of physical activity than their norm, due to awareness of being monitored and/or completing the questionnaires [ 56 ]. This suggests that the Internet-based behavior change system enabled the test group to maintain their elevated level of physical activity. The size of the difference in physical activity between the two groups is considerable; an increase of 2 h 18 min per week represents 92% of the recommended [ 6 ] 2 h 30 min, although further work is required to clarify how absolute continuous accelerometry measurements relate to the 30 min/day government recommendation. It is also notable that all parts of the system were used by at least one third of participants; it may be the case that each individual requires an idiosyncratic selection of support tools to achieve behavior change such that no one tool can be universally considered the most influential. Further work is required to determine how parts of the system interact to impact individual behavior change and how to optimize the exposure period; 9 weeks may not be necessary
- mobile communications are changing our expectations about when and how others are available to us
- Mobile phones are not the next ‘magic bullet’ – we need to think of them as part of the personalized media space our people formerly know as ‘audiences’ are creating for themselves. Ubiquity in this increasingly mobile environment will be a key factor for our future successes in public health.