SlideShare a Scribd company logo
1 of 16
Download to read offline
July 2017 Monthly Snapshot
One-Year Change in One-Year Change in
Median Sales Price
Single Family
Median Sales Price
Condo/TIC/Coop
2
3
4
5
6
7
8
9
10
11
12
13
14
15
16
Monthly Indicators
+ 9.7% + 12.4% + 9.4%
One-Year Change in
How long can the residential real estate market go on like this? We are about
two years into a national trend of dropping housing supply and increasing
median sales prices. There are some regional variations to the story, but the
shift to a predominantly seller's market is mostly complete. Multiple-offer
situations over asking price are commonplace in many communities, and good
homes are routinely off the market after a single day. It is evident that a
favorable economy keeps hungry buyers in the chase.
New Listings were down 28.9 percent for single family homes and 20.4 percent
for Condo/TIC/Coop properties. Pending Sales remained flat for single family
homes but decreased 19.0 percent for Condo/TIC/Coop properties.
The Median Sales Price was up 9.7 percent to $1,431,000 for single family
homes and 12.4 percent to $1,175,000 for Condo/TIC/Coop properties. Months
Supply of Inventory decreased 36.0 percent for single family units and 32.3
percent for Condo/TIC/Coop units.
Although the unemployment rate remains unchanged at its favorable national
4.3 percent rate, wage growth has not been rising at the steady clip that would
be expected in an improving economy. Sales activity manages to keep churning
along despite looming shortages in new construction. Lower price ranges are
starting to feel the effects of the supply and demand gap, as first-time buyers
scramble to get offers in at an increasing pace.
Median Sales Price
All Property Types
Residential real estate activity in San Francisco County (Districts 1-10),
comprised of single-family properties, townhomes and condominiums.
Percent changes are calculated using rounded figures.
Single Family Activity Overview
Months Supply of Inventory
Current as of August 11, 2017. All data from the San Francisco MLS. Report © 2017 ShowingTime.
Condo/TIC/Coop Activity Overview
Inventory of Active Listings
% of Properties Sold Over List Price
% of List Price Received
Housing Affordability Ratio
All Properties Activity Overview
New Listings
Pending Sales
Sold Listings
Median Sales Price
Average Sales Price
Days on Market Until Sale
Activity by District
Single Family Activity Overview
Key metrics by report month and for year-to-date (YTD) starting from the first of the year.
Key Metrics Historical Sparkbars 7-2016 7-2017 Percent Change YTD 2016 YTD 2017 Percent Change
Current as of August 11, 2017. All data from the San Francisco MLS. Report © 2017 ShowingTime. | 2
Months Supply 2.5 1.6 - 36.0% -- -- --
Affordability Ratio 41 36 - 12.2%
% of List Price Received 111.8% 117.2% + 4.8% 112.7%
40
77.3% + 0.9%
+ 1.9%
37 - 7.5%
114.8%
% of Properties Sold Over List Price 76.2% 81.3% + 6.7% 76.6%
Active Listings 463 298 - 35.6% --
Avg. Sales Price $1,721,337 $1,777,879 + 3.3% $1,706,946
Days on Market 32 24 - 25.0% 30 28 - 6.7%
$1,795,477
-- --
Median Sales Price $1,305,000 $1,431,000 + 9.7% $1,339,000
Sold Listings 202 203 + 0.5% 1,220
New Listings 232 165 - 28.9% 1,692
Pending Sales 169 169 0.0% + 1.6%1,279 1,300
- 9.5%1,532
1,238 + 1.5%
$1,401,000 + 4.6%
+ 5.2%
7-2014 7-2015 7-2016 7-2017
7-2014 7-2015 7-2016 7-2017
7-2014 7-2015 7-2016 7-2017
7-2014 7-2015 7-2016 7-2017
7-2014 7-2015 7-2016 7-2017
7-2014 7-2015 7-2016 7-2017
7-2014 7-2015 7-2016 7-2017
7-2014 7-2015 7-2016 7-2017
7-2014 7-2015 7-2016 7-2017
7-2014 7-2015 7-2016 7-2017
7-2014 7-2015 7-2016 7-2017
Condo/TIC/Coop Activity Overview
Key metrics by report month and for year-to-date (YTD) starting from the first of the year.
Key Metrics Historical Sparkbars 7-2016 7-2017 Percent Change YTD 2016 YTD 2017 Percent Change
Current as of August 11, 2017. All data from the San Francisco MLS. Report © 2017 ShowingTime. | 3
Months Supply 3.1 2.1 - 32.3% -- -- --
Affordability Ratio 59 51 - 13.6%
% of List Price Received 104.8% 106.3% + 1.4% 105.4%
57
59.3% - 4.2%
- 0.4%
53 - 7.0%
105.0%
% of Properties Sold Over List Price 58.6% 64.2% + 9.6% 61.9%
Active Listings 721 491 - 31.9% --
Avg. Sales Price $1,206,077 $1,267,396 + 5.1% $1,246,400
Days on Market 39 33 - 15.4% 36
$1,136,250 + 3.3%
+ 4.7%
36 0.0%
$1,304,792
-- --
Sold Listings 249 226 - 9.2% 1,565 1,638 + 4.7%
Median Sales Price $1,045,000 $1,175,000 + 12.4% $1,100,000
- 12.6%
Pending Sales 258 209 - 19.0% 1,646 1,680 + 2.1%
New Listings 279 222 - 20.4% 2,442 2,135
7-2014 7-2015 7-2016 7-2017
7-2014 7-2015 7-2016 7-2017
7-2014 7-2015 7-2016 7-2017
7-2014 7-2015 7-2016 7-2017
7-2014 7-2015 7-2016 7-2017
7-2014 7-2015 7-2016 7-2017
7-2014 7-2015 7-2016 7-2017
7-2014 7-2015 7-2016 7-2017
7-2014 7-2015 7-2016 7-2017
7-2014 7-2015 7-2016 7-2017
7-2014 7-2015 7-2016 7-2017
New Listings
New Listings
Single
Family
Year-Over-Year
Change
Condo/TIC/
Coop
Year-Over-Year
Change
Aug-2016 202 -13.7% 285 -0.7%
Sep-2016 346 +6.5% 435 -0.7%
Oct-2016 222 -15.6% 300 -6.8%
Nov-2016 138 -3.5% 160 -17.9%
Dec-2016 70 +4.5% 118 -2.5%
Jan-2017 176 -3.8% 326 +10.9%
Feb-2017 186 -18.1% 328 -3.0%
Mar-2017 273 0.0% 344 -8.8%
Apr-2017 239 -15.5% 281 -24.5%
May-2017 277 +8.2% 345 -7.8%
Jun-2017 216 -9.2% 289 -29.2%
Jul-2017 165 -28.9% 222 -20.4%
12-Month Avg 209 -7.9% 286 -9.8%
Historical New Listings by Month
Current as of August 11, 2017. All data from the San Francisco MLS. Report © 2017 ShowingTime. | 4
A count of the properties that have been newly listed on the market in a given month.
256
294
232
279
165
222
Single Family Condo/TIC/Coop
July
0
100
200
300
400
500
600
700
1-2005 1-2006 1-2007 1-2008 1-2009 1-2010 1-2011 1-2012 1-2013 1-2014 1-2015 1-2016 1-2017
Single Family Condo/TIC/Coop
1,708
2,190
1,692
2,442
1,532
2,135
Single Family Condo/TIC/Coop
Year to Date
2015 2016 2017
- 20.4%- 5.1%- 28.9%- 9.4% + 11.5%- 9.5%- 0.9% - 12.6%
2015 2016 2017 2015 2016 2017 2015 2016 2017
- 3.8% + 0.9% - 7.9%- 17.4%
Pending Sales
Pending Sales
Single
Family
Year-Over-Year
Change
Condo/TIC/
Coop
Year-Over-Year
Change
Aug-2016 198 -3.4% 236 +2.2%
Sep-2016 186 -6.5% 216 0.0%
Oct-2016 222 -16.5% 249 -12.0%
Nov-2016 209 +19.4% 266 +11.3%
Dec-2016 123 -6.1% 178 +1.7%
Jan-2017 94 -5.1% 144 +0.7%
Feb-2017 136 +9.7% 208 -8.8%
Mar-2017 213 +9.2% 303 +34.1%
Apr-2017 198 -7.5% 226 -7.4%
May-2017 240 -3.6% 305 +7.0%
Jun-2017 250 +9.2% 285 +8.8%
Jul-2017 169 0.0% 209 -19.0%
12-Month Avg 187 -0.8% 235 +1.3%
Historical Pending Sales by Month
A count of the properties on which offers have been accepted in a given month.
Current as of August 11, 2017. All data from the San Francisco MLS. Report © 2017 ShowingTime. | 5
209
251
169
258
169
209
Single Family Condo/TIC/Coop
July
0
100
200
300
400
1-2005 1-2006 1-2007 1-2008 1-2009 1-2010 1-2011 1-2012 1-2013 1-2014 1-2015 1-2016 1-2017
Single Family Condo/TIC/Coop
1,343
1,769
1,279
1,646
1,300
1,680
Single Family Condo/TIC/Coop
Year to Date
2015 2016 2017
- 19.0%+ 2.8%0.0%- 19.1% - 7.0%+ 1.6%- 4.8% + 2.1%
2015 2016 2017 2015 2016 2017 2015 2016 2017
- 7.9% - 1.4% - 6.8%- 8.4%
Sold Listings
Sold Listings
Single
Family
Year-Over-Year
Change
Condo/TIC/
Coop
Year-Over-Year
Change
Aug-2016 191 -3.5% 259 +13.1%
Sep-2016 178 +8.5% 234 +29.3%
Oct-2016 227 -7.0% 236 -11.3%
Nov-2016 206 +9.6% 263 +27.1%
Dec-2016 200 -3.8% 238 -15.9%
Jan-2017 106 +1.9% 150 +0.7%
Feb-2017 111 +8.8% 156 -7.1%
Mar-2017 173 +9.5% 286 +13.9%
Apr-2017 203 -2.9% 232 +4.5%
May-2017 214 +7.0% 268 +3.9%
Jun-2017 228 -6.9% 320 +19.4%
Jul-2017 203 +0.5% 226 -9.2%
12-Month Avg 187 +0.8% 239 +5.0%
Historical Sold Listings by Month
A count of the actual sales that closed in a given month.
Current as of August 11, 2017. All data from the San Francisco MLS. Report © 2017 ShowingTime. | 6
236
272
202
249
203
226
Single Family Condo/TIC/Coop
July
0
100
200
300
400
1-2005 1-2006 1-2007 1-2008 1-2009 1-2010 1-2011 1-2012 1-2013 1-2014 1-2015 1-2016 1-2017
Single Family Condo/TIC/Coop
1,307
1,720
1,220
1,565
1,238
1,638
Single Family Condo/TIC/Coop
Year to Date
2015 2016 2017
- 9.2%- 8.5%+ 0.5%- 14.4% - 9.0%+ 1.5%- 6.7% + 4.7%
2015 2016 2017 2015 2016 2017 2015 2016 2017
+ 3.5% - 1.2% - 7.1%- 1.8%
Median Sales Price
Median Sales Price
Single
Family
Year-Over-Year
Change
Condo/TIC/
Coop
Year-Over-Year
Change
Aug-2016 $1,250,000 +2.0% $1,060,000 +1.4%
Sep-2016 $1,216,875 +5.4% $1,022,500 -1.7%
Oct-2016 $1,400,000 +10.5% $1,137,500 +3.4%
Nov-2016 $1,353,000 +7.2% $1,058,000 -6.0%
Dec-2016 $1,301,511 +8.3% $1,011,000 -7.9%
Jan-2017 $1,250,000 +7.1% $1,000,000 -5.7%
Feb-2017 $1,290,000 -7.2% $1,192,500 +8.7%
Mar-2017 $1,350,000 -0.2% $1,137,500 +3.9%
Apr-2017 $1,380,000 0.0% $1,100,000 -4.3%
May-2017 $1,500,838 +11.2% $1,176,500 +8.7%
Jun-2017 $1,462,989 +10.4% $1,125,000 -4.3%
Jul-2017 $1,431,000 +9.7% $1,175,000 +12.4%
12-Month Avg* $1,350,000 +4.0% $1,100,000 0.0%
Historical Median Sales Price by Month
Point at which half of the sales sold for more and half sold for less, not accounting for seller concessions, in a given month.
* Median Sales Price for all properties from August 2016 through July 2017. This is not the
average of the individual figures above.
Current as of August 11, 2017. All data from the San Francisco MLS. Report © 2017 ShowingTime. | 7
$1,280,000
$1,033,509
$1,305,000
$1,045,000
$1,431,000
$1,175,000
Single Family Condo/TIC/Coop
July
$400,000
$600,000
$800,000
$1,000,000
$1,200,000
$1,400,000
$1,600,000
1-2005 1-2006 1-2007 1-2008 1-2009 1-2010 1-2011 1-2012 1-2013 1-2014 1-2015 1-2016 1-2017
Single Family Condo/TIC/Coop
$1,250,000
$1,079,500
$1,339,000
$1,100,000
$1,401,000
$1,136,250
Single Family Condo/TIC/Coop
Year to Date
2015 2016 2017
+ 12.4%+ 1.1%+ 9.7%+ 2.0% + 1.9%+ 4.6%+ 7.1% + 3.3%
2015 2016 2017 2015 2016 2017 2015 2016 2017
+ 18.4% + 19.0% + 14.8%+ 8.8%
Average Sales Price
Avg. Sales Price
Single
Family
Year-Over-Year
Change
Condo/TIC/
Coop
Year-Over-Year
Change
Aug-2016 $1,537,059 +2.1% $1,228,996 +6.0%
Sep-2016 $1,487,123 +6.9% $1,208,673 +3.6%
Oct-2016 $2,000,319 +23.1% $1,263,882 +6.7%
Nov-2016 $1,767,029 +3.9% $1,140,559 -9.4%
Dec-2016 $1,658,512 +10.8% $1,249,670 -0.0%
Jan-2017 $1,633,150 +4.0% $1,161,831 -0.6%
Feb-2017 $1,684,181 +4.5% $1,367,391 +13.1%
Mar-2017 $1,891,127 +6.0% $1,283,105 +2.2%
Apr-2017 $1,880,160 +6.3% $1,296,502 -5.2%
May-2017 $1,856,243 +13.7% $1,349,675 +6.3%
Jun-2017 $1,735,790 -0.9% $1,355,502 +11.3%
Jul-2017 $1,777,879 +3.3% $1,267,396 +5.1%
12-Month Avg* $1,754,853 +7.2% $1,267,104 +3.1%
Historical Average Sales Price by Month
Average sales price for all closed sales, not accounting for seller concessions, in a given month.
* Avg. Sales Price for all properties from August 2016 through July 2017. This is not the average
of the individual figures above.
Current as of August 11, 2017. All data from the San Francisco MLS. Report © 2017 ShowingTime. | 8
$1,657,986
$1,214,445
$1,721,337
$1,206,077
$1,777,879
$1,267,396
Single Family Condo/TIC/Coop
July
$500,000
$750,000
$1,000,000
$1,250,000
$1,500,000
$1,750,000
$2,000,000
$2,250,000
1-2005 1-2006 1-2007 1-2008 1-2009 1-2010 1-2011 1-2012 1-2013 1-2014 1-2015 1-2016 1-2017
Single Family Condo/TIC/Coop
$1,694,255
$1,266,372
$1,706,946
$1,246,400
$1,795,477
$1,304,792
Single Family Condo/TIC/Coop
Year to Date
2015 2016 2017
+ 5.1%- 0.7%+ 3.3%+ 3.8% - 1.6%+ 5.2%+ 0.7% + 4.7%
2015 2016 2017 2015 2016 2017 2015 2016 2017
+ 17.9% + 17.0% + 14.8%+ 11.0%
Days on Market Until Sale
Days on Market
Single
Family
Year-Over-Year
Change
Condo/TIC/
Coop
Year-Over-Year
Change
Aug-2016 33 +17.9% 46 +58.6%
Sep-2016 41 +51.9% 40 +17.6%
Oct-2016 27 0.0% 34 +30.8%
Nov-2016 38 +35.7% 40 +17.6%
Dec-2016 41 +24.2% 48 +11.6%
Jan-2017 42 +5.0% 59 +34.1%
Feb-2017 34 +9.7% 36 +2.9%
Mar-2017 31 +24.0% 32 +6.7%
Apr-2017 26 -18.8% 32 -15.8%
May-2017 23 -11.5% 33 0.0%
Jun-2017 27 -6.9% 37 +5.7%
Jul-2017 24 -25.0% 33 -15.4%
12-Month Avg* 31 +7.1% 38 +10.6%
Historical Days on Market Until Sale by Month
Average number of days between when a property is listed and when an offer is accepted in a given month.
* Days on Market for all properties from August 2016 through July 2017. This is not the average
of the individual figures above.
Current as of August 11, 2017. All data from the San Francisco MLS. Report © 2017 ShowingTime. | 9
25
29
32
39
24
33
Single Family Condo/TIC/Coop
July
20
40
60
80
100
120
1-2005 1-2006 1-2007 1-2008 1-2009 1-2010 1-2011 1-2012 1-2013 1-2014 1-2015 1-2016 1-2017
Single Family Condo/TIC/Coop
26
3030
36
28
36
Single Family Condo/TIC/Coop
Year to Date
2015 2016 2017
- 15.4%+ 34.5%- 25.0%+ 28.0% + 20.0%- 6.7%+ 15.4% 0.0%
2015 2016 2017 2015 2016 2017 2015 2016 2017
- 16.7% - 16.1% - 11.8%- 12.1%
Inventory of Active Listings
Active Listings
Single
Family
Year-Over-Year
Change
Condo/TIC/
Coop
Year-Over-Year
Change
Aug-2016 416 +6.9% 683 +39.7%
Sep-2016 530 +10.6% 825 +22.4%
Oct-2016 489 +10.9% 800 +22.1%
Nov-2016 383 +5.5% 590 +9.3%
Dec-2016 260 +13.0% 403 +8.0%
Jan-2017 321 +7.0% 550 +11.3%
Feb-2017 355 -8.3% 624 +12.6%
Mar-2017 385 -14.1% 623 -4.7%
Apr-2017 403 -17.1% 631 -12.7%
May-2017 406 -13.1% 628 -15.7%
Jun-2017 337 -23.8% 558 -30.4%
Jul-2017 298 -35.6% 491 -31.9%
12-Month Avg* 382 -6.4% 617 -0.2%
Historical Inventory of Active Listings by Month
The number of properties available for sale in active status at the end of a given month.
* Active Listings for all properties from August 2016 through July 2017. This is not the average of
the individual figures above.
Current as of August 11, 2017. All data from the San Francisco MLS. Report © 2017 ShowingTime. | 10
405
484463
721
298
491
Single Family Condo/TIC/Coop
July
200
400
600
800
1,000
1,200
1,400
1,600
1-2005 1-2006 1-2007 1-2008 1-2009 1-2010 1-2011 1-2012 1-2013 1-2014 1-2015 1-2016 1-2017
Single Family Condo/TIC/Coop
2015 2016 2017
- 31.9%+ 49.0%- 35.6%+ 14.3%
2015 2016 2017
- 4.7% - 17.7%
% of Properties Sold Over List Price
% of Properties
Sold Over List Price
Single
Family
Year-Over-Year
Change
Condo/TIC/
Coop
Year-Over-Year
Change
Aug-2016 75.9% -15.1% 48.6% -32.6%
Sep-2016 77.5% -12.3% 58.1% -19.1%
Oct-2016 78.9% -5.2% 53.8% -29.5%
Nov-2016 72.8% -6.3% 63.1% -9.3%
Dec-2016 69.0% -13.0% 42.0% -29.3%
Jan-2017 62.3% -18.0% 38.7% -27.0%
Feb-2017 78.4% +1.2% 58.3% 0.0%
Mar-2017 74.6% -9.4% 62.2% -8.1%
Apr-2017 77.3% +2.2% 62.1% +2.8%
May-2017 79.4% -0.1% 61.9% -8.2%
Jun-2017 80.3% +11.8% 59.1% -5.1%
Jul-2017 81.3% +6.7% 64.2% +9.6%
12-Month Avg 76.2% -4.4% 56.7% -12.9%
Historical % of Properties Sold Over List Price by Month
Percentage found when dividing the number of properties sold by properties sold over its original list price, not accounting for seller
concessions.
* % of Properties Sold Over List Price for all properties from August 2016 through July 2017. This
is not the average of the individual figures above.
Current as of August 11, 2017. All data from the San Francisco MLS. Report © 2017 ShowingTime. | 11
84.3%
73.9%76.2%
58.6%
81.3%
64.2%
Single Family Condo/TIC/Coop
July
0.0%
20.0%
40.0%
60.0%
80.0%
100.0%
1-2005 1-2006 1-2007 1-2008 1-2009 1-2010 1-2011 1-2012 1-2013 1-2014 1-2015 1-2016 1-2017
Single Family Condo/TIC/Coop
81.4%
71.0%
76.6%
61.9%
77.3%
59.3%
Single Family Condo/TIC/Coop
Year to Date
2015 2016 2017
+ 9.6%- 20.7%+ 6.7%- 9.6% - 12.8%+ 0.9%- 5.9% - 4.2%
2015 2016 2017 2015 2016 2017 2015 2016 2017
- 2.0% + 0.7% + 3.3%+ 3.4%
% of List Price Received
% of List Price
Received
Single
Family
Year-Over-Year
Change
Condo/TIC/
Coop
Year-Over-Year
Change
Aug-2016 111.5% -4.9% 102.9% -5.3%
Sep-2016 110.8% -5.9% 104.2% -4.1%
Oct-2016 111.2% -2.9% 104.2% -4.7%
Nov-2016 109.1% -2.9% 104.6% -2.7%
Dec-2016 108.4% -3.5% 101.5% -2.7%
Jan-2017 107.6% -3.1% 101.4% -2.3%
Feb-2017 113.8% +1.1% 104.1% -1.7%
Mar-2017 112.4% -2.0% 105.0% -1.2%
Apr-2017 115.4% +1.9% 105.1% -0.1%
May-2017 115.5% +0.3% 105.5% -0.6%
Jun-2017 117.0% +6.1% 105.8% +0.5%
Jul-2017 117.2% +4.8% 106.3% +1.4%
12-Month Avg* 112.7% -0.8% 104.4% -1.9%
Historical % of List Price Received by Month
Percentage found when dividing a property’s sales price by its most recent list price, then taking the average for all properties sold in a given
month, not accounting for seller concessions.
* % of List Price Received for all properties from August 2016 through July 2017. This is not the
average of the individual figures above.
Current as of August 11, 2017. All data from the San Francisco MLS. Report © 2017 ShowingTime. | 12
117.8%
109.2%111.8%
104.8%
117.2%
106.3%
Single Family Condo/TIC/Coop
July
115.8%
109.4%112.7%
105.4%
114.8%
105.0%
Single Family Condo/TIC/Coop
Year to Date
95.0%
100.0%
105.0%
110.0%
115.0%
120.0%
1-2005 1-2006 1-2007 1-2008 1-2009 1-2010 1-2011 1-2012 1-2013 1-2014 1-2015 1-2016 1-2017
Single Family Condo/TIC/Coop
2015 2016 2017
+ 1.4%- 4.0%+ 4.8%- 5.1%
2015 2016 2017
+ 3.2% + 1.0%
2015 2016 2017
- 0.4%- 3.7%+ 1.9%- 2.7%
2015 2016 2017
+ 2.4% + 1.7%
Housing Affordability Ratio
Affordability Ratio
Single
Family
Year-Over-Year
Change
Condo/TIC/
Coop
Year-Over-Year
Change
Aug-2016 43 +10.3% 59 +11.3%
Sep-2016 44 +4.8% 61 +13.0%
Oct-2016 39 +2.6% 56 +9.8%
Nov-2016 38 0.0% 56 +12.0%
Dec-2016 38 -5.0% 56 +9.8%
Jan-2017 39 -11.4% 56 0.0%
Feb-2017 39 +2.6% 49 -12.5%
Mar-2017 37 -5.1% 51 -8.9%
Apr-2017 37 -2.6% 54 +1.9%
May-2017 34 -12.8% 51 -8.9%
Jun-2017 35 -12.5% 53 0.0%
Jul-2017 36 -12.2% 51 -13.6%
12-Month Avg* 38 -9.4% 40 -5.9%
Historical Housing Affordability Ratio by Month
This index measures housing affordability for the region. For example, an index of 120 means the median household income is 120% of what is
necessary to qualify for the median-priced home under prevailing interest rates. A higher number means greater affordability.
* Affordability Ratio for all properties from August 2016 through July 2017. This is not the average
of the individual figures above.
Current as of August 11, 2017. All data from the San Francisco MLS. Report © 2017 ShowingTime. | 13
37
54
41
59
36
51
Single Family Condo/TIC/Coop
July
30
40
50
60
70
80
90
100
1-2005 1-2006 1-2007 1-2008 1-2009 1-2010 1-2011 1-2012 1-2013 1-2014 1-2015 1-2016 1-2017
Single Family Condo/TIC/Coop
2015 2016 2017
- 13.6%+ 9.3%- 12.2%+ 10.8%
2015 2016 2017
- 11.9% - 1.8%
38
51
40
57
37
53
Single Family Condo/TIC/Coop
Year to Date
2015 2016 2017
- 7.0%+ 11.8%- 7.5%+ 5.3%
2015 2016 2017
- 11.6% - 7.3%
Months Supply of Inventory
Months Supply
Single
Family
Year-Over-Year
Change
Condo/TIC/
Coop
Year-Over-Year
Change
Aug-2016 2.2 +10.0% 2.9 +45.0%
Sep-2016 2.8 +16.7% 3.5 +29.6%
Oct-2016 2.7 +22.7% 3.5 +29.6%
Nov-2016 2.1 +10.5% 2.5 +13.6%
Dec-2016 1.4 +16.7% 1.7 +13.3%
Jan-2017 1.7 +6.3% 2.4 +20.0%
Feb-2017 1.9 -5.0% 2.7 +17.4%
Mar-2017 2.1 -12.5% 2.6 -3.7%
Apr-2017 2.2 -15.4% 2.7 -12.9%
May-2017 2.2 -12.0% 2.6 -18.8%
Jun-2017 1.8 -21.7% 2.3 -34.3%
Jul-2017 1.6 -36.0% 2.1 -32.3%
12-Month Avg* 2.1 -3.1% 2.6 +2.1%
Historical Months Supply of Inventory by Month
The inventory of homes for sale at the end of a given month, divided by the average monthly pending sales from the last 12 months.
* Months Supply for all properties from August 2016 through July 2017. This is not the average of
the individual figures above.
Current as of August 11, 2017. All data from the San Francisco MLS. Report © 2017 ShowingTime. | 14
2.0 1.9
2.5
3.1
1.6
2.1
Single Family Condo/TIC/Coop
July
0.0
2.0
4.0
6.0
8.0
10.0
1-2005 1-2006 1-2007 1-2008 1-2009 1-2010 1-2011 1-2012 1-2013 1-2014 1-2015 1-2016 1-2017
Single Family Condo/TIC/Coop
2015 2016 2017
- 32.3%+ 63.2%- 36.0%+ 25.0%
2015 2016 2017
- 4.8% - 13.6%
All Properties Activity Overview
Key metrics by report month and for year-to-date (YTD) starting from the first of the year.
Key Metrics Historical Sparkbars 7-2016 7-2017 Percent Change YTD 2016 YTD 2017 Percent Change
Current as of August 11, 2017. All data from the San Francisco MLS. Report © 2017 ShowingTime. | 15
Months Supply 2.8 1.9 - 32.1% -- -- --
Affordability Ratio 44 40 - 9.1%
% of List Price Received 108.0% 111.4% + 3.1% 108.6%
43
67.0% - 1.9%
+ 0.6%
40 - 7.0%
109.2%
% of Properties Sold Over List Price 66.5% 72.3% + 8.7% 68.3%
Active Listings 1,184 789 - 33.4% --
Avg. Sales Price $1,436,859 $1,508,953 + 5.0% $1,448,148
Days on Market 36 29 - 19.4% 33
$1,250,000 + 4.2%
+ 4.7%
33 0.0%
$1,516,012
-- --
Sold Listings 451 429 - 4.9% 2,785 2,876 + 3.3%
Median Sales Price $1,152,000 $1,260,000 + 9.4% $1,200,000
- 11.3%
Pending Sales 427 378 - 11.5% 2,925 2,980 + 1.9%
New Listings 511 387 - 24.3% 4,134 3,667
7-2014 7-2015 7-2016 7-2017
7-2014 7-2015 7-2016 7-2017
7-2014 7-2015 7-2016 7-2017
7-2014 7-2015 7-2016 7-2017
7-2014 7-2015 7-2016 7-2017
7-2014 7-2015 7-2016 7-2017
7-2014 7-2015 7-2016 7-2017
7-2014 7-2015 7-2016 7-2017
7-2014 7-2015 7-2016 7-2017
7-2014 7-2015 7-2016 7-2017
7-2014 7-2015 7-2016 7-2017
Activity by District
SF District 1: Northwest (Sea Cliff, Lake, Jordan Park / Laurel Heights, Outer Richmond, Central Richmond, Inner Richmond, Lone Mountain)
SF District 2: Central West (Outer Sunset, Central Sunset, Inner Sunset, Outer Parkside, Parkside, Inner Parkside, Golden Gate Heights)
SF District 3: Southwest (Pine Lake Park, Lake Shore, Merced Manor, Stonestown, Lakeside, Merced Heights, Ingleside, Ingleside Heights, Oceanview)
SF District 4: Twin Peaks W (Forest Hill (& Ext), W Portal, St Francis Wd, Balboa Terr, Mt Dav Manor, Ingleside Terr, Monterey Hts, Wstwd Pk & H'lnds, Shrwd Fst, Miraloma Pk, Dmnd Hts, Mdtwn Terr)
SF District 5: Central (Haight Ashbury, Cole Vly / Prnssus Hts, Clarndn Hts, Corona Hts, Twin Pks, Glen Pk, Noe Vly, Eureka Vly / Dolores Hts, Mission Dolores, Duboce Trngl, Buena Vista / Ashbury Hts)
SF District 6: Central North (Lower Pacific Heights, Anza Vista, Western Addition, North Panhandle, Alamo Square, Hayes Valley)
SF District 7: North (Marina, Cow Hollow, Presidio Heights, Pacific Heights)
SF District 8: Northeast (North Waterfront, North Beach, Russian Hill, Telegraph Hill, Nob Hill, Financial District / Barbary Coast, Downtown, Van Ness / Civic Center, Tenderloin)
SF District 9: Central East (Yerba Buena, South Beach, South of Market, Mission Bay, Inner Mission, Potrero Hill, Central Waterfront / Dogpatch, Bernal Heights)
SF District 10: Southeast (Outer Mission, Mission Terr, Excelsior, Portola, Bayview, Silver Terr, Hunters Pt, Candlestick Pt, Bayview Hts, Little Hollywood, Visitation Vly, Crocker Amazon)
7-2016 7-2017 + / – 7-2016 7-2017 + / – 7-2016 7-2017 + / – 7-2016 7-2017 + / – 7-2016 7-2017 + / –
Single Family
1 SF District 1 35 11 -68.6% 12 16 +33.3% $2,275,000 $1,950,000 -14.3% 26 27 +3.8% 2.5 0.7 -72.0%
2 SF District 2 51 42 -17.6% 37 44 +18.9% $1,280,000 $1,330,000 +3.9% 26 19 -26.9% 1.5 1.3 -13.3%
3 SF District 3 33 21 -36.4% 16 16 0.0% $1,172,500 $1,125,000 -4.1% 27 27 0.0% 2.0 1.6 -20.0%
4 SF District 4 66 27 -59.1% 32 23 -28.1% $1,405,000 $1,505,000 +7.1% 35 22 -37.1% 2.5 1.1 -56.0%
5 SF District 5 61 37 -39.3% 27 23 -14.8% $1,950,000 $2,275,000 +16.7% 34 21 -38.2% 2.5 1.4 -44.0%
6 SF District 6 10 5 -50.0% 2 3 +50.0% $1,962,000 $2,400,000 +22.3% 61 23 -62.3% 3.7 1.5 -59.5%
7 SF District 7 34 25 -26.5% 12 16 +33.3% $4,119,500 $3,546,875 -13.9% 73 40 -45.2% 4.3 3.0 -30.2%
8 SF District 8 13 9 -30.8% 0 1 -- $0 $1,955,000 -- 0 41 -- 5.8 3.6 -37.9%
9 SF District 9 53 45 -15.1% 22 27 +22.7% $1,395,000 $1,500,000 +7.5% 20 23 +15.0% 2.4 2.1 -12.5%
10 SF District 10 107 76 -29.0% 42 34 -19.0% $795,000 $969,000 +21.9% 33 27 -18.2% 2.8 2.0 -28.6%
Condo/TIC/Coop
1 SF District 1 40 13 -67.5% 14 11 -21.4% $1,032,500 $1,080,000 +4.6% 27 19 -29.6% 3.3 1.3 -60.6%
2 SF District 2 16 5 -68.8% 5 3 -40.0% $990,000 $850,000 -14.1% 33 49 +48.5% 3.7 1.4 -62.2%
3 SF District 3 9 4 -55.6% 4 3 -25.0% $730,000 $680,000 -6.8% 29 37 +27.6% 2.0 1.2 -40.0%
4 SF District 4 7 8 +14.3% 2 1 -50.0% $662,500 $465,000 -29.8% 55 48 -12.7% 2.3 2.8 +21.7%
5 SF District 5 85 40 -52.9% 44 30 -31.8% $1,150,000 $1,382,500 +20.2% 29 21 -27.6% 2.5 1.1 -56.0%
6 SF District 6 98 46 -53.1% 38 20 -47.4% $1,027,500 $1,210,000 +17.8% 41 29 -29.3% 3.8 1.7 -55.3%
7 SF District 7 63 40 -36.5% 24 19 -20.8% $1,175,000 $1,600,000 +36.2% 40 22 -45.0% 3.0 1.4 -53.3%
8 SF District 8 102 102 0.0% 35 42 +20.0% $1,100,000 $1,113,575 +1.2% 35 37 +5.7% 2.6 2.6 0.0%
9 SF District 9 274 209 -23.7% 79 92 +16.5% $950,000 $1,065,000 +12.1% 47 39 -17.0% 3.3 2.6 -21.2%
10 SF District 10 27 24 -11.1% 4 5 +25.0% $625,000 $650,000 +4.0% 19 30 +57.9% 4.8 3.5 -27.1%
Key metrics by report month for the districts of San Fransisco.
Current as of August 11, 2017. All data from the San Francisco MLS. Report © 2017 ShowingTime. | 16
Active Listings Sold Listings Median Sales Price Days on Market Months Supply

More Related Content

What's hot

San Francisco Market Focus March 2017
San Francisco Market Focus March 2017San Francisco Market Focus March 2017
San Francisco Market Focus March 2017Ronny Budiutama
 
San Francisco Market Focus February 2017
San Francisco Market Focus February 2017San Francisco Market Focus February 2017
San Francisco Market Focus February 2017Ronny Budiutama
 
San Francisco Real Estate Housing Market January 2017
San Francisco Real Estate Housing Market January 2017San Francisco Real Estate Housing Market January 2017
San Francisco Real Estate Housing Market January 2017Ronny Budiutama
 
San Francisco Market Focus July 2016
San Francisco Market Focus July 2016San Francisco Market Focus July 2016
San Francisco Market Focus July 2016Ronny Budiutama
 
San Francisco Market Focus April 2016
San Francisco Market Focus April 2016San Francisco Market Focus April 2016
San Francisco Market Focus April 2016Ronny Budiutama
 
San Francisco Market Focus Report May
San Francisco Market Focus Report MaySan Francisco Market Focus Report May
San Francisco Market Focus Report MayRonny Budiutama
 
San Francisco Market Focus July 2015
San Francisco Market Focus July 2015San Francisco Market Focus July 2015
San Francisco Market Focus July 2015Ronny Budiutama
 
San Francisco Market Focus Report October 2018
San Francisco Market Focus Report October 2018San Francisco Market Focus Report October 2018
San Francisco Market Focus Report October 2018Ronny Budiutama
 
San Francisco Market Focus August 2016
San Francisco Market Focus August 2016San Francisco Market Focus August 2016
San Francisco Market Focus August 2016Ronny Budiutama
 
San Francisco Market Focus September 2016
San Francisco Market Focus September 2016San Francisco Market Focus September 2016
San Francisco Market Focus September 2016Ronny Budiutama
 
San Francisco Real Estate Housing Market December 2016
San Francisco Real Estate Housing Market December 2016San Francisco Real Estate Housing Market December 2016
San Francisco Real Estate Housing Market December 2016Ronny Budiutama
 
San Francisco Market Focus March 2015
San Francisco Market Focus March 2015San Francisco Market Focus March 2015
San Francisco Market Focus March 2015Ronny Budiutama
 
San Francisco Market Focus May 2016
San Francisco Market Focus May 2016San Francisco Market Focus May 2016
San Francisco Market Focus May 2016Ronny Budiutama
 
San Francisco Market Focus July 2014
San Francisco Market Focus July 2014San Francisco Market Focus July 2014
San Francisco Market Focus July 2014Ronny Budiutama
 
San Francisco Market Focus April 2015
San Francisco Market Focus April 2015San Francisco Market Focus April 2015
San Francisco Market Focus April 2015Ronny Budiutama
 
December 2016 Greater Boston Real Estate Market Trends
December 2016 Greater Boston Real Estate Market TrendsDecember 2016 Greater Boston Real Estate Market Trends
December 2016 Greater Boston Real Estate Market TrendsJoe Schutt
 
San Francisco Market Focus June 2014
San Francisco Market Focus June 2014San Francisco Market Focus June 2014
San Francisco Market Focus June 2014Ronny Budiutama
 
Greater Boston Association of Realtors January 2017 Monthly Indicators Report
Greater Boston Association of Realtors January 2017 Monthly Indicators ReportGreater Boston Association of Realtors January 2017 Monthly Indicators Report
Greater Boston Association of Realtors January 2017 Monthly Indicators ReportJoe Schutt
 
San Francisco Market Focus October 2014
San Francisco Market Focus October 2014San Francisco Market Focus October 2014
San Francisco Market Focus October 2014Ronny Budiutama
 
San Francisco Market Focus June 2016
San Francisco Market Focus June 2016San Francisco Market Focus June 2016
San Francisco Market Focus June 2016Ronny Budiutama
 

What's hot (20)

San Francisco Market Focus March 2017
San Francisco Market Focus March 2017San Francisco Market Focus March 2017
San Francisco Market Focus March 2017
 
San Francisco Market Focus February 2017
San Francisco Market Focus February 2017San Francisco Market Focus February 2017
San Francisco Market Focus February 2017
 
San Francisco Real Estate Housing Market January 2017
San Francisco Real Estate Housing Market January 2017San Francisco Real Estate Housing Market January 2017
San Francisco Real Estate Housing Market January 2017
 
San Francisco Market Focus July 2016
San Francisco Market Focus July 2016San Francisco Market Focus July 2016
San Francisco Market Focus July 2016
 
San Francisco Market Focus April 2016
San Francisco Market Focus April 2016San Francisco Market Focus April 2016
San Francisco Market Focus April 2016
 
San Francisco Market Focus Report May
San Francisco Market Focus Report MaySan Francisco Market Focus Report May
San Francisco Market Focus Report May
 
San Francisco Market Focus July 2015
San Francisco Market Focus July 2015San Francisco Market Focus July 2015
San Francisco Market Focus July 2015
 
San Francisco Market Focus Report October 2018
San Francisco Market Focus Report October 2018San Francisco Market Focus Report October 2018
San Francisco Market Focus Report October 2018
 
San Francisco Market Focus August 2016
San Francisco Market Focus August 2016San Francisco Market Focus August 2016
San Francisco Market Focus August 2016
 
San Francisco Market Focus September 2016
San Francisco Market Focus September 2016San Francisco Market Focus September 2016
San Francisco Market Focus September 2016
 
San Francisco Real Estate Housing Market December 2016
San Francisco Real Estate Housing Market December 2016San Francisco Real Estate Housing Market December 2016
San Francisco Real Estate Housing Market December 2016
 
San Francisco Market Focus March 2015
San Francisco Market Focus March 2015San Francisco Market Focus March 2015
San Francisco Market Focus March 2015
 
San Francisco Market Focus May 2016
San Francisco Market Focus May 2016San Francisco Market Focus May 2016
San Francisco Market Focus May 2016
 
San Francisco Market Focus July 2014
San Francisco Market Focus July 2014San Francisco Market Focus July 2014
San Francisco Market Focus July 2014
 
San Francisco Market Focus April 2015
San Francisco Market Focus April 2015San Francisco Market Focus April 2015
San Francisco Market Focus April 2015
 
December 2016 Greater Boston Real Estate Market Trends
December 2016 Greater Boston Real Estate Market TrendsDecember 2016 Greater Boston Real Estate Market Trends
December 2016 Greater Boston Real Estate Market Trends
 
San Francisco Market Focus June 2014
San Francisco Market Focus June 2014San Francisco Market Focus June 2014
San Francisco Market Focus June 2014
 
Greater Boston Association of Realtors January 2017 Monthly Indicators Report
Greater Boston Association of Realtors January 2017 Monthly Indicators ReportGreater Boston Association of Realtors January 2017 Monthly Indicators Report
Greater Boston Association of Realtors January 2017 Monthly Indicators Report
 
San Francisco Market Focus October 2014
San Francisco Market Focus October 2014San Francisco Market Focus October 2014
San Francisco Market Focus October 2014
 
San Francisco Market Focus June 2016
San Francisco Market Focus June 2016San Francisco Market Focus June 2016
San Francisco Market Focus June 2016
 

Similar to San Francisco Market Focus July 2017

San Francisco Market Focus August 2017
San Francisco Market Focus August 2017San Francisco Market Focus August 2017
San Francisco Market Focus August 2017Ronny Budiutama
 
San Francisco Market Focus March 2018
San Francisco Market Focus March 2018San Francisco Market Focus March 2018
San Francisco Market Focus March 2018Ronny Budiutama
 
San Francisco Market Focus Report September 2018
San Francisco Market Focus Report September 2018San Francisco Market Focus Report September 2018
San Francisco Market Focus Report September 2018Ronny Budiutama
 
San Francisco market focus report June 2018
San Francisco market focus report June 2018San Francisco market focus report June 2018
San Francisco market focus report June 2018Ronny Budiutama
 
San Francisco Market Focus November 2016
San Francisco Market Focus November 2016San Francisco Market Focus November 2016
San Francisco Market Focus November 2016Ronny Budiutama
 
San Francisco Market Focus Report Aug 2018
San Francisco Market Focus Report Aug 2018San Francisco Market Focus Report Aug 2018
San Francisco Market Focus Report Aug 2018Ronny Budiutama
 
San Francisco Market Focus April 2018
San Francisco Market Focus April 2018San Francisco Market Focus April 2018
San Francisco Market Focus April 2018Ronny Budiutama
 
San Francisco Market Focus Report December 2018
San Francisco Market Focus Report December 2018San Francisco Market Focus Report December 2018
San Francisco Market Focus Report December 2018Ronny Budiutama
 
San Francisco Market Focus February 2018
San Francisco Market Focus February 2018San Francisco Market Focus February 2018
San Francisco Market Focus February 2018Ronny Budiutama
 
January 2018 San Francisco Market Update
January 2018 San Francisco Market UpdateJanuary 2018 San Francisco Market Update
January 2018 San Francisco Market UpdateRonny Budiutama
 
San Francisco Market Focus October 2016
San Francisco Market Focus October 2016San Francisco Market Focus October 2016
San Francisco Market Focus October 2016Ronny Budiutama
 
San Francisco Market Focus Report July 2019
San Francisco Market Focus Report July 2019San Francisco Market Focus Report July 2019
San Francisco Market Focus Report July 2019Ronny Budiutama
 
San Francisco Market Focus Report May 2019
San Francisco Market Focus Report May 2019San Francisco Market Focus Report May 2019
San Francisco Market Focus Report May 2019Ronny Budiutama
 
San Francisco Market Focus June 2015
San Francisco Market Focus June 2015San Francisco Market Focus June 2015
San Francisco Market Focus June 2015Ronny Budiutama
 
San Francisco Market Focus December 2015
San Francisco Market Focus December 2015San Francisco Market Focus December 2015
San Francisco Market Focus December 2015Ronny Budiutama
 

Similar to San Francisco Market Focus July 2017 (15)

San Francisco Market Focus August 2017
San Francisco Market Focus August 2017San Francisco Market Focus August 2017
San Francisco Market Focus August 2017
 
San Francisco Market Focus March 2018
San Francisco Market Focus March 2018San Francisco Market Focus March 2018
San Francisco Market Focus March 2018
 
San Francisco Market Focus Report September 2018
San Francisco Market Focus Report September 2018San Francisco Market Focus Report September 2018
San Francisco Market Focus Report September 2018
 
San Francisco market focus report June 2018
San Francisco market focus report June 2018San Francisco market focus report June 2018
San Francisco market focus report June 2018
 
San Francisco Market Focus November 2016
San Francisco Market Focus November 2016San Francisco Market Focus November 2016
San Francisco Market Focus November 2016
 
San Francisco Market Focus Report Aug 2018
San Francisco Market Focus Report Aug 2018San Francisco Market Focus Report Aug 2018
San Francisco Market Focus Report Aug 2018
 
San Francisco Market Focus April 2018
San Francisco Market Focus April 2018San Francisco Market Focus April 2018
San Francisco Market Focus April 2018
 
San Francisco Market Focus Report December 2018
San Francisco Market Focus Report December 2018San Francisco Market Focus Report December 2018
San Francisco Market Focus Report December 2018
 
San Francisco Market Focus February 2018
San Francisco Market Focus February 2018San Francisco Market Focus February 2018
San Francisco Market Focus February 2018
 
January 2018 San Francisco Market Update
January 2018 San Francisco Market UpdateJanuary 2018 San Francisco Market Update
January 2018 San Francisco Market Update
 
San Francisco Market Focus October 2016
San Francisco Market Focus October 2016San Francisco Market Focus October 2016
San Francisco Market Focus October 2016
 
San Francisco Market Focus Report July 2019
San Francisco Market Focus Report July 2019San Francisco Market Focus Report July 2019
San Francisco Market Focus Report July 2019
 
San Francisco Market Focus Report May 2019
San Francisco Market Focus Report May 2019San Francisco Market Focus Report May 2019
San Francisco Market Focus Report May 2019
 
San Francisco Market Focus June 2015
San Francisco Market Focus June 2015San Francisco Market Focus June 2015
San Francisco Market Focus June 2015
 
San Francisco Market Focus December 2015
San Francisco Market Focus December 2015San Francisco Market Focus December 2015
San Francisco Market Focus December 2015
 

More from Ronny Budiutama

San Francisco January 2024 Market Report
San Francisco January 2024 Market ReportSan Francisco January 2024 Market Report
San Francisco January 2024 Market ReportRonny Budiutama
 
San Francisco December 2023 Market Report
San Francisco December 2023 Market ReportSan Francisco December 2023 Market Report
San Francisco December 2023 Market ReportRonny Budiutama
 
San Francisco November 2023 Market Report
San Francisco November 2023 Market ReportSan Francisco November 2023 Market Report
San Francisco November 2023 Market ReportRonny Budiutama
 
2023 Annual San Francisco Housing Market
2023 Annual San Francisco Housing Market2023 Annual San Francisco Housing Market
2023 Annual San Francisco Housing MarketRonny Budiutama
 
October 2023 Report: San Francisco Real Estate Market Insights
October 2023 Report: San Francisco Real Estate Market InsightsOctober 2023 Report: San Francisco Real Estate Market Insights
October 2023 Report: San Francisco Real Estate Market InsightsRonny Budiutama
 
CA Weekly MLS Market Data Report - August 2023
CA Weekly MLS Market Data Report - August 2023CA Weekly MLS Market Data Report - August 2023
CA Weekly MLS Market Data Report - August 2023Ronny Budiutama
 
San Francisco Market Report July 2023.pdf
San Francisco Market Report July 2023.pdfSan Francisco Market Report July 2023.pdf
San Francisco Market Report July 2023.pdfRonny Budiutama
 
San Francisco May 2023 Market Report.pdf
San Francisco May 2023 Market Report.pdfSan Francisco May 2023 Market Report.pdf
San Francisco May 2023 Market Report.pdfRonny Budiutama
 
San Francisco June 2023 Market Report.pdf
San Francisco June 2023 Market Report.pdfSan Francisco June 2023 Market Report.pdf
San Francisco June 2023 Market Report.pdfRonny Budiutama
 
San Francisco Market Report March 2023.pdf
San Francisco Market Report March 2023.pdfSan Francisco Market Report March 2023.pdf
San Francisco Market Report March 2023.pdfRonny Budiutama
 
San Francisco Market Report February 2023
San Francisco Market Report February 2023San Francisco Market Report February 2023
San Francisco Market Report February 2023Ronny Budiutama
 
San Francisco Market Report January 2023.pdf
San Francisco Market Report January 2023.pdfSan Francisco Market Report January 2023.pdf
San Francisco Market Report January 2023.pdfRonny Budiutama
 
Annual Report on the San Francisco County Housing Market.pdf
Annual Report on the San Francisco County Housing Market.pdfAnnual Report on the San Francisco County Housing Market.pdf
Annual Report on the San Francisco County Housing Market.pdfRonny Budiutama
 
San Francisco Market Report December 2022.pdf
San Francisco Market Report December 2022.pdfSan Francisco Market Report December 2022.pdf
San Francisco Market Report December 2022.pdfRonny Budiutama
 
San Francisco Market Report November 2022.pdf
San Francisco Market Report November 2022.pdfSan Francisco Market Report November 2022.pdf
San Francisco Market Report November 2022.pdfRonny Budiutama
 
San Francisco Market Report October 2022.pdf
San Francisco Market Report October 2022.pdfSan Francisco Market Report October 2022.pdf
San Francisco Market Report October 2022.pdfRonny Budiutama
 
San Francisco Market Report September 2022.pdf
San Francisco Market Report September 2022.pdfSan Francisco Market Report September 2022.pdf
San Francisco Market Report September 2022.pdfRonny Budiutama
 
San Francisco Market Report August 2022.pdf
San Francisco Market Report August 2022.pdfSan Francisco Market Report August 2022.pdf
San Francisco Market Report August 2022.pdfRonny Budiutama
 
San Francisco Market Report July 2022.pdf
San Francisco Market Report July 2022.pdfSan Francisco Market Report July 2022.pdf
San Francisco Market Report July 2022.pdfRonny Budiutama
 
San Francisco Market Report June 2022.pdf
San Francisco Market Report June 2022.pdfSan Francisco Market Report June 2022.pdf
San Francisco Market Report June 2022.pdfRonny Budiutama
 

More from Ronny Budiutama (20)

San Francisco January 2024 Market Report
San Francisco January 2024 Market ReportSan Francisco January 2024 Market Report
San Francisco January 2024 Market Report
 
San Francisco December 2023 Market Report
San Francisco December 2023 Market ReportSan Francisco December 2023 Market Report
San Francisco December 2023 Market Report
 
San Francisco November 2023 Market Report
San Francisco November 2023 Market ReportSan Francisco November 2023 Market Report
San Francisco November 2023 Market Report
 
2023 Annual San Francisco Housing Market
2023 Annual San Francisco Housing Market2023 Annual San Francisco Housing Market
2023 Annual San Francisco Housing Market
 
October 2023 Report: San Francisco Real Estate Market Insights
October 2023 Report: San Francisco Real Estate Market InsightsOctober 2023 Report: San Francisco Real Estate Market Insights
October 2023 Report: San Francisco Real Estate Market Insights
 
CA Weekly MLS Market Data Report - August 2023
CA Weekly MLS Market Data Report - August 2023CA Weekly MLS Market Data Report - August 2023
CA Weekly MLS Market Data Report - August 2023
 
San Francisco Market Report July 2023.pdf
San Francisco Market Report July 2023.pdfSan Francisco Market Report July 2023.pdf
San Francisco Market Report July 2023.pdf
 
San Francisco May 2023 Market Report.pdf
San Francisco May 2023 Market Report.pdfSan Francisco May 2023 Market Report.pdf
San Francisco May 2023 Market Report.pdf
 
San Francisco June 2023 Market Report.pdf
San Francisco June 2023 Market Report.pdfSan Francisco June 2023 Market Report.pdf
San Francisco June 2023 Market Report.pdf
 
San Francisco Market Report March 2023.pdf
San Francisco Market Report March 2023.pdfSan Francisco Market Report March 2023.pdf
San Francisco Market Report March 2023.pdf
 
San Francisco Market Report February 2023
San Francisco Market Report February 2023San Francisco Market Report February 2023
San Francisco Market Report February 2023
 
San Francisco Market Report January 2023.pdf
San Francisco Market Report January 2023.pdfSan Francisco Market Report January 2023.pdf
San Francisco Market Report January 2023.pdf
 
Annual Report on the San Francisco County Housing Market.pdf
Annual Report on the San Francisco County Housing Market.pdfAnnual Report on the San Francisco County Housing Market.pdf
Annual Report on the San Francisco County Housing Market.pdf
 
San Francisco Market Report December 2022.pdf
San Francisco Market Report December 2022.pdfSan Francisco Market Report December 2022.pdf
San Francisco Market Report December 2022.pdf
 
San Francisco Market Report November 2022.pdf
San Francisco Market Report November 2022.pdfSan Francisco Market Report November 2022.pdf
San Francisco Market Report November 2022.pdf
 
San Francisco Market Report October 2022.pdf
San Francisco Market Report October 2022.pdfSan Francisco Market Report October 2022.pdf
San Francisco Market Report October 2022.pdf
 
San Francisco Market Report September 2022.pdf
San Francisco Market Report September 2022.pdfSan Francisco Market Report September 2022.pdf
San Francisco Market Report September 2022.pdf
 
San Francisco Market Report August 2022.pdf
San Francisco Market Report August 2022.pdfSan Francisco Market Report August 2022.pdf
San Francisco Market Report August 2022.pdf
 
San Francisco Market Report July 2022.pdf
San Francisco Market Report July 2022.pdfSan Francisco Market Report July 2022.pdf
San Francisco Market Report July 2022.pdf
 
San Francisco Market Report June 2022.pdf
San Francisco Market Report June 2022.pdfSan Francisco Market Report June 2022.pdf
San Francisco Market Report June 2022.pdf
 

Recently uploaded

Call Girls in Pitampura Delhi 💯Call Us 🔝8264348440🔝
Call Girls in Pitampura Delhi 💯Call Us 🔝8264348440🔝Call Girls in Pitampura Delhi 💯Call Us 🔝8264348440🔝
Call Girls in Pitampura Delhi 💯Call Us 🔝8264348440🔝soniya singh
 
9990771857 Call Girls in Noida Sector 03 Noida (Call Girls) Delhi
9990771857 Call Girls in Noida Sector 03 Noida (Call Girls) Delhi9990771857 Call Girls in Noida Sector 03 Noida (Call Girls) Delhi
9990771857 Call Girls in Noida Sector 03 Noida (Call Girls) Delhidelhimodel235
 
SSPL The Strand Abodes Kharadi Pune Brochure.pdf
SSPL The Strand Abodes Kharadi Pune Brochure.pdfSSPL The Strand Abodes Kharadi Pune Brochure.pdf
SSPL The Strand Abodes Kharadi Pune Brochure.pdfabbu831446
 
Puravankara Mundhwa Pune E-Brochure.pdf
Puravankara Mundhwa Pune  E-Brochure.pdfPuravankara Mundhwa Pune  E-Brochure.pdf
Puravankara Mundhwa Pune E-Brochure.pdfManishSaxena95
 
Namrata 7 Plumeria Drive Pimpri Chinchwad Pune Brochure.pdf
Namrata 7 Plumeria Drive Pimpri Chinchwad Pune Brochure.pdfNamrata 7 Plumeria Drive Pimpri Chinchwad Pune Brochure.pdf
Namrata 7 Plumeria Drive Pimpri Chinchwad Pune Brochure.pdfPrachiRudram
 
Choose Noida's Leading Architect
Choose    Noida's    Leading   ArchitectChoose    Noida's    Leading   Architect
Choose Noida's Leading ArchitectMM Design Studio
 
Listing Turkey Sylvana Istanbul - Bahcesehir
Listing Turkey Sylvana Istanbul - BahcesehirListing Turkey Sylvana Istanbul - Bahcesehir
Listing Turkey Sylvana Istanbul - BahcesehirListing Turkey
 
Call Girls in Kashmiri Gate Delhi 💯Call Us 🔝8264348440🔝
Call Girls in Kashmiri Gate Delhi 💯Call Us 🔝8264348440🔝Call Girls in Kashmiri Gate Delhi 💯Call Us 🔝8264348440🔝
Call Girls in Kashmiri Gate Delhi 💯Call Us 🔝8264348440🔝soniya singh
 
Call Girls In Vasundhara Ghaziabad ❤️8860477959 Low Rate Escorts Service In 2...
Call Girls In Vasundhara Ghaziabad ❤️8860477959 Low Rate Escorts Service In 2...Call Girls In Vasundhara Ghaziabad ❤️8860477959 Low Rate Escorts Service In 2...
Call Girls In Vasundhara Ghaziabad ❤️8860477959 Low Rate Escorts Service In 2...lizamodels9
 
Call Girls In The Lalit New Delhi ❤️8860477959 Good Looking Escorts In 24/7 D...
Call Girls In The Lalit New Delhi ❤️8860477959 Good Looking Escorts In 24/7 D...Call Girls In The Lalit New Delhi ❤️8860477959 Good Looking Escorts In 24/7 D...
Call Girls In The Lalit New Delhi ❤️8860477959 Good Looking Escorts In 24/7 D...lizamodels9
 
9990771857 Call Girls in Noida Sector 11 Noida (Call Girls) Delhi
9990771857 Call Girls in Noida Sector 11 Noida (Call Girls) Delhi9990771857 Call Girls in Noida Sector 11 Noida (Call Girls) Delhi
9990771857 Call Girls in Noida Sector 11 Noida (Call Girls) Delhidelhimodel235
 
Low Rate Call Girls in Triveni Complex Delhi Call 9990771857
Low Rate Call Girls in Triveni Complex Delhi Call 9990771857Low Rate Call Girls in Triveni Complex Delhi Call 9990771857
Low Rate Call Girls in Triveni Complex Delhi Call 9990771857delhimodel235
 
9990771857 Call Girls in Noida Sector 1 Noida (Call Girls) Delhi
9990771857 Call Girls in Noida Sector 1 Noida (Call Girls) Delhi9990771857 Call Girls in Noida Sector 1 Noida (Call Girls) Delhi
9990771857 Call Girls in Noida Sector 1 Noida (Call Girls) Delhidelhimodel235
 
Building Dreams: Newman Leech's Visionary Approach to Real Estate Investment
Building Dreams: Newman Leech's Visionary Approach to Real Estate InvestmentBuilding Dreams: Newman Leech's Visionary Approach to Real Estate Investment
Building Dreams: Newman Leech's Visionary Approach to Real Estate InvestmentNewman George Leech
 
8 Key Elements for Comfortable Farmland Living
8 Key Elements for Comfortable Farmland Living 8 Key Elements for Comfortable Farmland Living
8 Key Elements for Comfortable Farmland Living Farmland Bazaar
 
Omaxe Dwarka In Delhi E Brochure Pdf
Omaxe Dwarka In Delhi E Brochure     PdfOmaxe Dwarka In Delhi E Brochure     Pdf
Omaxe Dwarka In Delhi E Brochure Pdfashiyadav24
 
What Is Biophilic Design .pdf
What Is Biophilic Design            .pdfWhat Is Biophilic Design            .pdf
What Is Biophilic Design .pdfyamunaNMH
 
Call Girls In Mundka Industrial Metro@꧂8447779280 ↬Enjoy ꧂Escort Service in ...
Call Girls In Mundka Industrial Metro@꧂8447779280 ↬Enjoy ꧂Escort Service in  ...Call Girls In Mundka Industrial Metro@꧂8447779280 ↬Enjoy ꧂Escort Service in  ...
Call Girls In Mundka Industrial Metro@꧂8447779280 ↬Enjoy ꧂Escort Service in ...asmaqueen5
 
Call Girls in Inderpuri Delhi 💯Call Us 🔝8264348440🔝
Call Girls in Inderpuri Delhi 💯Call Us 🔝8264348440🔝Call Girls in Inderpuri Delhi 💯Call Us 🔝8264348440🔝
Call Girls in Inderpuri Delhi 💯Call Us 🔝8264348440🔝soniya singh
 

Recently uploaded (20)

Call Girls in Pitampura Delhi 💯Call Us 🔝8264348440🔝
Call Girls in Pitampura Delhi 💯Call Us 🔝8264348440🔝Call Girls in Pitampura Delhi 💯Call Us 🔝8264348440🔝
Call Girls in Pitampura Delhi 💯Call Us 🔝8264348440🔝
 
9990771857 Call Girls in Noida Sector 03 Noida (Call Girls) Delhi
9990771857 Call Girls in Noida Sector 03 Noida (Call Girls) Delhi9990771857 Call Girls in Noida Sector 03 Noida (Call Girls) Delhi
9990771857 Call Girls in Noida Sector 03 Noida (Call Girls) Delhi
 
SSPL The Strand Abodes Kharadi Pune Brochure.pdf
SSPL The Strand Abodes Kharadi Pune Brochure.pdfSSPL The Strand Abodes Kharadi Pune Brochure.pdf
SSPL The Strand Abodes Kharadi Pune Brochure.pdf
 
Low Rate Call Girls in Triveni Complex Delhi Call 9873940964
Low Rate Call Girls in Triveni Complex Delhi Call 9873940964Low Rate Call Girls in Triveni Complex Delhi Call 9873940964
Low Rate Call Girls in Triveni Complex Delhi Call 9873940964
 
Puravankara Mundhwa Pune E-Brochure.pdf
Puravankara Mundhwa Pune  E-Brochure.pdfPuravankara Mundhwa Pune  E-Brochure.pdf
Puravankara Mundhwa Pune E-Brochure.pdf
 
Namrata 7 Plumeria Drive Pimpri Chinchwad Pune Brochure.pdf
Namrata 7 Plumeria Drive Pimpri Chinchwad Pune Brochure.pdfNamrata 7 Plumeria Drive Pimpri Chinchwad Pune Brochure.pdf
Namrata 7 Plumeria Drive Pimpri Chinchwad Pune Brochure.pdf
 
Choose Noida's Leading Architect
Choose    Noida's    Leading   ArchitectChoose    Noida's    Leading   Architect
Choose Noida's Leading Architect
 
Listing Turkey Sylvana Istanbul - Bahcesehir
Listing Turkey Sylvana Istanbul - BahcesehirListing Turkey Sylvana Istanbul - Bahcesehir
Listing Turkey Sylvana Istanbul - Bahcesehir
 
Call Girls in Kashmiri Gate Delhi 💯Call Us 🔝8264348440🔝
Call Girls in Kashmiri Gate Delhi 💯Call Us 🔝8264348440🔝Call Girls in Kashmiri Gate Delhi 💯Call Us 🔝8264348440🔝
Call Girls in Kashmiri Gate Delhi 💯Call Us 🔝8264348440🔝
 
Call Girls In Vasundhara Ghaziabad ❤️8860477959 Low Rate Escorts Service In 2...
Call Girls In Vasundhara Ghaziabad ❤️8860477959 Low Rate Escorts Service In 2...Call Girls In Vasundhara Ghaziabad ❤️8860477959 Low Rate Escorts Service In 2...
Call Girls In Vasundhara Ghaziabad ❤️8860477959 Low Rate Escorts Service In 2...
 
Call Girls In The Lalit New Delhi ❤️8860477959 Good Looking Escorts In 24/7 D...
Call Girls In The Lalit New Delhi ❤️8860477959 Good Looking Escorts In 24/7 D...Call Girls In The Lalit New Delhi ❤️8860477959 Good Looking Escorts In 24/7 D...
Call Girls In The Lalit New Delhi ❤️8860477959 Good Looking Escorts In 24/7 D...
 
9990771857 Call Girls in Noida Sector 11 Noida (Call Girls) Delhi
9990771857 Call Girls in Noida Sector 11 Noida (Call Girls) Delhi9990771857 Call Girls in Noida Sector 11 Noida (Call Girls) Delhi
9990771857 Call Girls in Noida Sector 11 Noida (Call Girls) Delhi
 
Low Rate Call Girls in Triveni Complex Delhi Call 9990771857
Low Rate Call Girls in Triveni Complex Delhi Call 9990771857Low Rate Call Girls in Triveni Complex Delhi Call 9990771857
Low Rate Call Girls in Triveni Complex Delhi Call 9990771857
 
9990771857 Call Girls in Noida Sector 1 Noida (Call Girls) Delhi
9990771857 Call Girls in Noida Sector 1 Noida (Call Girls) Delhi9990771857 Call Girls in Noida Sector 1 Noida (Call Girls) Delhi
9990771857 Call Girls in Noida Sector 1 Noida (Call Girls) Delhi
 
Building Dreams: Newman Leech's Visionary Approach to Real Estate Investment
Building Dreams: Newman Leech's Visionary Approach to Real Estate InvestmentBuilding Dreams: Newman Leech's Visionary Approach to Real Estate Investment
Building Dreams: Newman Leech's Visionary Approach to Real Estate Investment
 
8 Key Elements for Comfortable Farmland Living
8 Key Elements for Comfortable Farmland Living 8 Key Elements for Comfortable Farmland Living
8 Key Elements for Comfortable Farmland Living
 
Omaxe Dwarka In Delhi E Brochure Pdf
Omaxe Dwarka In Delhi E Brochure     PdfOmaxe Dwarka In Delhi E Brochure     Pdf
Omaxe Dwarka In Delhi E Brochure Pdf
 
What Is Biophilic Design .pdf
What Is Biophilic Design            .pdfWhat Is Biophilic Design            .pdf
What Is Biophilic Design .pdf
 
Call Girls In Mundka Industrial Metro@꧂8447779280 ↬Enjoy ꧂Escort Service in ...
Call Girls In Mundka Industrial Metro@꧂8447779280 ↬Enjoy ꧂Escort Service in  ...Call Girls In Mundka Industrial Metro@꧂8447779280 ↬Enjoy ꧂Escort Service in  ...
Call Girls In Mundka Industrial Metro@꧂8447779280 ↬Enjoy ꧂Escort Service in ...
 
Call Girls in Inderpuri Delhi 💯Call Us 🔝8264348440🔝
Call Girls in Inderpuri Delhi 💯Call Us 🔝8264348440🔝Call Girls in Inderpuri Delhi 💯Call Us 🔝8264348440🔝
Call Girls in Inderpuri Delhi 💯Call Us 🔝8264348440🔝
 

San Francisco Market Focus July 2017

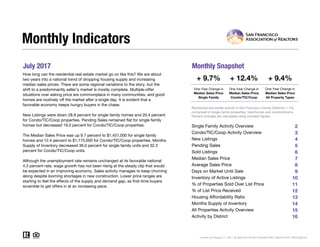
  • 1. July 2017 Monthly Snapshot One-Year Change in One-Year Change in Median Sales Price Single Family Median Sales Price Condo/TIC/Coop 2 3 4 5 6 7 8 9 10 11 12 13 14 15 16 Monthly Indicators + 9.7% + 12.4% + 9.4% One-Year Change in How long can the residential real estate market go on like this? We are about two years into a national trend of dropping housing supply and increasing median sales prices. There are some regional variations to the story, but the shift to a predominantly seller's market is mostly complete. Multiple-offer situations over asking price are commonplace in many communities, and good homes are routinely off the market after a single day. It is evident that a favorable economy keeps hungry buyers in the chase. New Listings were down 28.9 percent for single family homes and 20.4 percent for Condo/TIC/Coop properties. Pending Sales remained flat for single family homes but decreased 19.0 percent for Condo/TIC/Coop properties. The Median Sales Price was up 9.7 percent to $1,431,000 for single family homes and 12.4 percent to $1,175,000 for Condo/TIC/Coop properties. Months Supply of Inventory decreased 36.0 percent for single family units and 32.3 percent for Condo/TIC/Coop units. Although the unemployment rate remains unchanged at its favorable national 4.3 percent rate, wage growth has not been rising at the steady clip that would be expected in an improving economy. Sales activity manages to keep churning along despite looming shortages in new construction. Lower price ranges are starting to feel the effects of the supply and demand gap, as first-time buyers scramble to get offers in at an increasing pace. Median Sales Price All Property Types Residential real estate activity in San Francisco County (Districts 1-10), comprised of single-family properties, townhomes and condominiums. Percent changes are calculated using rounded figures. Single Family Activity Overview Months Supply of Inventory Current as of August 11, 2017. All data from the San Francisco MLS. Report © 2017 ShowingTime. Condo/TIC/Coop Activity Overview Inventory of Active Listings % of Properties Sold Over List Price % of List Price Received Housing Affordability Ratio All Properties Activity Overview New Listings Pending Sales Sold Listings Median Sales Price Average Sales Price Days on Market Until Sale Activity by District
  • 2. Single Family Activity Overview Key metrics by report month and for year-to-date (YTD) starting from the first of the year. Key Metrics Historical Sparkbars 7-2016 7-2017 Percent Change YTD 2016 YTD 2017 Percent Change Current as of August 11, 2017. All data from the San Francisco MLS. Report © 2017 ShowingTime. | 2 Months Supply 2.5 1.6 - 36.0% -- -- -- Affordability Ratio 41 36 - 12.2% % of List Price Received 111.8% 117.2% + 4.8% 112.7% 40 77.3% + 0.9% + 1.9% 37 - 7.5% 114.8% % of Properties Sold Over List Price 76.2% 81.3% + 6.7% 76.6% Active Listings 463 298 - 35.6% -- Avg. Sales Price $1,721,337 $1,777,879 + 3.3% $1,706,946 Days on Market 32 24 - 25.0% 30 28 - 6.7% $1,795,477 -- -- Median Sales Price $1,305,000 $1,431,000 + 9.7% $1,339,000 Sold Listings 202 203 + 0.5% 1,220 New Listings 232 165 - 28.9% 1,692 Pending Sales 169 169 0.0% + 1.6%1,279 1,300 - 9.5%1,532 1,238 + 1.5% $1,401,000 + 4.6% + 5.2% 7-2014 7-2015 7-2016 7-2017 7-2014 7-2015 7-2016 7-2017 7-2014 7-2015 7-2016 7-2017 7-2014 7-2015 7-2016 7-2017 7-2014 7-2015 7-2016 7-2017 7-2014 7-2015 7-2016 7-2017 7-2014 7-2015 7-2016 7-2017 7-2014 7-2015 7-2016 7-2017 7-2014 7-2015 7-2016 7-2017 7-2014 7-2015 7-2016 7-2017 7-2014 7-2015 7-2016 7-2017
  • 3. Condo/TIC/Coop Activity Overview Key metrics by report month and for year-to-date (YTD) starting from the first of the year. Key Metrics Historical Sparkbars 7-2016 7-2017 Percent Change YTD 2016 YTD 2017 Percent Change Current as of August 11, 2017. All data from the San Francisco MLS. Report © 2017 ShowingTime. | 3 Months Supply 3.1 2.1 - 32.3% -- -- -- Affordability Ratio 59 51 - 13.6% % of List Price Received 104.8% 106.3% + 1.4% 105.4% 57 59.3% - 4.2% - 0.4% 53 - 7.0% 105.0% % of Properties Sold Over List Price 58.6% 64.2% + 9.6% 61.9% Active Listings 721 491 - 31.9% -- Avg. Sales Price $1,206,077 $1,267,396 + 5.1% $1,246,400 Days on Market 39 33 - 15.4% 36 $1,136,250 + 3.3% + 4.7% 36 0.0% $1,304,792 -- -- Sold Listings 249 226 - 9.2% 1,565 1,638 + 4.7% Median Sales Price $1,045,000 $1,175,000 + 12.4% $1,100,000 - 12.6% Pending Sales 258 209 - 19.0% 1,646 1,680 + 2.1% New Listings 279 222 - 20.4% 2,442 2,135 7-2014 7-2015 7-2016 7-2017 7-2014 7-2015 7-2016 7-2017 7-2014 7-2015 7-2016 7-2017 7-2014 7-2015 7-2016 7-2017 7-2014 7-2015 7-2016 7-2017 7-2014 7-2015 7-2016 7-2017 7-2014 7-2015 7-2016 7-2017 7-2014 7-2015 7-2016 7-2017 7-2014 7-2015 7-2016 7-2017 7-2014 7-2015 7-2016 7-2017 7-2014 7-2015 7-2016 7-2017
  • 4. New Listings New Listings Single Family Year-Over-Year Change Condo/TIC/ Coop Year-Over-Year Change Aug-2016 202 -13.7% 285 -0.7% Sep-2016 346 +6.5% 435 -0.7% Oct-2016 222 -15.6% 300 -6.8% Nov-2016 138 -3.5% 160 -17.9% Dec-2016 70 +4.5% 118 -2.5% Jan-2017 176 -3.8% 326 +10.9% Feb-2017 186 -18.1% 328 -3.0% Mar-2017 273 0.0% 344 -8.8% Apr-2017 239 -15.5% 281 -24.5% May-2017 277 +8.2% 345 -7.8% Jun-2017 216 -9.2% 289 -29.2% Jul-2017 165 -28.9% 222 -20.4% 12-Month Avg 209 -7.9% 286 -9.8% Historical New Listings by Month Current as of August 11, 2017. All data from the San Francisco MLS. Report © 2017 ShowingTime. | 4 A count of the properties that have been newly listed on the market in a given month. 256 294 232 279 165 222 Single Family Condo/TIC/Coop July 0 100 200 300 400 500 600 700 1-2005 1-2006 1-2007 1-2008 1-2009 1-2010 1-2011 1-2012 1-2013 1-2014 1-2015 1-2016 1-2017 Single Family Condo/TIC/Coop 1,708 2,190 1,692 2,442 1,532 2,135 Single Family Condo/TIC/Coop Year to Date 2015 2016 2017 - 20.4%- 5.1%- 28.9%- 9.4% + 11.5%- 9.5%- 0.9% - 12.6% 2015 2016 2017 2015 2016 2017 2015 2016 2017 - 3.8% + 0.9% - 7.9%- 17.4%
  • 5. Pending Sales Pending Sales Single Family Year-Over-Year Change Condo/TIC/ Coop Year-Over-Year Change Aug-2016 198 -3.4% 236 +2.2% Sep-2016 186 -6.5% 216 0.0% Oct-2016 222 -16.5% 249 -12.0% Nov-2016 209 +19.4% 266 +11.3% Dec-2016 123 -6.1% 178 +1.7% Jan-2017 94 -5.1% 144 +0.7% Feb-2017 136 +9.7% 208 -8.8% Mar-2017 213 +9.2% 303 +34.1% Apr-2017 198 -7.5% 226 -7.4% May-2017 240 -3.6% 305 +7.0% Jun-2017 250 +9.2% 285 +8.8% Jul-2017 169 0.0% 209 -19.0% 12-Month Avg 187 -0.8% 235 +1.3% Historical Pending Sales by Month A count of the properties on which offers have been accepted in a given month. Current as of August 11, 2017. All data from the San Francisco MLS. Report © 2017 ShowingTime. | 5 209 251 169 258 169 209 Single Family Condo/TIC/Coop July 0 100 200 300 400 1-2005 1-2006 1-2007 1-2008 1-2009 1-2010 1-2011 1-2012 1-2013 1-2014 1-2015 1-2016 1-2017 Single Family Condo/TIC/Coop 1,343 1,769 1,279 1,646 1,300 1,680 Single Family Condo/TIC/Coop Year to Date 2015 2016 2017 - 19.0%+ 2.8%0.0%- 19.1% - 7.0%+ 1.6%- 4.8% + 2.1% 2015 2016 2017 2015 2016 2017 2015 2016 2017 - 7.9% - 1.4% - 6.8%- 8.4%
  • 6. Sold Listings Sold Listings Single Family Year-Over-Year Change Condo/TIC/ Coop Year-Over-Year Change Aug-2016 191 -3.5% 259 +13.1% Sep-2016 178 +8.5% 234 +29.3% Oct-2016 227 -7.0% 236 -11.3% Nov-2016 206 +9.6% 263 +27.1% Dec-2016 200 -3.8% 238 -15.9% Jan-2017 106 +1.9% 150 +0.7% Feb-2017 111 +8.8% 156 -7.1% Mar-2017 173 +9.5% 286 +13.9% Apr-2017 203 -2.9% 232 +4.5% May-2017 214 +7.0% 268 +3.9% Jun-2017 228 -6.9% 320 +19.4% Jul-2017 203 +0.5% 226 -9.2% 12-Month Avg 187 +0.8% 239 +5.0% Historical Sold Listings by Month A count of the actual sales that closed in a given month. Current as of August 11, 2017. All data from the San Francisco MLS. Report © 2017 ShowingTime. | 6 236 272 202 249 203 226 Single Family Condo/TIC/Coop July 0 100 200 300 400 1-2005 1-2006 1-2007 1-2008 1-2009 1-2010 1-2011 1-2012 1-2013 1-2014 1-2015 1-2016 1-2017 Single Family Condo/TIC/Coop 1,307 1,720 1,220 1,565 1,238 1,638 Single Family Condo/TIC/Coop Year to Date 2015 2016 2017 - 9.2%- 8.5%+ 0.5%- 14.4% - 9.0%+ 1.5%- 6.7% + 4.7% 2015 2016 2017 2015 2016 2017 2015 2016 2017 + 3.5% - 1.2% - 7.1%- 1.8%
  • 7. Median Sales Price Median Sales Price Single Family Year-Over-Year Change Condo/TIC/ Coop Year-Over-Year Change Aug-2016 $1,250,000 +2.0% $1,060,000 +1.4% Sep-2016 $1,216,875 +5.4% $1,022,500 -1.7% Oct-2016 $1,400,000 +10.5% $1,137,500 +3.4% Nov-2016 $1,353,000 +7.2% $1,058,000 -6.0% Dec-2016 $1,301,511 +8.3% $1,011,000 -7.9% Jan-2017 $1,250,000 +7.1% $1,000,000 -5.7% Feb-2017 $1,290,000 -7.2% $1,192,500 +8.7% Mar-2017 $1,350,000 -0.2% $1,137,500 +3.9% Apr-2017 $1,380,000 0.0% $1,100,000 -4.3% May-2017 $1,500,838 +11.2% $1,176,500 +8.7% Jun-2017 $1,462,989 +10.4% $1,125,000 -4.3% Jul-2017 $1,431,000 +9.7% $1,175,000 +12.4% 12-Month Avg* $1,350,000 +4.0% $1,100,000 0.0% Historical Median Sales Price by Month Point at which half of the sales sold for more and half sold for less, not accounting for seller concessions, in a given month. * Median Sales Price for all properties from August 2016 through July 2017. This is not the average of the individual figures above. Current as of August 11, 2017. All data from the San Francisco MLS. Report © 2017 ShowingTime. | 7 $1,280,000 $1,033,509 $1,305,000 $1,045,000 $1,431,000 $1,175,000 Single Family Condo/TIC/Coop July $400,000 $600,000 $800,000 $1,000,000 $1,200,000 $1,400,000 $1,600,000 1-2005 1-2006 1-2007 1-2008 1-2009 1-2010 1-2011 1-2012 1-2013 1-2014 1-2015 1-2016 1-2017 Single Family Condo/TIC/Coop $1,250,000 $1,079,500 $1,339,000 $1,100,000 $1,401,000 $1,136,250 Single Family Condo/TIC/Coop Year to Date 2015 2016 2017 + 12.4%+ 1.1%+ 9.7%+ 2.0% + 1.9%+ 4.6%+ 7.1% + 3.3% 2015 2016 2017 2015 2016 2017 2015 2016 2017 + 18.4% + 19.0% + 14.8%+ 8.8%
  • 8. Average Sales Price Avg. Sales Price Single Family Year-Over-Year Change Condo/TIC/ Coop Year-Over-Year Change Aug-2016 $1,537,059 +2.1% $1,228,996 +6.0% Sep-2016 $1,487,123 +6.9% $1,208,673 +3.6% Oct-2016 $2,000,319 +23.1% $1,263,882 +6.7% Nov-2016 $1,767,029 +3.9% $1,140,559 -9.4% Dec-2016 $1,658,512 +10.8% $1,249,670 -0.0% Jan-2017 $1,633,150 +4.0% $1,161,831 -0.6% Feb-2017 $1,684,181 +4.5% $1,367,391 +13.1% Mar-2017 $1,891,127 +6.0% $1,283,105 +2.2% Apr-2017 $1,880,160 +6.3% $1,296,502 -5.2% May-2017 $1,856,243 +13.7% $1,349,675 +6.3% Jun-2017 $1,735,790 -0.9% $1,355,502 +11.3% Jul-2017 $1,777,879 +3.3% $1,267,396 +5.1% 12-Month Avg* $1,754,853 +7.2% $1,267,104 +3.1% Historical Average Sales Price by Month Average sales price for all closed sales, not accounting for seller concessions, in a given month. * Avg. Sales Price for all properties from August 2016 through July 2017. This is not the average of the individual figures above. Current as of August 11, 2017. All data from the San Francisco MLS. Report © 2017 ShowingTime. | 8 $1,657,986 $1,214,445 $1,721,337 $1,206,077 $1,777,879 $1,267,396 Single Family Condo/TIC/Coop July $500,000 $750,000 $1,000,000 $1,250,000 $1,500,000 $1,750,000 $2,000,000 $2,250,000 1-2005 1-2006 1-2007 1-2008 1-2009 1-2010 1-2011 1-2012 1-2013 1-2014 1-2015 1-2016 1-2017 Single Family Condo/TIC/Coop $1,694,255 $1,266,372 $1,706,946 $1,246,400 $1,795,477 $1,304,792 Single Family Condo/TIC/Coop Year to Date 2015 2016 2017 + 5.1%- 0.7%+ 3.3%+ 3.8% - 1.6%+ 5.2%+ 0.7% + 4.7% 2015 2016 2017 2015 2016 2017 2015 2016 2017 + 17.9% + 17.0% + 14.8%+ 11.0%
  • 9. Days on Market Until Sale Days on Market Single Family Year-Over-Year Change Condo/TIC/ Coop Year-Over-Year Change Aug-2016 33 +17.9% 46 +58.6% Sep-2016 41 +51.9% 40 +17.6% Oct-2016 27 0.0% 34 +30.8% Nov-2016 38 +35.7% 40 +17.6% Dec-2016 41 +24.2% 48 +11.6% Jan-2017 42 +5.0% 59 +34.1% Feb-2017 34 +9.7% 36 +2.9% Mar-2017 31 +24.0% 32 +6.7% Apr-2017 26 -18.8% 32 -15.8% May-2017 23 -11.5% 33 0.0% Jun-2017 27 -6.9% 37 +5.7% Jul-2017 24 -25.0% 33 -15.4% 12-Month Avg* 31 +7.1% 38 +10.6% Historical Days on Market Until Sale by Month Average number of days between when a property is listed and when an offer is accepted in a given month. * Days on Market for all properties from August 2016 through July 2017. This is not the average of the individual figures above. Current as of August 11, 2017. All data from the San Francisco MLS. Report © 2017 ShowingTime. | 9 25 29 32 39 24 33 Single Family Condo/TIC/Coop July 20 40 60 80 100 120 1-2005 1-2006 1-2007 1-2008 1-2009 1-2010 1-2011 1-2012 1-2013 1-2014 1-2015 1-2016 1-2017 Single Family Condo/TIC/Coop 26 3030 36 28 36 Single Family Condo/TIC/Coop Year to Date 2015 2016 2017 - 15.4%+ 34.5%- 25.0%+ 28.0% + 20.0%- 6.7%+ 15.4% 0.0% 2015 2016 2017 2015 2016 2017 2015 2016 2017 - 16.7% - 16.1% - 11.8%- 12.1%
  • 10. Inventory of Active Listings Active Listings Single Family Year-Over-Year Change Condo/TIC/ Coop Year-Over-Year Change Aug-2016 416 +6.9% 683 +39.7% Sep-2016 530 +10.6% 825 +22.4% Oct-2016 489 +10.9% 800 +22.1% Nov-2016 383 +5.5% 590 +9.3% Dec-2016 260 +13.0% 403 +8.0% Jan-2017 321 +7.0% 550 +11.3% Feb-2017 355 -8.3% 624 +12.6% Mar-2017 385 -14.1% 623 -4.7% Apr-2017 403 -17.1% 631 -12.7% May-2017 406 -13.1% 628 -15.7% Jun-2017 337 -23.8% 558 -30.4% Jul-2017 298 -35.6% 491 -31.9% 12-Month Avg* 382 -6.4% 617 -0.2% Historical Inventory of Active Listings by Month The number of properties available for sale in active status at the end of a given month. * Active Listings for all properties from August 2016 through July 2017. This is not the average of the individual figures above. Current as of August 11, 2017. All data from the San Francisco MLS. Report © 2017 ShowingTime. | 10 405 484463 721 298 491 Single Family Condo/TIC/Coop July 200 400 600 800 1,000 1,200 1,400 1,600 1-2005 1-2006 1-2007 1-2008 1-2009 1-2010 1-2011 1-2012 1-2013 1-2014 1-2015 1-2016 1-2017 Single Family Condo/TIC/Coop 2015 2016 2017 - 31.9%+ 49.0%- 35.6%+ 14.3% 2015 2016 2017 - 4.7% - 17.7%
  • 11. % of Properties Sold Over List Price % of Properties Sold Over List Price Single Family Year-Over-Year Change Condo/TIC/ Coop Year-Over-Year Change Aug-2016 75.9% -15.1% 48.6% -32.6% Sep-2016 77.5% -12.3% 58.1% -19.1% Oct-2016 78.9% -5.2% 53.8% -29.5% Nov-2016 72.8% -6.3% 63.1% -9.3% Dec-2016 69.0% -13.0% 42.0% -29.3% Jan-2017 62.3% -18.0% 38.7% -27.0% Feb-2017 78.4% +1.2% 58.3% 0.0% Mar-2017 74.6% -9.4% 62.2% -8.1% Apr-2017 77.3% +2.2% 62.1% +2.8% May-2017 79.4% -0.1% 61.9% -8.2% Jun-2017 80.3% +11.8% 59.1% -5.1% Jul-2017 81.3% +6.7% 64.2% +9.6% 12-Month Avg 76.2% -4.4% 56.7% -12.9% Historical % of Properties Sold Over List Price by Month Percentage found when dividing the number of properties sold by properties sold over its original list price, not accounting for seller concessions. * % of Properties Sold Over List Price for all properties from August 2016 through July 2017. This is not the average of the individual figures above. Current as of August 11, 2017. All data from the San Francisco MLS. Report © 2017 ShowingTime. | 11 84.3% 73.9%76.2% 58.6% 81.3% 64.2% Single Family Condo/TIC/Coop July 0.0% 20.0% 40.0% 60.0% 80.0% 100.0% 1-2005 1-2006 1-2007 1-2008 1-2009 1-2010 1-2011 1-2012 1-2013 1-2014 1-2015 1-2016 1-2017 Single Family Condo/TIC/Coop 81.4% 71.0% 76.6% 61.9% 77.3% 59.3% Single Family Condo/TIC/Coop Year to Date 2015 2016 2017 + 9.6%- 20.7%+ 6.7%- 9.6% - 12.8%+ 0.9%- 5.9% - 4.2% 2015 2016 2017 2015 2016 2017 2015 2016 2017 - 2.0% + 0.7% + 3.3%+ 3.4%
  • 12. % of List Price Received % of List Price Received Single Family Year-Over-Year Change Condo/TIC/ Coop Year-Over-Year Change Aug-2016 111.5% -4.9% 102.9% -5.3% Sep-2016 110.8% -5.9% 104.2% -4.1% Oct-2016 111.2% -2.9% 104.2% -4.7% Nov-2016 109.1% -2.9% 104.6% -2.7% Dec-2016 108.4% -3.5% 101.5% -2.7% Jan-2017 107.6% -3.1% 101.4% -2.3% Feb-2017 113.8% +1.1% 104.1% -1.7% Mar-2017 112.4% -2.0% 105.0% -1.2% Apr-2017 115.4% +1.9% 105.1% -0.1% May-2017 115.5% +0.3% 105.5% -0.6% Jun-2017 117.0% +6.1% 105.8% +0.5% Jul-2017 117.2% +4.8% 106.3% +1.4% 12-Month Avg* 112.7% -0.8% 104.4% -1.9% Historical % of List Price Received by Month Percentage found when dividing a property’s sales price by its most recent list price, then taking the average for all properties sold in a given month, not accounting for seller concessions. * % of List Price Received for all properties from August 2016 through July 2017. This is not the average of the individual figures above. Current as of August 11, 2017. All data from the San Francisco MLS. Report © 2017 ShowingTime. | 12 117.8% 109.2%111.8% 104.8% 117.2% 106.3% Single Family Condo/TIC/Coop July 115.8% 109.4%112.7% 105.4% 114.8% 105.0% Single Family Condo/TIC/Coop Year to Date 95.0% 100.0% 105.0% 110.0% 115.0% 120.0% 1-2005 1-2006 1-2007 1-2008 1-2009 1-2010 1-2011 1-2012 1-2013 1-2014 1-2015 1-2016 1-2017 Single Family Condo/TIC/Coop 2015 2016 2017 + 1.4%- 4.0%+ 4.8%- 5.1% 2015 2016 2017 + 3.2% + 1.0% 2015 2016 2017 - 0.4%- 3.7%+ 1.9%- 2.7% 2015 2016 2017 + 2.4% + 1.7%
  • 13. Housing Affordability Ratio Affordability Ratio Single Family Year-Over-Year Change Condo/TIC/ Coop Year-Over-Year Change Aug-2016 43 +10.3% 59 +11.3% Sep-2016 44 +4.8% 61 +13.0% Oct-2016 39 +2.6% 56 +9.8% Nov-2016 38 0.0% 56 +12.0% Dec-2016 38 -5.0% 56 +9.8% Jan-2017 39 -11.4% 56 0.0% Feb-2017 39 +2.6% 49 -12.5% Mar-2017 37 -5.1% 51 -8.9% Apr-2017 37 -2.6% 54 +1.9% May-2017 34 -12.8% 51 -8.9% Jun-2017 35 -12.5% 53 0.0% Jul-2017 36 -12.2% 51 -13.6% 12-Month Avg* 38 -9.4% 40 -5.9% Historical Housing Affordability Ratio by Month This index measures housing affordability for the region. For example, an index of 120 means the median household income is 120% of what is necessary to qualify for the median-priced home under prevailing interest rates. A higher number means greater affordability. * Affordability Ratio for all properties from August 2016 through July 2017. This is not the average of the individual figures above. Current as of August 11, 2017. All data from the San Francisco MLS. Report © 2017 ShowingTime. | 13 37 54 41 59 36 51 Single Family Condo/TIC/Coop July 30 40 50 60 70 80 90 100 1-2005 1-2006 1-2007 1-2008 1-2009 1-2010 1-2011 1-2012 1-2013 1-2014 1-2015 1-2016 1-2017 Single Family Condo/TIC/Coop 2015 2016 2017 - 13.6%+ 9.3%- 12.2%+ 10.8% 2015 2016 2017 - 11.9% - 1.8% 38 51 40 57 37 53 Single Family Condo/TIC/Coop Year to Date 2015 2016 2017 - 7.0%+ 11.8%- 7.5%+ 5.3% 2015 2016 2017 - 11.6% - 7.3%
  • 14. Months Supply of Inventory Months Supply Single Family Year-Over-Year Change Condo/TIC/ Coop Year-Over-Year Change Aug-2016 2.2 +10.0% 2.9 +45.0% Sep-2016 2.8 +16.7% 3.5 +29.6% Oct-2016 2.7 +22.7% 3.5 +29.6% Nov-2016 2.1 +10.5% 2.5 +13.6% Dec-2016 1.4 +16.7% 1.7 +13.3% Jan-2017 1.7 +6.3% 2.4 +20.0% Feb-2017 1.9 -5.0% 2.7 +17.4% Mar-2017 2.1 -12.5% 2.6 -3.7% Apr-2017 2.2 -15.4% 2.7 -12.9% May-2017 2.2 -12.0% 2.6 -18.8% Jun-2017 1.8 -21.7% 2.3 -34.3% Jul-2017 1.6 -36.0% 2.1 -32.3% 12-Month Avg* 2.1 -3.1% 2.6 +2.1% Historical Months Supply of Inventory by Month The inventory of homes for sale at the end of a given month, divided by the average monthly pending sales from the last 12 months. * Months Supply for all properties from August 2016 through July 2017. This is not the average of the individual figures above. Current as of August 11, 2017. All data from the San Francisco MLS. Report © 2017 ShowingTime. | 14 2.0 1.9 2.5 3.1 1.6 2.1 Single Family Condo/TIC/Coop July 0.0 2.0 4.0 6.0 8.0 10.0 1-2005 1-2006 1-2007 1-2008 1-2009 1-2010 1-2011 1-2012 1-2013 1-2014 1-2015 1-2016 1-2017 Single Family Condo/TIC/Coop 2015 2016 2017 - 32.3%+ 63.2%- 36.0%+ 25.0% 2015 2016 2017 - 4.8% - 13.6%
  • 15. All Properties Activity Overview Key metrics by report month and for year-to-date (YTD) starting from the first of the year. Key Metrics Historical Sparkbars 7-2016 7-2017 Percent Change YTD 2016 YTD 2017 Percent Change Current as of August 11, 2017. All data from the San Francisco MLS. Report © 2017 ShowingTime. | 15 Months Supply 2.8 1.9 - 32.1% -- -- -- Affordability Ratio 44 40 - 9.1% % of List Price Received 108.0% 111.4% + 3.1% 108.6% 43 67.0% - 1.9% + 0.6% 40 - 7.0% 109.2% % of Properties Sold Over List Price 66.5% 72.3% + 8.7% 68.3% Active Listings 1,184 789 - 33.4% -- Avg. Sales Price $1,436,859 $1,508,953 + 5.0% $1,448,148 Days on Market 36 29 - 19.4% 33 $1,250,000 + 4.2% + 4.7% 33 0.0% $1,516,012 -- -- Sold Listings 451 429 - 4.9% 2,785 2,876 + 3.3% Median Sales Price $1,152,000 $1,260,000 + 9.4% $1,200,000 - 11.3% Pending Sales 427 378 - 11.5% 2,925 2,980 + 1.9% New Listings 511 387 - 24.3% 4,134 3,667 7-2014 7-2015 7-2016 7-2017 7-2014 7-2015 7-2016 7-2017 7-2014 7-2015 7-2016 7-2017 7-2014 7-2015 7-2016 7-2017 7-2014 7-2015 7-2016 7-2017 7-2014 7-2015 7-2016 7-2017 7-2014 7-2015 7-2016 7-2017 7-2014 7-2015 7-2016 7-2017 7-2014 7-2015 7-2016 7-2017 7-2014 7-2015 7-2016 7-2017 7-2014 7-2015 7-2016 7-2017
  • 16. Activity by District SF District 1: Northwest (Sea Cliff, Lake, Jordan Park / Laurel Heights, Outer Richmond, Central Richmond, Inner Richmond, Lone Mountain) SF District 2: Central West (Outer Sunset, Central Sunset, Inner Sunset, Outer Parkside, Parkside, Inner Parkside, Golden Gate Heights) SF District 3: Southwest (Pine Lake Park, Lake Shore, Merced Manor, Stonestown, Lakeside, Merced Heights, Ingleside, Ingleside Heights, Oceanview) SF District 4: Twin Peaks W (Forest Hill (& Ext), W Portal, St Francis Wd, Balboa Terr, Mt Dav Manor, Ingleside Terr, Monterey Hts, Wstwd Pk & H'lnds, Shrwd Fst, Miraloma Pk, Dmnd Hts, Mdtwn Terr) SF District 5: Central (Haight Ashbury, Cole Vly / Prnssus Hts, Clarndn Hts, Corona Hts, Twin Pks, Glen Pk, Noe Vly, Eureka Vly / Dolores Hts, Mission Dolores, Duboce Trngl, Buena Vista / Ashbury Hts) SF District 6: Central North (Lower Pacific Heights, Anza Vista, Western Addition, North Panhandle, Alamo Square, Hayes Valley) SF District 7: North (Marina, Cow Hollow, Presidio Heights, Pacific Heights) SF District 8: Northeast (North Waterfront, North Beach, Russian Hill, Telegraph Hill, Nob Hill, Financial District / Barbary Coast, Downtown, Van Ness / Civic Center, Tenderloin) SF District 9: Central East (Yerba Buena, South Beach, South of Market, Mission Bay, Inner Mission, Potrero Hill, Central Waterfront / Dogpatch, Bernal Heights) SF District 10: Southeast (Outer Mission, Mission Terr, Excelsior, Portola, Bayview, Silver Terr, Hunters Pt, Candlestick Pt, Bayview Hts, Little Hollywood, Visitation Vly, Crocker Amazon) 7-2016 7-2017 + / – 7-2016 7-2017 + / – 7-2016 7-2017 + / – 7-2016 7-2017 + / – 7-2016 7-2017 + / – Single Family 1 SF District 1 35 11 -68.6% 12 16 +33.3% $2,275,000 $1,950,000 -14.3% 26 27 +3.8% 2.5 0.7 -72.0% 2 SF District 2 51 42 -17.6% 37 44 +18.9% $1,280,000 $1,330,000 +3.9% 26 19 -26.9% 1.5 1.3 -13.3% 3 SF District 3 33 21 -36.4% 16 16 0.0% $1,172,500 $1,125,000 -4.1% 27 27 0.0% 2.0 1.6 -20.0% 4 SF District 4 66 27 -59.1% 32 23 -28.1% $1,405,000 $1,505,000 +7.1% 35 22 -37.1% 2.5 1.1 -56.0% 5 SF District 5 61 37 -39.3% 27 23 -14.8% $1,950,000 $2,275,000 +16.7% 34 21 -38.2% 2.5 1.4 -44.0% 6 SF District 6 10 5 -50.0% 2 3 +50.0% $1,962,000 $2,400,000 +22.3% 61 23 -62.3% 3.7 1.5 -59.5% 7 SF District 7 34 25 -26.5% 12 16 +33.3% $4,119,500 $3,546,875 -13.9% 73 40 -45.2% 4.3 3.0 -30.2% 8 SF District 8 13 9 -30.8% 0 1 -- $0 $1,955,000 -- 0 41 -- 5.8 3.6 -37.9% 9 SF District 9 53 45 -15.1% 22 27 +22.7% $1,395,000 $1,500,000 +7.5% 20 23 +15.0% 2.4 2.1 -12.5% 10 SF District 10 107 76 -29.0% 42 34 -19.0% $795,000 $969,000 +21.9% 33 27 -18.2% 2.8 2.0 -28.6% Condo/TIC/Coop 1 SF District 1 40 13 -67.5% 14 11 -21.4% $1,032,500 $1,080,000 +4.6% 27 19 -29.6% 3.3 1.3 -60.6% 2 SF District 2 16 5 -68.8% 5 3 -40.0% $990,000 $850,000 -14.1% 33 49 +48.5% 3.7 1.4 -62.2% 3 SF District 3 9 4 -55.6% 4 3 -25.0% $730,000 $680,000 -6.8% 29 37 +27.6% 2.0 1.2 -40.0% 4 SF District 4 7 8 +14.3% 2 1 -50.0% $662,500 $465,000 -29.8% 55 48 -12.7% 2.3 2.8 +21.7% 5 SF District 5 85 40 -52.9% 44 30 -31.8% $1,150,000 $1,382,500 +20.2% 29 21 -27.6% 2.5 1.1 -56.0% 6 SF District 6 98 46 -53.1% 38 20 -47.4% $1,027,500 $1,210,000 +17.8% 41 29 -29.3% 3.8 1.7 -55.3% 7 SF District 7 63 40 -36.5% 24 19 -20.8% $1,175,000 $1,600,000 +36.2% 40 22 -45.0% 3.0 1.4 -53.3% 8 SF District 8 102 102 0.0% 35 42 +20.0% $1,100,000 $1,113,575 +1.2% 35 37 +5.7% 2.6 2.6 0.0% 9 SF District 9 274 209 -23.7% 79 92 +16.5% $950,000 $1,065,000 +12.1% 47 39 -17.0% 3.3 2.6 -21.2% 10 SF District 10 27 24 -11.1% 4 5 +25.0% $625,000 $650,000 +4.0% 19 30 +57.9% 4.8 3.5 -27.1% Key metrics by report month for the districts of San Fransisco. Current as of August 11, 2017. All data from the San Francisco MLS. Report © 2017 ShowingTime. | 16 Active Listings Sold Listings Median Sales Price Days on Market Months Supply