SlideShare a Scribd company logo
1 of 16
Download to read offline
March 2015 Monthly Snapshot
One-Year Change in One-Year Change in
Median Sales Price
Single Family
Median Sales Price
Condo/TIC/Coop
2
3
4
5
6
7
8
9
10
11
12
13
14
15
16
Current as of April 11, 2015. All data from the San Francisco MLS. Powered by 10K Research and Marketing.
Condo/TIC/Coop Activity Overview
Inventory of Active Listings
% of Properties Sold Over List Price
% of List Price Received
Housing Affordability Ratio
All Properties Activity Overview
New Listings
Pending Sales
Sold Listings
Median Sales Price
Average Sales Price
Days on Market Until Sale
Activity by District
Monthly Indicators
+ 27.6% + 14.0% + 17.1%
One-Year Change in
All expectations in 2015 are for a healthy and energetic selling season. National
stories have been highlighting an increase in new construction sales and
pending sales, but national stories are not always readily applied to the local
scene. All the same, if ever there was a year to list or purchase a home, wider
economic factors seem to indicate that this is the one.
New Listings were down 13.6 percent for single family homes and 8.9 percent
for Condo/TIC/Coop properties. Pending Sales increased 6.0 percent for single
family homes but decreased 0.7 percent for Condo/TIC/Coop properties.
The Median Sales Price was up 27.6 percent to $1,250,000 for single family
homes and 14.0 percent to $1,100,000 for Condo/TIC/Coop properties. Months
Supply of Inventory decreased 13.3 percent for single family units and 17.6
percent for Condo/TIC/Coop units.
On average, more people are employed and making more money than they
were at this time last year. The jobs picture, as a whole, looks promising.
Employment drives home-buying activity, so it is ever critical to watch labor
statistics as a key indicator for the residential real estate market. Coupled with
the mostly positive jobs picture, it is widely expected that mortgage rates will
remain as they are for at least the first six months of the year.
Median Sales Price
All Property Types
Residential real estate activity in San Francisco County (Districts 1-10),
comprised of single-family properties, townhomes and condominiums.
Percent changes are calculated using rounded figures.
Single Family Activity Overview
Months Supply of Inventory
Single Family Activity Overview
Key metrics by report month and for year-to-date (YTD) starting from the first of the year.
Key Metrics Historical Sparkbars 3-2014 3-2015 Percent Change YTD 2014 YTD 2015 Percent Change
- 2.7%616
420 - 9.9%
$1,115,000 + 14.8%
+ 14.7%
Pending Sales 217 230 + 6.0% - 7.0%514 478
New Listings 236 204 - 13.6% 633
Sold Listings 176 185 + 5.1% 466
Median Sales Price $980,000 $1,250,000 + 27.6% $971,500
30 - 16.7%
$1,574,644
-- --
Days on Market 31 24 - 22.6% 36
Avg. Sales Price $1,394,913 $1,763,281 + 26.4% $1,373,127
Active Listings 324 260 - 19.8% --
% of Properties Sold Over List Price 77.8% 77.3% - 0.6% 73.6%
46
75.5% + 2.6%
+ 2.3%
44 - 4.3%
112.6%% of List Price Received 111.9% 113.8% + 1.7% 110.1%
Current as of April 11, 2015. All data from the San Francisco MLS. Powered by 10K Research and Marketing. | 2
Months Supply 1.5 1.3 - 13.3% -- -- --
Affordability Ratio 45 39 - 13.3%
3-2012 3-2013 3-2014 3-2015
3-2012 3-2013 3-2014 3-2015
3-2012 3-2013 3-2014 3-2015
3-2012 3-2013 3-2014 3-2015
3-2012 3-2013 3-2014 3-2015
3-2012 3-2013 3-2014 3-2015
3-2012 3-2013 3-2014 3-2015
3-2012 3-2013 3-2014 3-2015
3-2012 3-2013 3-2014 3-2015
3-2012 3-2013 3-2014 3-2015
3-2012 3-2013 3-2014 3-2015
Condo/TIC/Coop Activity Overview
Key metrics by report month and for year-to-date (YTD) starting from the first of the year.
Key Metrics Historical Sparkbars 3-2014 3-2015 Percent Change YTD 2014 YTD 2015 Percent Change
- 13.2%
Pending Sales 295 293 - 0.7% 729 658 - 9.7%
New Listings 302 275 - 8.9% 940 816
Sold Listings 268 255 - 4.9% 668 574 - 14.1%
Median Sales Price $965,000 $1,100,000 + 14.0% $950,000 $1,050,000 + 10.5%
+ 16.1%
34 - 10.5%
$1,219,883
-- --
Days on Market 31 29 - 6.5% 38
Avg. Sales Price $1,059,955 $1,307,290 + 23.3% $1,050,955
Active Listings 467 348 - 25.5% --
% of Properties Sold Over List Price 71.6% 68.6% - 4.2% 63.4%
54
64.8% + 2.2%
+ 1.6%
54 0.0%
107.9%% of List Price Received 108.3% 109.6% + 1.2% 106.2%
Current as of April 11, 2015. All data from the San Francisco MLS. Powered by 10K Research and Marketing. | 3
Months Supply 1.7 1.4 - 17.6% -- -- --
Affordability Ratio 53 52 - 1.9%
3-2012 3-2013 3-2014 3-2015
3-2012 3-2013 3-2014 3-2015
3-2012 3-2013 3-2014 3-2015
3-2012 3-2013 3-2014 3-2015
3-2012 3-2013 3-2014 3-2015
3-2012 3-2013 3-2014 3-2015
3-2012 3-2013 3-2014 3-2015
3-2012 3-2013 3-2014 3-2015
3-2012 3-2013 3-2014 3-2015
3-2012 3-2013 3-2014 3-2015
3-2012 3-2013 3-2014 3-2015
New Listings
New Listings
Single
Family
Year-Over-Year
Change
Condo/TIC/
Coop
Year-Over-Year
Change
Apr-2014 241 -19.7% 367 -7.3%
May-2014 275 -18.4% 357 -7.0%
Jun-2014 277 -5.1% 359 +0.3%
Jul-2014 266 +2.7% 351 +5.7%
Aug-2014 224 -17.6% 273 -19.7%
Sep-2014 349 +19.5% 390 -12.8%
Oct-2014 248 -9.8% 332 +3.1%
Nov-2014 127 -24.4% 166 -13.1%
Dec-2014 73 -33.6% 107 -4.5%
Jan-2015 191 -5.4% 261 -21.9%
Feb-2015 221 +13.3% 280 -7.9%
Mar-2015 204 -13.6% 275 -8.9%
12-Month Avg 225 -8.2% 293 -8.0%
Historical New Listings by Month
Current as of April 11, 2015. All data from the San Francisco MLS. Powered by 10K Research and Marketing. | 4
A count of the properties that have been newly listed on the market in a given month.
254
370
236
302
204
275
Single Family Condo/TIC/Coop
March
0
100
200
300
400
500
600
700
1-2005 1-2006 1-2007 1-2008 1-2009 1-2010 1-2011 1-2012 1-2013 1-2014 1-2015
Single Family Condo/TIC/Coop
669
997
633
940
616
816
Single Family Condo/TIC/Coop
Year to Date
2013 2014 2015
- 8.9%- 18.4%- 13.6%- 7.1% - 5.7%- 2.7%- 5.4% - 13.2%
2013 2014 2015 2013 2014 2015 2013 2014 2015
- 12.4% - 16.0% + 6.2%+ 12.8%
Pending Sales
Pending Sales
Single
Family
Year-Over-Year
Change
Condo/TIC/
Coop
Year-Over-Year
Change
Apr-2014 207 -14.1% 293 -5.2%
May-2014 215 -19.8% 296 -17.8%
Jun-2014 200 -27.8% 307 +5.9%
Jul-2014 227 -8.5% 275 -17.2%
Aug-2014 204 -10.9% 266 -11.9%
Sep-2014 213 +1.9% 268 +5.5%
Oct-2014 268 +9.8% 301 -11.5%
Nov-2014 212 -4.5% 218 -19.0%
Dec-2014 135 -21.1% 209 +3.5%
Jan-2015 110 -16.7% 150 -18.0%
Feb-2015 138 -16.4% 215 -14.3%
Mar-2015 230 +6.0% 293 -0.7%
12-Month Avg 197 -10.1% 258 -8.7%
Historical Pending Sales by Month
Current as of April 11, 2015. All data from the San Francisco MLS. Powered by 10K Research and Marketing. | 5
A count of the properties on which offers have been accepted in a given month.
207
302
217
295
230
293
Single Family Condo/TIC/Coop
March
0
100
200
300
400
1-2005 1-2006 1-2007 1-2008 1-2009 1-2010 1-2011 1-2012 1-2013 1-2014 1-2015
Single Family Condo/TIC/Coop
514
692
514
729
478
658
Single Family Condo/TIC/Coop
Year to Date
2013 2014 2015
- 0.7%- 2.3%+ 6.0%+ 4.8% + 5.3%- 7.0%0.0% - 9.7%
2013 2014 2015 2013 2014 2015 2013 2014 2015
- 10.0% - 12.9% + 4.8%+ 8.6%
Sold Listings
Sold Listings
Single
Family
Year-Over-Year
Change
Condo/TIC/
Coop
Year-Over-Year
Change
Apr-2014 206 -6.8% 326 +7.2%
May-2014 230 -8.7% 295 -22.4%
Jun-2014 192 -29.7% 286 +3.2%
Jul-2014 228 -18.3% 277 -18.8%
Aug-2014 211 -11.3% 287 -5.3%
Sep-2014 196 +3.7% 247 +7.4%
Oct-2014 278 +8.6% 319 -5.1%
Nov-2014 201 -16.3% 216 -23.9%
Dec-2014 195 -8.9% 226 -8.1%
Jan-2015 109 -18.0% 158 -11.2%
Feb-2015 126 -19.7% 161 -27.5%
Mar-2015 185 +5.1% 255 -4.9%
12-Month Avg 196 -10.3% 254 -9.4%
Historical Sold Listings by Month
Current as of April 11, 2015. All data from the San Francisco MLS. Powered by 10K Research and Marketing. | 6
A count of the actual sales that closed in a given month.
207
282
176
268
185
255
Single Family Condo/TIC/Coop
March
0
100
200
300
400
1-2005 1-2006 1-2007 1-2008 1-2009 1-2010 1-2011 1-2012 1-2013 1-2014 1-2015
Single Family Condo/TIC/Coop
497
632
466
668
420
574
Single Family Condo/TIC/Coop
Year to Date
2013 2014 2015
- 4.9%- 5.0%+ 5.1%- 15.0% + 5.7%- 9.9%- 6.2% - 14.1%
2013 2014 2015 2013 2014 2015 2013 2014 2015
- 7.2% - 7.1% + 3.9%+ 6.0%
Median Sales Price
Median Sales Price
Single
Family
Year-Over-Year
Change
Condo/TIC/
Coop
Year-Over-Year
Change
Apr-2014 $1,100,000 +10.0% $905,000 +7.1%
May-2014 $1,090,500 +7.2% $940,000 +13.3%
Jun-2014 $1,175,000 +25.3% $955,000 +22.4%
Jul-2014 $1,081,000 +24.3% $950,000 +11.8%
Aug-2014 $968,000 +3.6% $930,000 +14.8%
Sep-2014 $1,037,500 +11.8% $915,000 +10.8%
Oct-2014 $1,190,000 +31.5% $955,000 +10.5%
Nov-2014 $1,126,000 +17.7% $1,020,000 +23.5%
Dec-2014 $1,075,000 +14.1% $925,000 +21.3%
Jan-2015 $975,000 +5.4% $899,500 -5.3%
Feb-2015 $1,124,000 +7.0% $1,100,000 +17.4%
Mar-2015 $1,250,000 +27.6% $1,100,000 +14.0%
12-Month Avg* $1,100,000 +17.0% $960,000 +13.6%
Historical Median Sales Price by Month
* Median Sales Price for all properties from April 2014 through March 2015. This is not the
average of the individual figures above.
Current as of April 11, 2015. All data from the San Francisco MLS. Powered by 10K Research and Marketing. | 7
Point at which half of the sales sold for more and half sold for less, not accounting for seller concessions, in a given month.
$920,000
$822,500
$980,000 $965,000
$1,250,000
$1,100,000
Single Family Condo/TIC/Coop
March
$400,000
$600,000
$800,000
$1,000,000
$1,200,000
$1,400,000
1-2005 1-2006 1-2007 1-2008 1-2009 1-2010 1-2011 1-2012 1-2013 1-2014 1-2015
Single Family Condo/TIC/Coop
$809,000
$784,500
$971,500
$950,000
$1,115,000
$1,050,000
Single Family Condo/TIC/Coop
Year to Date
2013 2014 2015
+ 14.0%+ 17.3%+ 27.6%+ 6.5% + 21.1%+ 14.8%+ 20.1% + 10.5%
2013 2014 2015 2013 2014 2015 2013 2014 2015
+ 29.0% + 21.5% + 25.3%+ 31.1%
Average Sales Price
Avg. Sales Price
Single
Family
Year-Over-Year
Change
Condo/TIC/
Coop
Year-Over-Year
Change
Apr-2014 $1,512,204 +11.4% $1,112,733 +14.3%
May-2014 $1,459,316 -2.1% $1,160,115 +18.4%
Jun-2014 $1,597,260 +33.9% $1,165,888 +25.3%
Jul-2014 $1,406,722 +9.9% $1,094,604 +7.5%
Aug-2014 $1,326,578 +1.9% $1,092,040 +17.5%
Sep-2014 $1,321,054 +7.2% $1,017,337 +8.4%
Oct-2014 $1,670,076 +23.9% $1,067,327 +5.9%
Nov-2014 $1,460,978 +10.3% $1,122,146 +14.7%
Dec-2014 $1,343,423 -1.6% $1,147,065 +12.4%
Jan-2015 $1,286,208 +3.8% $1,094,504 -1.3%
Feb-2015 $1,547,197 +5.8% $1,204,487 +21.2%
Mar-2015 $1,763,281 +26.4% $1,307,290 +23.3%
12-Month Avg* $1,482,679 +11.5% $1,129,591 +13.9%
Historical Average Sales Price by Month
* Avg. Sales Price for all properties from April 2014 through March 2015. This is not the average
of the individual figures above.
Current as of April 11, 2015. All data from the San Francisco MLS. Powered by 10K Research and Marketing. | 8
Average sales price for all closed sales, not accounting for seller concessions, in a given month.
$1,365,029
$953,615
$1,394,913
$1,059,955
$1,763,281
$1,307,290
Single Family Condo/TIC/Coop
March
$600,000
$800,000
$1,000,000
$1,200,000
$1,400,000
$1,600,000
$1,800,000
1-2005 1-2006 1-2007 1-2008 1-2009 1-2010 1-2011 1-2012 1-2013 1-2014 1-2015
Single Family Condo/TIC/Coop
$1,166,199
$899,644
$1,373,127
$1,050,955
$1,574,644
$1,219,883
Single Family Condo/TIC/Coop
Year to Date
2013 2014 2015
+ 23.3%+ 11.2%+ 26.4%+ 2.2% + 16.8%+ 14.7%+ 17.7% + 16.1%
2013 2014 2015 2013 2014 2015 2013 2014 2015
+ 44.4% + 22.1% + 22.9%+ 29.0%
Days on Market Until Sale
Days on Market
Single
Family
Year-Over-Year
Change
Condo/TIC/
Coop
Year-Over-Year
Change
Apr-2014 35 +9.4% 31 -16.2%
May-2014 24 -22.6% 28 -20.0%
Jun-2014 27 -22.9% 33 -10.8%
Jul-2014 30 -6.3% 33 -10.8%
Aug-2014 27 -27.0% 33 -13.2%
Sep-2014 26 -13.3% 37 +5.7%
Oct-2014 30 -11.8% 37 0.0%
Nov-2014 31 -6.1% 38 -5.0%
Dec-2014 38 -7.3% 47 +6.8%
Jan-2015 43 +7.5% 49 -2.0%
Feb-2015 27 -28.9% 28 -26.3%
Mar-2015 24 -22.6% 29 -6.5%
12-Month Avg* 30 -12.7% 35 -8.2%
Historical Days on Market Until Sale by Month
* Days on Market for all properties from April 2014 through March 2015. This is not the average of
the individual figures above.
Current as of April 11, 2015. All data from the San Francisco MLS. Powered by 10K Research and Marketing. | 9
Average number of days between when a property is listed and when an offer is accepted in a given month.
38
40
31 31
24
29
Single Family Condo/TIC/Coop
March
20
40
60
80
100
120
1-2005 1-2006 1-2007 1-2008 1-2009 1-2010 1-2011 1-2012 1-2013 1-2014 1-2015
Single Family Condo/TIC/Coop
42
48
36
38
30
34
Single Family Condo/TIC/Coop
Year to Date
2013 2014 2015
- 6.5%- 22.5%- 22.6%- 18.4% - 20.8%- 16.7%- 14.3% - 10.5%
2013 2014 2015 2013 2014 2015 2013 2014 2015
- 40.6% - 38.2% - 41.5%- 39.4%
Inventory of Active Listings
Active Listings
Single
Family
Year-Over-Year
Change
Condo/TIC/
Coop
Year-Over-Year
Change
Apr-2014 334 -24.8% 516 -22.1%
May-2014 372 -23.1% 552 -14.0%
Jun-2014 418 -10.3% 571 -13.0%
Jul-2014 421 -7.5% 581 -5.1%
Aug-2014 392 -15.9% 515 -12.4%
Sep-2014 487 -2.4% 579 -19.2%
Oct-2014 420 -13.8% 556 -12.7%
Nov-2014 306 -21.5% 452 -10.1%
Dec-2014 190 -28.6% 260 -21.7%
Jan-2015 252 -19.2% 354 -22.5%
Feb-2015 310 -3.1% 393 -19.1%
Mar-2015 260 -19.8% 348 -25.5%
12-Month Avg* 347 -15.3% 473 -16.0%
Historical Inventory of Active Listings by Month
* Active Listings for all properties from April 2014 through March 2015. This is not the average of
the individual figures above.
Current as of April 11, 2015. All data from the San Francisco MLS. Powered by 10K Research and Marketing. | 10
The number of properties available for sale in active status at the end of a given month.
407
616
324
467
260
348
Single Family Condo/TIC/Coop
March
0
250
500
750
1,000
1,250
1,500
1-2005 1-2006 1-2007 1-2008 1-2009 1-2010 1-2011 1-2012 1-2013 1-2014 1-2015
Single Family Condo/TIC/Coop
2013 2014 2015
- 25.5%- 24.2%- 19.8%- 20.4%
2013 2014 2015
- 30.8% - 19.2%
% of Properties Sold Over List Price
% of Properties
Sold Over List Price
Single
Family
Year-Over-Year
Change
Condo/TIC/
Coop
Year-Over-Year
Change
Apr-2014 85.9% +7.9% 69.9% +4.2%
May-2014 87.0% +11.8% 76.3% +12.9%
Jun-2014 79.2% -1.2% 69.2% -3.6%
Jul-2014 86.0% +10.1% 71.5% -2.5%
Aug-2014 80.6% +7.2% 69.3% +5.0%
Sep-2014 77.6% -1.5% 66.4% -3.3%
Oct-2014 82.4% +2.0% 69.3% +2.5%
Nov-2014 80.0% +3.2% 67.1% +7.7%
Dec-2014 73.8% +14.4% 55.3% +2.2%
Jan-2015 64.2% -1.8% 58.2% +32.0%
Feb-2015 82.5% +8.8% 65.2% -5.4%
Mar-2015 77.3% -0.6% 68.6% -4.2%
12-Month Avg 80.5% +5.2% 68.0% +2.7%
Historical % of Properties Sold Over List Price by Month
* % of Properties Sold Over List Price for all properties from April 2014 through March 2015. This
is not the average of the individual figures above.
Current as of April 11, 2015. All data from the San Francisco MLS. Powered by 10K Research and Marketing. | 11
Percentage found when dividing the number of properties sold by properties sold over its original list price, not accounting for seller
concessions.
74.9%
63.1%
77.8%
71.6%
77.3%
68.6%
Single Family Condo/TIC/Coop
March
0.0%
20.0%
40.0%
60.0%
80.0%
100.0%
1-2005 1-2006 1-2007 1-2008 1-2009 1-2010 1-2011 1-2012 1-2013 1-2014 1-2015
Single Family Condo/TIC/Coop
70.8%
54.9%
73.6%
63.4%
75.5%
64.8%
Single Family Condo/TIC/Coop
Year to Date
2013 2014 2015
- 4.2%+ 13.5%- 0.6%+ 3.9% + 15.5%+ 2.6%+ 4.0% + 2.2%
2013 2014 2015 2013 2014 2015 2013 2014 2015
+ 61.4% + 73.5% + 61.5%+ 52.4%
% of List Price Received
% of List Price
Received
Single
Family
Year-Over-Year
Change
Condo/TIC/
Coop
Year-Over-Year
Change
Apr-2014 115.1% +3.1% 108.2% +2.5%
May-2014 115.7% +4.0% 109.1% +3.0%
Jun-2014 113.8% +1.2% 108.3% +1.2%
Jul-2014 114.1% +4.1% 108.1% +1.2%
Aug-2014 111.2% +1.0% 106.4% +0.9%
Sep-2014 111.7% +1.7% 105.3% -0.4%
Oct-2014 113.0% +2.5% 106.9% +1.3%
Nov-2014 111.3% +2.4% 106.5% +1.4%
Dec-2014 109.0% +2.1% 103.5% +0.1%
Jan-2015 107.8% +0.1% 104.9% +1.8%
Feb-2015 114.9% +4.3% 108.0% +1.7%
Mar-2015 113.8% +1.7% 109.6% +1.2%
12-Month Avg* 112.8% +2.4% 107.2% +1.4%
Historical % of List Price Received by Month
* % of List Price Received for all properties from April 2014 through March 2015. This is not the
average of the individual figures above.
Current as of April 11, 2015. All data from the San Francisco MLS. Powered by 10K Research and Marketing. | 12
Percentage found when dividing a property’s sales price by its most recent list price, then taking the average for all properties sold in a given
month, not accounting for seller concessions.
109.9%
104.9%
111.9%
108.3%
113.8%
109.6%
Single Family Condo/TIC/Coop
March
108.3%
103.7%
110.1%
106.2%
112.6%
107.9%
Single Family Condo/TIC/Coop
Year to Date
95.0%
100.0%
105.0%
110.0%
115.0%
120.0%
1-2005 1-2006 1-2007 1-2008 1-2009 1-2010 1-2011 1-2012 1-2013 1-2014 1-2015
Single Family Condo/TIC/Coop
2013 2014 2015
+ 1.2%+ 3.2%+ 1.7%+ 1.8%
2013 2014 2015
+ 8.0% + 4.2%
2013 2014 2015
+ 1.6%+ 2.4%+ 2.3%+ 1.7%
2013 2014 2015
+ 7.4% + 3.9%
Housing Affordability Ratio
Affordability Ratio
Single
Family
Year-Over-Year
Change
Condo/TIC/
Coop
Year-Over-Year
Change
Apr-2014 40 -20.0% 56 -17.6%
May-2014 42 -10.6% 56 -16.4%
Jun-2014 39 -18.8% 55 -16.7%
Jul-2014 42 -20.8% 55 -9.8%
Aug-2014 47 -2.1% 56 -11.1%
Sep-2014 43 -12.2% 57 -9.5%
Oct-2014 39 -23.5% 55 -9.8%
Nov-2014 41 -19.6% 52 -22.4%
Dec-2014 43 -12.2% 58 -15.9%
Jan-2015 51 +8.5% 63 +18.9%
Feb-2015 44 +4.8% 52 -3.7%
Mar-2015 39 -13.3% 52 -1.9%
12-Month Avg* 42 -19.5% 48 -16.4%
Historical Housing Affordability Ratio by Month
* Affordability Ratio for all properties from April 2014 through March 2015. This is not the average
of the individual figures above.
Current as of April 11, 2015. All data from the San Francisco MLS. Powered by 10K Research and Marketing. | 13
This index measures housing affordability for the region. An index of 120 means the median household income is 120% of what is necessary to
qualify for the median-priced home under prevailing interest rates. A higher number means greater affordability.
53
69
45
53
39
52
Single Family Condo/TIC/Coop
March
30
40
50
60
70
80
90
100
1-2005 1-2006 1-2007 1-2008 1-2009 1-2010 1-2011 1-2012 1-2013 1-2014 1-2015
Single Family Condo/TIC/Coop
2013 2014 2015
- 1.9%- 23.2%- 13.3%- 15.1%
2013 2014 2015
- 20.9% - 18.8%
61
72
46
54
44
54
Single Family Condo/TIC/Coop
Year to Date
2013 2014 2015
0.0%- 25.0%- 4.3%- 24.6%
2013 2014 2015
- 14.1% - 15.3%
Months Supply of Inventory
Months Supply
Single
Family
Year-Over-Year
Change
Condo/TIC/
Coop
Year-Over-Year
Change
Apr-2014 1.5 -28.6% 1.8 -28.0%
May-2014 1.8 -18.2% 2.0 -16.7%
Jun-2014 2.0 -4.8% 2.1 -16.0%
Jul-2014 2.1 +5.0% 2.1 -8.7%
Aug-2014 1.9 -9.5% 1.9 -13.6%
Sep-2014 2.4 +9.1% 2.1 -19.2%
Oct-2014 2.1 -4.5% 2.1 -8.7%
Nov-2014 1.5 -16.7% 1.7 -5.6%
Dec-2014 1.0 -16.7% 1.0 -16.7%
Jan-2015 1.3 -7.1% 1.4 -12.5%
Feb-2015 1.6 +6.7% 1.5 -11.8%
Mar-2015 1.3 -13.3% 1.4 -17.6%
12-Month Avg* 1.7 -8.4% 1.8 -14.5%
Historical Months Supply of Inventory by Month
* Months Supply for all properties from April 2014 through March 2015. This is not the average of
the individual figures above.
Current as of April 11, 2015. All data from the San Francisco MLS. Powered by 10K Research and Marketing. | 14
The inventory of homes for sale at the end of a given month, divided by the average monthly pending sales from the last 12 months.
1.9
2.3
1.5
1.7
1.3 1.4
Single Family Condo/TIC/Coop
March
0.0
2.0
4.0
6.0
8.0
10.0
1-2005 1-2006 1-2007 1-2008 1-2009 1-2010 1-2011 1-2012 1-2013 1-2014 1-2015
Single Family Condo/TIC/Coop
2013 2014 2015
- 17.6%- 26.1%- 13.3%- 21.1%
2013 2014 2015
- 32.1% - 34.3%
All Properties Activity Overview
Key metrics by report month and for year-to-date (YTD) starting from the first of the year.
Key Metrics Historical Sparkbars 3-2014 3-2015 Percent Change YTD 2014 YTD 2015 Percent Change
- 9.0%
Pending Sales 512 523 + 2.1% 1,243 1,136 - 8.6%
New Listings 538 479 - 11.0% 1,573 1,432
Sold Listings 444 440 - 0.9% 1,134 994 - 12.3%
Median Sales Price $971,500 $1,137,500 + 17.1% $955,250 $1,096,500 + 14.8%
+ 15.7%
32 - 13.5%
$1,369,782
-- --
Days on Market 31 27 - 12.9% 37
Avg. Sales Price $1,192,731 $1,499,013 + 25.7% $1,183,463
Active Listings 791 608 - 23.1% --
% of Properties Sold Over List Price 74.1% 72.3% - 2.4% 67.6%
43
69.3% + 2.5%
+ 1.9%
42 - 3.8%
109.8%% of List Price Received 109.7% 111.3% + 1.5% 107.8%
Current as of April 11, 2015. All data from the San Francisco MLS. Powered by 10K Research and Marketing. | 15
Months Supply 1.6 1.3 - 18.8% -- -- --
Affordability Ratio 43 38 - 11.2%
3-2012 3-2013 3-2014 3-2015
3-2012 3-2013 3-2014 3-2015
3-2012 3-2013 3-2014 3-2015
3-2012 3-2013 3-2014 3-2015
3-2012 3-2013 3-2014 3-2015
3-2012 3-2013 3-2014 3-2015
3-2012 3-2013 3-2014 3-2015
3-2012 3-2013 3-2014 3-2015
3-2012 3-2013 3-2014 3-2015
3-2012 3-2013 3-2014 3-2015
3-2012 3-2013 3-2014 3-2015
Activity by District
SF District 1: Northwest (Sea Cliff, Lake, Jordan Park / Laurel Heights, Outer Richmond, Central Richmond, Inner Richmond, Lone Mountain)
SF District 2: Central West (Outer Sunset, Central Sunset, Inner Sunset, Outer Parkside, Parkside, Inner Parkside, Golden Gate Heights)
SF District 3: Southwest (Pine Lake Park, Lake Shore, Merced Manor, Stonestown, Lakeside, Merced Heights, Ingleside, Ingleside Heights, Oceanview)
SF District 4: Twin Peaks W (Forest Hill (& Ext), W Portal, St Francis Wd, Balboa Terr, Mt Dav Manor, Ingleside Terr, Monterey Hts, Wstwd Pk & H'lnds, Shrwd Fst, Miraloma Pk, Dmnd Hts, Mdtwn Terr)
SF District 5: Central (Haight Ashbury, Cole Vly / Prnssus Hts, Clarndn Hts, Corona Hts, Twin Pks, Glen Pk, Noe Vly, Eureka Vly / Dolores Hts, Mission Dolores, Duboce Trngl, Buena Vista / Ashbury Hts)
SF District 6: Central North (Lower Pacific Heights, Anza Vista, Western Addition, North Panhandle, Alamo Square, Hayes Valley)
SF District 7: North (Marina, Cow Hollow, Presidio Heights, Pacific Heights)
SF District 8: Northeast (North Waterfront, North Beach, Russian Hill, Telegraph Hill, Nob Hill, Financial District / Barbary Coast, Downtown, Van Ness / Civic Center, Tenderloin)
SF District 9: Central East (Yerba Buena, South Beach, South of Market, Mission Bay, Inner Mission, Potrero Hill, Central Waterfront / Dogpatch, Bernal Heights)
SF District 10: Southeast (Outer Mission, Mission Terr, Excelsior, Portola, Bayview, Silver Terr, Hunters Pt, Candlestick Pt, Bayview Hts, Little Hollywood, Visitation Vly, Crocker Amazon)
3-2014 3-2015 + / – 3-2014 3-2015 + / – 3-2014 3-2015 + / – 3-2014 3-2015 + / – 3-2014 3-2015 + / –
Single Family
1 SF District 1 28 16 -42.9% 13 18 +38.5% $1,226,000 $2,075,000 +69.2% 50 18 -64.0% 1.5 0.9 -40.0%
2 SF District 2 45 39 -13.3% 38 32 -15.8% $945,000 $1,124,013 +18.9% 34 18 -47.1% 1.1 1.1 0.0%
3 SF District 3 26 21 -19.2% 12 7 -41.7% $679,000 $905,000 +33.3% 43 50 +16.3% 1.6 1.5 -6.3%
4 SF District 4 30 26 -13.3% 26 17 -34.6% $1,355,000 $1,150,000 -15.1% 27 26 -3.7% 1.1 1.0 -9.1%
5 SF District 5 38 28 -26.3% 25 35 +40.0% $2,505,000 $2,205,000 -12.0% 16 16 0.0% 1.2 1.1 -8.3%
6 SF District 6 5 7 +40.0% 1 0 -100.0% $1,900,000 $0 -100.0% 22 0 -100.0% 1.2 2.4 +100.0%
7 SF District 7 21 15 -28.6% 7 12 +71.4% $4,500,000 $5,087,500 +13.1% 14 19 +35.7% 1.8 1.5 -16.7%
8 SF District 8 7 5 -28.6% 0 2 -- $0 $1,655,000 -- 0 33 -- 3.5 2.3 -34.3%
9 SF District 9 30 21 -30.0% 11 21 +90.9% $1,240,000 $1,425,000 +14.9% 24 21 -12.5% 1.3 1.0 -23.1%
10 SF District 10 94 82 -12.8% 43 41 -4.7% $645,000 $736,000 +14.1% 35 35 0.0% 2.2 1.9 -13.6%
Condo/TIC/Coop
1 SF District 1 23 15 -34.8% 9 8 -11.1% $1,100,000 $1,225,000 +11.4% 32 14 -56.3% 1.9 1.1 -42.1%
2 SF District 2 8 2 -75.0% 3 2 -33.3% $1,011,000 $840,000 -16.9% 20 130 +550.0% 1.7 0.5 -70.6%
3 SF District 3 2 5 +150.0% 3 2 -33.3% $475,000 $545,000 +14.7% 48 14 -70.8% 0.7 1.3 +85.7%
4 SF District 4 13 10 -23.1% 4 1 -75.0% $620,000 $600,000 -3.2% 25 13 -48.0% 2.3 2.4 +4.3%
5 SF District 5 64 49 -23.4% 52 50 -3.8% $1,054,500 $1,065,000 +1.0% 28 24 -14.3% 1.5 1.3 -13.3%
6 SF District 6 37 21 -43.2% 29 29 0.0% $921,000 $1,000,000 +8.6% 29 26 -10.3% 1.2 0.8 -33.3%
7 SF District 7 39 23 -41.0% 22 24 +9.1% $1,172,500 $1,626,500 +38.7% 23 14 -39.1% 1.3 0.9 -30.8%
8 SF District 8 88 68 -22.7% 58 30 -48.3% $897,500 $1,354,167 +50.9% 41 35 -14.6% 1.8 1.7 -5.6%
9 SF District 9 175 143 -18.3% 82 103 +25.6% $962,500 $1,099,000 +14.2% 28 34 +21.4% 1.7 1.5 -11.8%
10 SF District 10 18 12 -33.3% 6 6 0.0% $484,500 $825,000 +70.3% 44 23 -47.7% 3.0 2.5 -16.7%
Key metrics by report month for the districts of San Fransisco.
Current as of April 11, 2015. All data from the San Francisco MLS. Powered by 10K Research and Marketing. | 16
Active Listings Sold Listings Median Sales Price Days on Market Months Supply

More Related Content

What's hot

San Francisco Real Estate Market Report August 2014
San Francisco Real Estate Market Report August 2014San Francisco Real Estate Market Report August 2014
San Francisco Real Estate Market Report August 2014
Ronny Budiutama
 
San Francisco Market Focus May 2014
San Francisco Market Focus May 2014San Francisco Market Focus May 2014
San Francisco Market Focus May 2014
Ronny Budiutama
 

What's hot (20)

San Francisco Market Focus June 2016
San Francisco Market Focus June 2016San Francisco Market Focus June 2016
San Francisco Market Focus June 2016
 
San Francisco Market Focus August 2015
San Francisco Market Focus August 2015San Francisco Market Focus August 2015
San Francisco Market Focus August 2015
 
San Francisco Market Focus July 2016
San Francisco Market Focus July 2016San Francisco Market Focus July 2016
San Francisco Market Focus July 2016
 
San Francisco Market Focus August 2017
San Francisco Market Focus August 2017San Francisco Market Focus August 2017
San Francisco Market Focus August 2017
 
San Francisco Market Focus December 2015
San Francisco Market Focus December 2015San Francisco Market Focus December 2015
San Francisco Market Focus December 2015
 
San Francisco Market Focus September 2016
San Francisco Market Focus September 2016San Francisco Market Focus September 2016
San Francisco Market Focus September 2016
 
San Francisco Market Focus March 2016
San Francisco Market Focus March 2016San Francisco Market Focus March 2016
San Francisco Market Focus March 2016
 
San Francisco Real Estate Market Report August 2014
San Francisco Real Estate Market Report August 2014San Francisco Real Estate Market Report August 2014
San Francisco Real Estate Market Report August 2014
 
San Francisco Real Estate Housing Market December 2016
San Francisco Real Estate Housing Market December 2016San Francisco Real Estate Housing Market December 2016
San Francisco Real Estate Housing Market December 2016
 
San Francisco Market Focus October 2016
San Francisco Market Focus October 2016San Francisco Market Focus October 2016
San Francisco Market Focus October 2016
 
San Francisco Market Focus January 2016
San Francisco Market Focus January 2016San Francisco Market Focus January 2016
San Francisco Market Focus January 2016
 
San Francisco Market Focus May 2014
San Francisco Market Focus May 2014San Francisco Market Focus May 2014
San Francisco Market Focus May 2014
 
San Francisco Market Focus February 2015
San Francisco Market Focus February 2015San Francisco Market Focus February 2015
San Francisco Market Focus February 2015
 
San Francisco Market Focus February 2017
San Francisco Market Focus February 2017San Francisco Market Focus February 2017
San Francisco Market Focus February 2017
 
San Francisco Market Focus March 2014
San Francisco Market Focus March 2014San Francisco Market Focus March 2014
San Francisco Market Focus March 2014
 
San Francisco Market Focus Report July
San Francisco Market Focus Report JulySan Francisco Market Focus Report July
San Francisco Market Focus Report July
 
San Francisco Market Focus June 2014
San Francisco Market Focus June 2014San Francisco Market Focus June 2014
San Francisco Market Focus June 2014
 
San Francisco Market Focus July 2017
San Francisco Market Focus July 2017San Francisco Market Focus July 2017
San Francisco Market Focus July 2017
 
San Francisco Market Focus March 2017
San Francisco Market Focus March 2017San Francisco Market Focus March 2017
San Francisco Market Focus March 2017
 
San Francisco Real Estate Housing Market January 2017
San Francisco Real Estate Housing Market January 2017San Francisco Real Estate Housing Market January 2017
San Francisco Real Estate Housing Market January 2017
 

Viewers also liked (8)

San Francisco Market Data December 2014
San Francisco Market Data December 2014San Francisco Market Data December 2014
San Francisco Market Data December 2014
 
San Francisco Residential Data Q2 2009 - Q2 2011
San Francisco Residential Data Q2 2009 - Q2 2011San Francisco Residential Data Q2 2009 - Q2 2011
San Francisco Residential Data Q2 2009 - Q2 2011
 
San Francisco Residential Data Q2 2007 - Q2 2010
San Francisco Residential Data Q2 2007 - Q2 2010San Francisco Residential Data Q2 2007 - Q2 2010
San Francisco Residential Data Q2 2007 - Q2 2010
 
San francisco Real Estate Market June 2010 - June 2012
San francisco Real Estate Market June 2010 - June 2012San francisco Real Estate Market June 2010 - June 2012
San francisco Real Estate Market June 2010 - June 2012
 
Sf Residential Real Estate Market Report Jan 2010 - Jan 2012
Sf Residential Real Estate Market Report  Jan 2010 - Jan 2012Sf Residential Real Estate Market Report  Jan 2010 - Jan 2012
Sf Residential Real Estate Market Report Jan 2010 - Jan 2012
 
2015 California Economic Outlook and Market Outlook. San Francisco Bay Area R...
2015 California Economic Outlook and Market Outlook. San Francisco Bay Area R...2015 California Economic Outlook and Market Outlook. San Francisco Bay Area R...
2015 California Economic Outlook and Market Outlook. San Francisco Bay Area R...
 
San Francisco Residential Market July 2010 - July 2012
San Francisco Residential Market July 2010 - July 2012San Francisco Residential Market July 2010 - July 2012
San Francisco Residential Market July 2010 - July 2012
 
Foreclosure Alternatives
Foreclosure  AlternativesForeclosure  Alternatives
Foreclosure Alternatives
 

Similar to San Francisco Market Focus March 2015

Similar to San Francisco Market Focus March 2015 (14)

San Francisco Market Focus October 2014
San Francisco Market Focus October 2014San Francisco Market Focus October 2014
San Francisco Market Focus October 2014
 
San Francisco Market Focus June 2017
San Francisco Market Focus June 2017San Francisco Market Focus June 2017
San Francisco Market Focus June 2017
 
San Francisco Market Focus May 2017
San Francisco Market Focus May 2017San Francisco Market Focus May 2017
San Francisco Market Focus May 2017
 
San Francisco Market Focus October 2015
San Francisco Market Focus October 2015San Francisco Market Focus October 2015
San Francisco Market Focus October 2015
 
San Francisco Market Focus April 2017
San Francisco Market Focus April 2017San Francisco Market Focus April 2017
San Francisco Market Focus April 2017
 
San Francisco Market Focus February 2016
San Francisco Market Focus February 2016San Francisco Market Focus February 2016
San Francisco Market Focus February 2016
 
San Francisco Market Focus January 2015
San Francisco Market Focus January 2015San Francisco Market Focus January 2015
San Francisco Market Focus January 2015
 
San Francisco Market Focus May 2013
San Francisco Market Focus May 2013San Francisco Market Focus May 2013
San Francisco Market Focus May 2013
 
San Francisco Market Focus March 2018
San Francisco Market Focus March 2018San Francisco Market Focus March 2018
San Francisco Market Focus March 2018
 
San Francisco Market Focus February 2014
San Francisco Market Focus February 2014San Francisco Market Focus February 2014
San Francisco Market Focus February 2014
 
San Francisco Market Focus April 2014
San Francisco Market Focus April 2014San Francisco Market Focus April 2014
San Francisco Market Focus April 2014
 
San Francisco Market Focus Report May 2019
San Francisco Market Focus Report May 2019San Francisco Market Focus Report May 2019
San Francisco Market Focus Report May 2019
 
San Francisco Market Focus August 2013
San Francisco Market Focus August 2013San Francisco Market Focus August 2013
San Francisco Market Focus August 2013
 
San Francisco Market Report March 2021
San Francisco Market Report March 2021San Francisco Market Report March 2021
San Francisco Market Report March 2021
 

More from Ronny Budiutama

More from Ronny Budiutama (20)

San Francisco January 2024 Market Report
San Francisco January 2024 Market ReportSan Francisco January 2024 Market Report
San Francisco January 2024 Market Report
 
San Francisco December 2023 Market Report
San Francisco December 2023 Market ReportSan Francisco December 2023 Market Report
San Francisco December 2023 Market Report
 
San Francisco November 2023 Market Report
San Francisco November 2023 Market ReportSan Francisco November 2023 Market Report
San Francisco November 2023 Market Report
 
2023 Annual San Francisco Housing Market
2023 Annual San Francisco Housing Market2023 Annual San Francisco Housing Market
2023 Annual San Francisco Housing Market
 
October 2023 Report: San Francisco Real Estate Market Insights
October 2023 Report: San Francisco Real Estate Market InsightsOctober 2023 Report: San Francisco Real Estate Market Insights
October 2023 Report: San Francisco Real Estate Market Insights
 
CA Weekly MLS Market Data Report - August 2023
CA Weekly MLS Market Data Report - August 2023CA Weekly MLS Market Data Report - August 2023
CA Weekly MLS Market Data Report - August 2023
 
San Francisco Market Report July 2023.pdf
San Francisco Market Report July 2023.pdfSan Francisco Market Report July 2023.pdf
San Francisco Market Report July 2023.pdf
 
San Francisco May 2023 Market Report.pdf
San Francisco May 2023 Market Report.pdfSan Francisco May 2023 Market Report.pdf
San Francisco May 2023 Market Report.pdf
 
San Francisco June 2023 Market Report.pdf
San Francisco June 2023 Market Report.pdfSan Francisco June 2023 Market Report.pdf
San Francisco June 2023 Market Report.pdf
 
San Francisco Market Report March 2023.pdf
San Francisco Market Report March 2023.pdfSan Francisco Market Report March 2023.pdf
San Francisco Market Report March 2023.pdf
 
San Francisco Market Report February 2023
San Francisco Market Report February 2023San Francisco Market Report February 2023
San Francisco Market Report February 2023
 
San Francisco Market Report January 2023.pdf
San Francisco Market Report January 2023.pdfSan Francisco Market Report January 2023.pdf
San Francisco Market Report January 2023.pdf
 
Annual Report on the San Francisco County Housing Market.pdf
Annual Report on the San Francisco County Housing Market.pdfAnnual Report on the San Francisco County Housing Market.pdf
Annual Report on the San Francisco County Housing Market.pdf
 
San Francisco Market Report December 2022.pdf
San Francisco Market Report December 2022.pdfSan Francisco Market Report December 2022.pdf
San Francisco Market Report December 2022.pdf
 
San Francisco Market Report November 2022.pdf
San Francisco Market Report November 2022.pdfSan Francisco Market Report November 2022.pdf
San Francisco Market Report November 2022.pdf
 
San Francisco Market Report October 2022.pdf
San Francisco Market Report October 2022.pdfSan Francisco Market Report October 2022.pdf
San Francisco Market Report October 2022.pdf
 
San Francisco Market Report September 2022.pdf
San Francisco Market Report September 2022.pdfSan Francisco Market Report September 2022.pdf
San Francisco Market Report September 2022.pdf
 
San Francisco Market Report August 2022.pdf
San Francisco Market Report August 2022.pdfSan Francisco Market Report August 2022.pdf
San Francisco Market Report August 2022.pdf
 
San Francisco Market Report July 2022.pdf
San Francisco Market Report July 2022.pdfSan Francisco Market Report July 2022.pdf
San Francisco Market Report July 2022.pdf
 
San Francisco Market Report June 2022.pdf
San Francisco Market Report June 2022.pdfSan Francisco Market Report June 2022.pdf
San Francisco Market Report June 2022.pdf
 

Recently uploaded

Bptp The Amaario Launch Luxury Project Sector 37D Gurgaon Dwarka Expressway...
Bptp The Amaario Launch  Luxury Project  Sector 37D Gurgaon Dwarka Expressway...Bptp The Amaario Launch  Luxury Project  Sector 37D Gurgaon Dwarka Expressway...
Bptp The Amaario Launch Luxury Project Sector 37D Gurgaon Dwarka Expressway...
ApartmentWala1
 
9990771857 Call Girls in Dwarka Sector 2 Delhi (Call Girls) Delhi
9990771857 Call Girls in Dwarka Sector 2 Delhi (Call Girls) Delhi9990771857 Call Girls in Dwarka Sector 2 Delhi (Call Girls) Delhi
9990771857 Call Girls in Dwarka Sector 2 Delhi (Call Girls) Delhi
delhimodel235
 
9990771857 Call Girls Dwarka Sector 9 Delhi (Call Girls ) Delhi
9990771857 Call Girls Dwarka Sector 9 Delhi (Call Girls ) Delhi9990771857 Call Girls Dwarka Sector 9 Delhi (Call Girls ) Delhi
9990771857 Call Girls Dwarka Sector 9 Delhi (Call Girls ) Delhi
delhimodel235
 
9990771857 Call Girls in Dwarka Sector 7 Delhi (Call Girls) Delhi
9990771857 Call Girls in Dwarka Sector 7 Delhi (Call Girls) Delhi9990771857 Call Girls in Dwarka Sector 7 Delhi (Call Girls) Delhi
9990771857 Call Girls in Dwarka Sector 7 Delhi (Call Girls) Delhi
delhimodel235
 
Call Girls in Karkardooma Delhi +91 84487779280}Woman Seeking Man in Delhi NCR
Call Girls in Karkardooma Delhi +91 84487779280}Woman Seeking Man in Delhi NCRCall Girls in Karkardooma Delhi +91 84487779280}Woman Seeking Man in Delhi NCR
Call Girls in Karkardooma Delhi +91 84487779280}Woman Seeking Man in Delhi NCR
asmaqueen5
 
Call Girls In Laxmi Nagar Delhi +91-8447779280! !Best Woman Seeking Man Escor...
Call Girls In Laxmi Nagar Delhi +91-8447779280! !Best Woman Seeking Man Escor...Call Girls In Laxmi Nagar Delhi +91-8447779280! !Best Woman Seeking Man Escor...
Call Girls In Laxmi Nagar Delhi +91-8447779280! !Best Woman Seeking Man Escor...
asmaqueen5
 
Call Girls In Seelampur Delhi ↬8447779280}Seelampur Escorts Service In Delhi...
Call Girls In Seelampur  Delhi ↬8447779280}Seelampur Escorts Service In Delhi...Call Girls In Seelampur  Delhi ↬8447779280}Seelampur Escorts Service In Delhi...
Call Girls In Seelampur Delhi ↬8447779280}Seelampur Escorts Service In Delhi...
asmaqueen5
 
9990771857 Call Girls in Dwarka Sector 6 Delhi (Call Girls) Delhi
9990771857 Call Girls in Dwarka Sector 6 Delhi (Call Girls) Delhi9990771857 Call Girls in Dwarka Sector 6 Delhi (Call Girls) Delhi
9990771857 Call Girls in Dwarka Sector 6 Delhi (Call Girls) Delhi
delhimodel235
 

Recently uploaded (20)

Mahindra Happinest Tathawade Pune Brochure.pdf
Mahindra Happinest Tathawade Pune Brochure.pdfMahindra Happinest Tathawade Pune Brochure.pdf
Mahindra Happinest Tathawade Pune Brochure.pdf
 
Bptp The Amaario Launch Luxury Project Sector 37D Gurgaon Dwarka Expressway...
Bptp The Amaario Launch  Luxury Project  Sector 37D Gurgaon Dwarka Expressway...Bptp The Amaario Launch  Luxury Project  Sector 37D Gurgaon Dwarka Expressway...
Bptp The Amaario Launch Luxury Project Sector 37D Gurgaon Dwarka Expressway...
 
Enjoy Night ≽ 8448380779 ≼ Call Girls In Iffco Chowk (Gurgaon)
Enjoy Night ≽ 8448380779 ≼ Call Girls In Iffco Chowk (Gurgaon)Enjoy Night ≽ 8448380779 ≼ Call Girls In Iffco Chowk (Gurgaon)
Enjoy Night ≽ 8448380779 ≼ Call Girls In Iffco Chowk (Gurgaon)
 
9990771857 Call Girls in Dwarka Sector 2 Delhi (Call Girls) Delhi
9990771857 Call Girls in Dwarka Sector 2 Delhi (Call Girls) Delhi9990771857 Call Girls in Dwarka Sector 2 Delhi (Call Girls) Delhi
9990771857 Call Girls in Dwarka Sector 2 Delhi (Call Girls) Delhi
 
9990771857 Call Girls Dwarka Sector 9 Delhi (Call Girls ) Delhi
9990771857 Call Girls Dwarka Sector 9 Delhi (Call Girls ) Delhi9990771857 Call Girls Dwarka Sector 9 Delhi (Call Girls ) Delhi
9990771857 Call Girls Dwarka Sector 9 Delhi (Call Girls ) Delhi
 
9990771857 Call Girls in Dwarka Sector 7 Delhi (Call Girls) Delhi
9990771857 Call Girls in Dwarka Sector 7 Delhi (Call Girls) Delhi9990771857 Call Girls in Dwarka Sector 7 Delhi (Call Girls) Delhi
9990771857 Call Girls in Dwarka Sector 7 Delhi (Call Girls) Delhi
 
Magarpatta Nova Elegance Mundhwa Pune E-Brochure.pdf
Magarpatta Nova Elegance Mundhwa Pune  E-Brochure.pdfMagarpatta Nova Elegance Mundhwa Pune  E-Brochure.pdf
Magarpatta Nova Elegance Mundhwa Pune E-Brochure.pdf
 
Call Girls in Karkardooma Delhi +91 84487779280}Woman Seeking Man in Delhi NCR
Call Girls in Karkardooma Delhi +91 84487779280}Woman Seeking Man in Delhi NCRCall Girls in Karkardooma Delhi +91 84487779280}Woman Seeking Man in Delhi NCR
Call Girls in Karkardooma Delhi +91 84487779280}Woman Seeking Man in Delhi NCR
 
Call Girls In Laxmi Nagar Delhi +91-8447779280! !Best Woman Seeking Man Escor...
Call Girls In Laxmi Nagar Delhi +91-8447779280! !Best Woman Seeking Man Escor...Call Girls In Laxmi Nagar Delhi +91-8447779280! !Best Woman Seeking Man Escor...
Call Girls In Laxmi Nagar Delhi +91-8447779280! !Best Woman Seeking Man Escor...
 
Enjoy Night ≽ 8448380779 ≼ Call Girls In Huda City Centre (Gurgaon)
Enjoy Night ≽ 8448380779 ≼ Call Girls In Huda City Centre (Gurgaon)Enjoy Night ≽ 8448380779 ≼ Call Girls In Huda City Centre (Gurgaon)
Enjoy Night ≽ 8448380779 ≼ Call Girls In Huda City Centre (Gurgaon)
 
Call Girls In Seelampur Delhi ↬8447779280}Seelampur Escorts Service In Delhi...
Call Girls In Seelampur  Delhi ↬8447779280}Seelampur Escorts Service In Delhi...Call Girls In Seelampur  Delhi ↬8447779280}Seelampur Escorts Service In Delhi...
Call Girls In Seelampur Delhi ↬8447779280}Seelampur Escorts Service In Delhi...
 
Parksville 96 Surrey Floor Plans May 2024
Parksville 96 Surrey Floor Plans May 2024Parksville 96 Surrey Floor Plans May 2024
Parksville 96 Surrey Floor Plans May 2024
 
SVN Live 5.6.24 Weekly Property Broadcast
SVN Live 5.6.24 Weekly Property BroadcastSVN Live 5.6.24 Weekly Property Broadcast
SVN Live 5.6.24 Weekly Property Broadcast
 
BDSM⚡Call Girls in Sector 57 Noida Escorts >༒8448380779 Escort Service
BDSM⚡Call Girls in Sector 57 Noida Escorts >༒8448380779 Escort ServiceBDSM⚡Call Girls in Sector 57 Noida Escorts >༒8448380779 Escort Service
BDSM⚡Call Girls in Sector 57 Noida Escorts >༒8448380779 Escort Service
 
M3M The Line Brochure - Premium Investment Opportunity for Commercial Ventures
M3M The Line Brochure - Premium Investment Opportunity for Commercial VenturesM3M The Line Brochure - Premium Investment Opportunity for Commercial Ventures
M3M The Line Brochure - Premium Investment Opportunity for Commercial Ventures
 
Kohinoor Hinjewadi Phase 2 Pune E-Brochure.pdf
Kohinoor Hinjewadi Phase 2 Pune  E-Brochure.pdfKohinoor Hinjewadi Phase 2 Pune  E-Brochure.pdf
Kohinoor Hinjewadi Phase 2 Pune E-Brochure.pdf
 
Premium Villa Projects in Sarjapur Road Bengaluru
Premium Villa Projects in Sarjapur Road BengaluruPremium Villa Projects in Sarjapur Road Bengaluru
Premium Villa Projects in Sarjapur Road Bengaluru
 
9990771857 Call Girls in Dwarka Sector 6 Delhi (Call Girls) Delhi
9990771857 Call Girls in Dwarka Sector 6 Delhi (Call Girls) Delhi9990771857 Call Girls in Dwarka Sector 6 Delhi (Call Girls) Delhi
9990771857 Call Girls in Dwarka Sector 6 Delhi (Call Girls) Delhi
 
The Gale at Godrej Park World Hinjewadi Pune Brochure.pdf
The Gale at Godrej Park World Hinjewadi Pune Brochure.pdfThe Gale at Godrej Park World Hinjewadi Pune Brochure.pdf
The Gale at Godrej Park World Hinjewadi Pune Brochure.pdf
 
M3M 129 E Brochure Noida Expressway, Sector 129, Noida
M3M 129 E Brochure Noida Expressway, Sector 129, NoidaM3M 129 E Brochure Noida Expressway, Sector 129, Noida
M3M 129 E Brochure Noida Expressway, Sector 129, Noida
 

San Francisco Market Focus March 2015

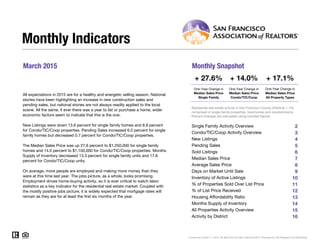
  • 1. March 2015 Monthly Snapshot One-Year Change in One-Year Change in Median Sales Price Single Family Median Sales Price Condo/TIC/Coop 2 3 4 5 6 7 8 9 10 11 12 13 14 15 16 Current as of April 11, 2015. All data from the San Francisco MLS. Powered by 10K Research and Marketing. Condo/TIC/Coop Activity Overview Inventory of Active Listings % of Properties Sold Over List Price % of List Price Received Housing Affordability Ratio All Properties Activity Overview New Listings Pending Sales Sold Listings Median Sales Price Average Sales Price Days on Market Until Sale Activity by District Monthly Indicators + 27.6% + 14.0% + 17.1% One-Year Change in All expectations in 2015 are for a healthy and energetic selling season. National stories have been highlighting an increase in new construction sales and pending sales, but national stories are not always readily applied to the local scene. All the same, if ever there was a year to list or purchase a home, wider economic factors seem to indicate that this is the one. New Listings were down 13.6 percent for single family homes and 8.9 percent for Condo/TIC/Coop properties. Pending Sales increased 6.0 percent for single family homes but decreased 0.7 percent for Condo/TIC/Coop properties. The Median Sales Price was up 27.6 percent to $1,250,000 for single family homes and 14.0 percent to $1,100,000 for Condo/TIC/Coop properties. Months Supply of Inventory decreased 13.3 percent for single family units and 17.6 percent for Condo/TIC/Coop units. On average, more people are employed and making more money than they were at this time last year. The jobs picture, as a whole, looks promising. Employment drives home-buying activity, so it is ever critical to watch labor statistics as a key indicator for the residential real estate market. Coupled with the mostly positive jobs picture, it is widely expected that mortgage rates will remain as they are for at least the first six months of the year. Median Sales Price All Property Types Residential real estate activity in San Francisco County (Districts 1-10), comprised of single-family properties, townhomes and condominiums. Percent changes are calculated using rounded figures. Single Family Activity Overview Months Supply of Inventory
  • 2. Single Family Activity Overview Key metrics by report month and for year-to-date (YTD) starting from the first of the year. Key Metrics Historical Sparkbars 3-2014 3-2015 Percent Change YTD 2014 YTD 2015 Percent Change - 2.7%616 420 - 9.9% $1,115,000 + 14.8% + 14.7% Pending Sales 217 230 + 6.0% - 7.0%514 478 New Listings 236 204 - 13.6% 633 Sold Listings 176 185 + 5.1% 466 Median Sales Price $980,000 $1,250,000 + 27.6% $971,500 30 - 16.7% $1,574,644 -- -- Days on Market 31 24 - 22.6% 36 Avg. Sales Price $1,394,913 $1,763,281 + 26.4% $1,373,127 Active Listings 324 260 - 19.8% -- % of Properties Sold Over List Price 77.8% 77.3% - 0.6% 73.6% 46 75.5% + 2.6% + 2.3% 44 - 4.3% 112.6%% of List Price Received 111.9% 113.8% + 1.7% 110.1% Current as of April 11, 2015. All data from the San Francisco MLS. Powered by 10K Research and Marketing. | 2 Months Supply 1.5 1.3 - 13.3% -- -- -- Affordability Ratio 45 39 - 13.3% 3-2012 3-2013 3-2014 3-2015 3-2012 3-2013 3-2014 3-2015 3-2012 3-2013 3-2014 3-2015 3-2012 3-2013 3-2014 3-2015 3-2012 3-2013 3-2014 3-2015 3-2012 3-2013 3-2014 3-2015 3-2012 3-2013 3-2014 3-2015 3-2012 3-2013 3-2014 3-2015 3-2012 3-2013 3-2014 3-2015 3-2012 3-2013 3-2014 3-2015 3-2012 3-2013 3-2014 3-2015
  • 3. Condo/TIC/Coop Activity Overview Key metrics by report month and for year-to-date (YTD) starting from the first of the year. Key Metrics Historical Sparkbars 3-2014 3-2015 Percent Change YTD 2014 YTD 2015 Percent Change - 13.2% Pending Sales 295 293 - 0.7% 729 658 - 9.7% New Listings 302 275 - 8.9% 940 816 Sold Listings 268 255 - 4.9% 668 574 - 14.1% Median Sales Price $965,000 $1,100,000 + 14.0% $950,000 $1,050,000 + 10.5% + 16.1% 34 - 10.5% $1,219,883 -- -- Days on Market 31 29 - 6.5% 38 Avg. Sales Price $1,059,955 $1,307,290 + 23.3% $1,050,955 Active Listings 467 348 - 25.5% -- % of Properties Sold Over List Price 71.6% 68.6% - 4.2% 63.4% 54 64.8% + 2.2% + 1.6% 54 0.0% 107.9%% of List Price Received 108.3% 109.6% + 1.2% 106.2% Current as of April 11, 2015. All data from the San Francisco MLS. Powered by 10K Research and Marketing. | 3 Months Supply 1.7 1.4 - 17.6% -- -- -- Affordability Ratio 53 52 - 1.9% 3-2012 3-2013 3-2014 3-2015 3-2012 3-2013 3-2014 3-2015 3-2012 3-2013 3-2014 3-2015 3-2012 3-2013 3-2014 3-2015 3-2012 3-2013 3-2014 3-2015 3-2012 3-2013 3-2014 3-2015 3-2012 3-2013 3-2014 3-2015 3-2012 3-2013 3-2014 3-2015 3-2012 3-2013 3-2014 3-2015 3-2012 3-2013 3-2014 3-2015 3-2012 3-2013 3-2014 3-2015
  • 4. New Listings New Listings Single Family Year-Over-Year Change Condo/TIC/ Coop Year-Over-Year Change Apr-2014 241 -19.7% 367 -7.3% May-2014 275 -18.4% 357 -7.0% Jun-2014 277 -5.1% 359 +0.3% Jul-2014 266 +2.7% 351 +5.7% Aug-2014 224 -17.6% 273 -19.7% Sep-2014 349 +19.5% 390 -12.8% Oct-2014 248 -9.8% 332 +3.1% Nov-2014 127 -24.4% 166 -13.1% Dec-2014 73 -33.6% 107 -4.5% Jan-2015 191 -5.4% 261 -21.9% Feb-2015 221 +13.3% 280 -7.9% Mar-2015 204 -13.6% 275 -8.9% 12-Month Avg 225 -8.2% 293 -8.0% Historical New Listings by Month Current as of April 11, 2015. All data from the San Francisco MLS. Powered by 10K Research and Marketing. | 4 A count of the properties that have been newly listed on the market in a given month. 254 370 236 302 204 275 Single Family Condo/TIC/Coop March 0 100 200 300 400 500 600 700 1-2005 1-2006 1-2007 1-2008 1-2009 1-2010 1-2011 1-2012 1-2013 1-2014 1-2015 Single Family Condo/TIC/Coop 669 997 633 940 616 816 Single Family Condo/TIC/Coop Year to Date 2013 2014 2015 - 8.9%- 18.4%- 13.6%- 7.1% - 5.7%- 2.7%- 5.4% - 13.2% 2013 2014 2015 2013 2014 2015 2013 2014 2015 - 12.4% - 16.0% + 6.2%+ 12.8%
  • 5. Pending Sales Pending Sales Single Family Year-Over-Year Change Condo/TIC/ Coop Year-Over-Year Change Apr-2014 207 -14.1% 293 -5.2% May-2014 215 -19.8% 296 -17.8% Jun-2014 200 -27.8% 307 +5.9% Jul-2014 227 -8.5% 275 -17.2% Aug-2014 204 -10.9% 266 -11.9% Sep-2014 213 +1.9% 268 +5.5% Oct-2014 268 +9.8% 301 -11.5% Nov-2014 212 -4.5% 218 -19.0% Dec-2014 135 -21.1% 209 +3.5% Jan-2015 110 -16.7% 150 -18.0% Feb-2015 138 -16.4% 215 -14.3% Mar-2015 230 +6.0% 293 -0.7% 12-Month Avg 197 -10.1% 258 -8.7% Historical Pending Sales by Month Current as of April 11, 2015. All data from the San Francisco MLS. Powered by 10K Research and Marketing. | 5 A count of the properties on which offers have been accepted in a given month. 207 302 217 295 230 293 Single Family Condo/TIC/Coop March 0 100 200 300 400 1-2005 1-2006 1-2007 1-2008 1-2009 1-2010 1-2011 1-2012 1-2013 1-2014 1-2015 Single Family Condo/TIC/Coop 514 692 514 729 478 658 Single Family Condo/TIC/Coop Year to Date 2013 2014 2015 - 0.7%- 2.3%+ 6.0%+ 4.8% + 5.3%- 7.0%0.0% - 9.7% 2013 2014 2015 2013 2014 2015 2013 2014 2015 - 10.0% - 12.9% + 4.8%+ 8.6%
  • 6. Sold Listings Sold Listings Single Family Year-Over-Year Change Condo/TIC/ Coop Year-Over-Year Change Apr-2014 206 -6.8% 326 +7.2% May-2014 230 -8.7% 295 -22.4% Jun-2014 192 -29.7% 286 +3.2% Jul-2014 228 -18.3% 277 -18.8% Aug-2014 211 -11.3% 287 -5.3% Sep-2014 196 +3.7% 247 +7.4% Oct-2014 278 +8.6% 319 -5.1% Nov-2014 201 -16.3% 216 -23.9% Dec-2014 195 -8.9% 226 -8.1% Jan-2015 109 -18.0% 158 -11.2% Feb-2015 126 -19.7% 161 -27.5% Mar-2015 185 +5.1% 255 -4.9% 12-Month Avg 196 -10.3% 254 -9.4% Historical Sold Listings by Month Current as of April 11, 2015. All data from the San Francisco MLS. Powered by 10K Research and Marketing. | 6 A count of the actual sales that closed in a given month. 207 282 176 268 185 255 Single Family Condo/TIC/Coop March 0 100 200 300 400 1-2005 1-2006 1-2007 1-2008 1-2009 1-2010 1-2011 1-2012 1-2013 1-2014 1-2015 Single Family Condo/TIC/Coop 497 632 466 668 420 574 Single Family Condo/TIC/Coop Year to Date 2013 2014 2015 - 4.9%- 5.0%+ 5.1%- 15.0% + 5.7%- 9.9%- 6.2% - 14.1% 2013 2014 2015 2013 2014 2015 2013 2014 2015 - 7.2% - 7.1% + 3.9%+ 6.0%
  • 7. Median Sales Price Median Sales Price Single Family Year-Over-Year Change Condo/TIC/ Coop Year-Over-Year Change Apr-2014 $1,100,000 +10.0% $905,000 +7.1% May-2014 $1,090,500 +7.2% $940,000 +13.3% Jun-2014 $1,175,000 +25.3% $955,000 +22.4% Jul-2014 $1,081,000 +24.3% $950,000 +11.8% Aug-2014 $968,000 +3.6% $930,000 +14.8% Sep-2014 $1,037,500 +11.8% $915,000 +10.8% Oct-2014 $1,190,000 +31.5% $955,000 +10.5% Nov-2014 $1,126,000 +17.7% $1,020,000 +23.5% Dec-2014 $1,075,000 +14.1% $925,000 +21.3% Jan-2015 $975,000 +5.4% $899,500 -5.3% Feb-2015 $1,124,000 +7.0% $1,100,000 +17.4% Mar-2015 $1,250,000 +27.6% $1,100,000 +14.0% 12-Month Avg* $1,100,000 +17.0% $960,000 +13.6% Historical Median Sales Price by Month * Median Sales Price for all properties from April 2014 through March 2015. This is not the average of the individual figures above. Current as of April 11, 2015. All data from the San Francisco MLS. Powered by 10K Research and Marketing. | 7 Point at which half of the sales sold for more and half sold for less, not accounting for seller concessions, in a given month. $920,000 $822,500 $980,000 $965,000 $1,250,000 $1,100,000 Single Family Condo/TIC/Coop March $400,000 $600,000 $800,000 $1,000,000 $1,200,000 $1,400,000 1-2005 1-2006 1-2007 1-2008 1-2009 1-2010 1-2011 1-2012 1-2013 1-2014 1-2015 Single Family Condo/TIC/Coop $809,000 $784,500 $971,500 $950,000 $1,115,000 $1,050,000 Single Family Condo/TIC/Coop Year to Date 2013 2014 2015 + 14.0%+ 17.3%+ 27.6%+ 6.5% + 21.1%+ 14.8%+ 20.1% + 10.5% 2013 2014 2015 2013 2014 2015 2013 2014 2015 + 29.0% + 21.5% + 25.3%+ 31.1%
  • 8. Average Sales Price Avg. Sales Price Single Family Year-Over-Year Change Condo/TIC/ Coop Year-Over-Year Change Apr-2014 $1,512,204 +11.4% $1,112,733 +14.3% May-2014 $1,459,316 -2.1% $1,160,115 +18.4% Jun-2014 $1,597,260 +33.9% $1,165,888 +25.3% Jul-2014 $1,406,722 +9.9% $1,094,604 +7.5% Aug-2014 $1,326,578 +1.9% $1,092,040 +17.5% Sep-2014 $1,321,054 +7.2% $1,017,337 +8.4% Oct-2014 $1,670,076 +23.9% $1,067,327 +5.9% Nov-2014 $1,460,978 +10.3% $1,122,146 +14.7% Dec-2014 $1,343,423 -1.6% $1,147,065 +12.4% Jan-2015 $1,286,208 +3.8% $1,094,504 -1.3% Feb-2015 $1,547,197 +5.8% $1,204,487 +21.2% Mar-2015 $1,763,281 +26.4% $1,307,290 +23.3% 12-Month Avg* $1,482,679 +11.5% $1,129,591 +13.9% Historical Average Sales Price by Month * Avg. Sales Price for all properties from April 2014 through March 2015. This is not the average of the individual figures above. Current as of April 11, 2015. All data from the San Francisco MLS. Powered by 10K Research and Marketing. | 8 Average sales price for all closed sales, not accounting for seller concessions, in a given month. $1,365,029 $953,615 $1,394,913 $1,059,955 $1,763,281 $1,307,290 Single Family Condo/TIC/Coop March $600,000 $800,000 $1,000,000 $1,200,000 $1,400,000 $1,600,000 $1,800,000 1-2005 1-2006 1-2007 1-2008 1-2009 1-2010 1-2011 1-2012 1-2013 1-2014 1-2015 Single Family Condo/TIC/Coop $1,166,199 $899,644 $1,373,127 $1,050,955 $1,574,644 $1,219,883 Single Family Condo/TIC/Coop Year to Date 2013 2014 2015 + 23.3%+ 11.2%+ 26.4%+ 2.2% + 16.8%+ 14.7%+ 17.7% + 16.1% 2013 2014 2015 2013 2014 2015 2013 2014 2015 + 44.4% + 22.1% + 22.9%+ 29.0%
  • 9. Days on Market Until Sale Days on Market Single Family Year-Over-Year Change Condo/TIC/ Coop Year-Over-Year Change Apr-2014 35 +9.4% 31 -16.2% May-2014 24 -22.6% 28 -20.0% Jun-2014 27 -22.9% 33 -10.8% Jul-2014 30 -6.3% 33 -10.8% Aug-2014 27 -27.0% 33 -13.2% Sep-2014 26 -13.3% 37 +5.7% Oct-2014 30 -11.8% 37 0.0% Nov-2014 31 -6.1% 38 -5.0% Dec-2014 38 -7.3% 47 +6.8% Jan-2015 43 +7.5% 49 -2.0% Feb-2015 27 -28.9% 28 -26.3% Mar-2015 24 -22.6% 29 -6.5% 12-Month Avg* 30 -12.7% 35 -8.2% Historical Days on Market Until Sale by Month * Days on Market for all properties from April 2014 through March 2015. This is not the average of the individual figures above. Current as of April 11, 2015. All data from the San Francisco MLS. Powered by 10K Research and Marketing. | 9 Average number of days between when a property is listed and when an offer is accepted in a given month. 38 40 31 31 24 29 Single Family Condo/TIC/Coop March 20 40 60 80 100 120 1-2005 1-2006 1-2007 1-2008 1-2009 1-2010 1-2011 1-2012 1-2013 1-2014 1-2015 Single Family Condo/TIC/Coop 42 48 36 38 30 34 Single Family Condo/TIC/Coop Year to Date 2013 2014 2015 - 6.5%- 22.5%- 22.6%- 18.4% - 20.8%- 16.7%- 14.3% - 10.5% 2013 2014 2015 2013 2014 2015 2013 2014 2015 - 40.6% - 38.2% - 41.5%- 39.4%
  • 10. Inventory of Active Listings Active Listings Single Family Year-Over-Year Change Condo/TIC/ Coop Year-Over-Year Change Apr-2014 334 -24.8% 516 -22.1% May-2014 372 -23.1% 552 -14.0% Jun-2014 418 -10.3% 571 -13.0% Jul-2014 421 -7.5% 581 -5.1% Aug-2014 392 -15.9% 515 -12.4% Sep-2014 487 -2.4% 579 -19.2% Oct-2014 420 -13.8% 556 -12.7% Nov-2014 306 -21.5% 452 -10.1% Dec-2014 190 -28.6% 260 -21.7% Jan-2015 252 -19.2% 354 -22.5% Feb-2015 310 -3.1% 393 -19.1% Mar-2015 260 -19.8% 348 -25.5% 12-Month Avg* 347 -15.3% 473 -16.0% Historical Inventory of Active Listings by Month * Active Listings for all properties from April 2014 through March 2015. This is not the average of the individual figures above. Current as of April 11, 2015. All data from the San Francisco MLS. Powered by 10K Research and Marketing. | 10 The number of properties available for sale in active status at the end of a given month. 407 616 324 467 260 348 Single Family Condo/TIC/Coop March 0 250 500 750 1,000 1,250 1,500 1-2005 1-2006 1-2007 1-2008 1-2009 1-2010 1-2011 1-2012 1-2013 1-2014 1-2015 Single Family Condo/TIC/Coop 2013 2014 2015 - 25.5%- 24.2%- 19.8%- 20.4% 2013 2014 2015 - 30.8% - 19.2%
  • 11. % of Properties Sold Over List Price % of Properties Sold Over List Price Single Family Year-Over-Year Change Condo/TIC/ Coop Year-Over-Year Change Apr-2014 85.9% +7.9% 69.9% +4.2% May-2014 87.0% +11.8% 76.3% +12.9% Jun-2014 79.2% -1.2% 69.2% -3.6% Jul-2014 86.0% +10.1% 71.5% -2.5% Aug-2014 80.6% +7.2% 69.3% +5.0% Sep-2014 77.6% -1.5% 66.4% -3.3% Oct-2014 82.4% +2.0% 69.3% +2.5% Nov-2014 80.0% +3.2% 67.1% +7.7% Dec-2014 73.8% +14.4% 55.3% +2.2% Jan-2015 64.2% -1.8% 58.2% +32.0% Feb-2015 82.5% +8.8% 65.2% -5.4% Mar-2015 77.3% -0.6% 68.6% -4.2% 12-Month Avg 80.5% +5.2% 68.0% +2.7% Historical % of Properties Sold Over List Price by Month * % of Properties Sold Over List Price for all properties from April 2014 through March 2015. This is not the average of the individual figures above. Current as of April 11, 2015. All data from the San Francisco MLS. Powered by 10K Research and Marketing. | 11 Percentage found when dividing the number of properties sold by properties sold over its original list price, not accounting for seller concessions. 74.9% 63.1% 77.8% 71.6% 77.3% 68.6% Single Family Condo/TIC/Coop March 0.0% 20.0% 40.0% 60.0% 80.0% 100.0% 1-2005 1-2006 1-2007 1-2008 1-2009 1-2010 1-2011 1-2012 1-2013 1-2014 1-2015 Single Family Condo/TIC/Coop 70.8% 54.9% 73.6% 63.4% 75.5% 64.8% Single Family Condo/TIC/Coop Year to Date 2013 2014 2015 - 4.2%+ 13.5%- 0.6%+ 3.9% + 15.5%+ 2.6%+ 4.0% + 2.2% 2013 2014 2015 2013 2014 2015 2013 2014 2015 + 61.4% + 73.5% + 61.5%+ 52.4%
  • 12. % of List Price Received % of List Price Received Single Family Year-Over-Year Change Condo/TIC/ Coop Year-Over-Year Change Apr-2014 115.1% +3.1% 108.2% +2.5% May-2014 115.7% +4.0% 109.1% +3.0% Jun-2014 113.8% +1.2% 108.3% +1.2% Jul-2014 114.1% +4.1% 108.1% +1.2% Aug-2014 111.2% +1.0% 106.4% +0.9% Sep-2014 111.7% +1.7% 105.3% -0.4% Oct-2014 113.0% +2.5% 106.9% +1.3% Nov-2014 111.3% +2.4% 106.5% +1.4% Dec-2014 109.0% +2.1% 103.5% +0.1% Jan-2015 107.8% +0.1% 104.9% +1.8% Feb-2015 114.9% +4.3% 108.0% +1.7% Mar-2015 113.8% +1.7% 109.6% +1.2% 12-Month Avg* 112.8% +2.4% 107.2% +1.4% Historical % of List Price Received by Month * % of List Price Received for all properties from April 2014 through March 2015. This is not the average of the individual figures above. Current as of April 11, 2015. All data from the San Francisco MLS. Powered by 10K Research and Marketing. | 12 Percentage found when dividing a property’s sales price by its most recent list price, then taking the average for all properties sold in a given month, not accounting for seller concessions. 109.9% 104.9% 111.9% 108.3% 113.8% 109.6% Single Family Condo/TIC/Coop March 108.3% 103.7% 110.1% 106.2% 112.6% 107.9% Single Family Condo/TIC/Coop Year to Date 95.0% 100.0% 105.0% 110.0% 115.0% 120.0% 1-2005 1-2006 1-2007 1-2008 1-2009 1-2010 1-2011 1-2012 1-2013 1-2014 1-2015 Single Family Condo/TIC/Coop 2013 2014 2015 + 1.2%+ 3.2%+ 1.7%+ 1.8% 2013 2014 2015 + 8.0% + 4.2% 2013 2014 2015 + 1.6%+ 2.4%+ 2.3%+ 1.7% 2013 2014 2015 + 7.4% + 3.9%
  • 13. Housing Affordability Ratio Affordability Ratio Single Family Year-Over-Year Change Condo/TIC/ Coop Year-Over-Year Change Apr-2014 40 -20.0% 56 -17.6% May-2014 42 -10.6% 56 -16.4% Jun-2014 39 -18.8% 55 -16.7% Jul-2014 42 -20.8% 55 -9.8% Aug-2014 47 -2.1% 56 -11.1% Sep-2014 43 -12.2% 57 -9.5% Oct-2014 39 -23.5% 55 -9.8% Nov-2014 41 -19.6% 52 -22.4% Dec-2014 43 -12.2% 58 -15.9% Jan-2015 51 +8.5% 63 +18.9% Feb-2015 44 +4.8% 52 -3.7% Mar-2015 39 -13.3% 52 -1.9% 12-Month Avg* 42 -19.5% 48 -16.4% Historical Housing Affordability Ratio by Month * Affordability Ratio for all properties from April 2014 through March 2015. This is not the average of the individual figures above. Current as of April 11, 2015. All data from the San Francisco MLS. Powered by 10K Research and Marketing. | 13 This index measures housing affordability for the region. An index of 120 means the median household income is 120% of what is necessary to qualify for the median-priced home under prevailing interest rates. A higher number means greater affordability. 53 69 45 53 39 52 Single Family Condo/TIC/Coop March 30 40 50 60 70 80 90 100 1-2005 1-2006 1-2007 1-2008 1-2009 1-2010 1-2011 1-2012 1-2013 1-2014 1-2015 Single Family Condo/TIC/Coop 2013 2014 2015 - 1.9%- 23.2%- 13.3%- 15.1% 2013 2014 2015 - 20.9% - 18.8% 61 72 46 54 44 54 Single Family Condo/TIC/Coop Year to Date 2013 2014 2015 0.0%- 25.0%- 4.3%- 24.6% 2013 2014 2015 - 14.1% - 15.3%
  • 14. Months Supply of Inventory Months Supply Single Family Year-Over-Year Change Condo/TIC/ Coop Year-Over-Year Change Apr-2014 1.5 -28.6% 1.8 -28.0% May-2014 1.8 -18.2% 2.0 -16.7% Jun-2014 2.0 -4.8% 2.1 -16.0% Jul-2014 2.1 +5.0% 2.1 -8.7% Aug-2014 1.9 -9.5% 1.9 -13.6% Sep-2014 2.4 +9.1% 2.1 -19.2% Oct-2014 2.1 -4.5% 2.1 -8.7% Nov-2014 1.5 -16.7% 1.7 -5.6% Dec-2014 1.0 -16.7% 1.0 -16.7% Jan-2015 1.3 -7.1% 1.4 -12.5% Feb-2015 1.6 +6.7% 1.5 -11.8% Mar-2015 1.3 -13.3% 1.4 -17.6% 12-Month Avg* 1.7 -8.4% 1.8 -14.5% Historical Months Supply of Inventory by Month * Months Supply for all properties from April 2014 through March 2015. This is not the average of the individual figures above. Current as of April 11, 2015. All data from the San Francisco MLS. Powered by 10K Research and Marketing. | 14 The inventory of homes for sale at the end of a given month, divided by the average monthly pending sales from the last 12 months. 1.9 2.3 1.5 1.7 1.3 1.4 Single Family Condo/TIC/Coop March 0.0 2.0 4.0 6.0 8.0 10.0 1-2005 1-2006 1-2007 1-2008 1-2009 1-2010 1-2011 1-2012 1-2013 1-2014 1-2015 Single Family Condo/TIC/Coop 2013 2014 2015 - 17.6%- 26.1%- 13.3%- 21.1% 2013 2014 2015 - 32.1% - 34.3%
  • 15. All Properties Activity Overview Key metrics by report month and for year-to-date (YTD) starting from the first of the year. Key Metrics Historical Sparkbars 3-2014 3-2015 Percent Change YTD 2014 YTD 2015 Percent Change - 9.0% Pending Sales 512 523 + 2.1% 1,243 1,136 - 8.6% New Listings 538 479 - 11.0% 1,573 1,432 Sold Listings 444 440 - 0.9% 1,134 994 - 12.3% Median Sales Price $971,500 $1,137,500 + 17.1% $955,250 $1,096,500 + 14.8% + 15.7% 32 - 13.5% $1,369,782 -- -- Days on Market 31 27 - 12.9% 37 Avg. Sales Price $1,192,731 $1,499,013 + 25.7% $1,183,463 Active Listings 791 608 - 23.1% -- % of Properties Sold Over List Price 74.1% 72.3% - 2.4% 67.6% 43 69.3% + 2.5% + 1.9% 42 - 3.8% 109.8%% of List Price Received 109.7% 111.3% + 1.5% 107.8% Current as of April 11, 2015. All data from the San Francisco MLS. Powered by 10K Research and Marketing. | 15 Months Supply 1.6 1.3 - 18.8% -- -- -- Affordability Ratio 43 38 - 11.2% 3-2012 3-2013 3-2014 3-2015 3-2012 3-2013 3-2014 3-2015 3-2012 3-2013 3-2014 3-2015 3-2012 3-2013 3-2014 3-2015 3-2012 3-2013 3-2014 3-2015 3-2012 3-2013 3-2014 3-2015 3-2012 3-2013 3-2014 3-2015 3-2012 3-2013 3-2014 3-2015 3-2012 3-2013 3-2014 3-2015 3-2012 3-2013 3-2014 3-2015 3-2012 3-2013 3-2014 3-2015
  • 16. Activity by District SF District 1: Northwest (Sea Cliff, Lake, Jordan Park / Laurel Heights, Outer Richmond, Central Richmond, Inner Richmond, Lone Mountain) SF District 2: Central West (Outer Sunset, Central Sunset, Inner Sunset, Outer Parkside, Parkside, Inner Parkside, Golden Gate Heights) SF District 3: Southwest (Pine Lake Park, Lake Shore, Merced Manor, Stonestown, Lakeside, Merced Heights, Ingleside, Ingleside Heights, Oceanview) SF District 4: Twin Peaks W (Forest Hill (& Ext), W Portal, St Francis Wd, Balboa Terr, Mt Dav Manor, Ingleside Terr, Monterey Hts, Wstwd Pk & H'lnds, Shrwd Fst, Miraloma Pk, Dmnd Hts, Mdtwn Terr) SF District 5: Central (Haight Ashbury, Cole Vly / Prnssus Hts, Clarndn Hts, Corona Hts, Twin Pks, Glen Pk, Noe Vly, Eureka Vly / Dolores Hts, Mission Dolores, Duboce Trngl, Buena Vista / Ashbury Hts) SF District 6: Central North (Lower Pacific Heights, Anza Vista, Western Addition, North Panhandle, Alamo Square, Hayes Valley) SF District 7: North (Marina, Cow Hollow, Presidio Heights, Pacific Heights) SF District 8: Northeast (North Waterfront, North Beach, Russian Hill, Telegraph Hill, Nob Hill, Financial District / Barbary Coast, Downtown, Van Ness / Civic Center, Tenderloin) SF District 9: Central East (Yerba Buena, South Beach, South of Market, Mission Bay, Inner Mission, Potrero Hill, Central Waterfront / Dogpatch, Bernal Heights) SF District 10: Southeast (Outer Mission, Mission Terr, Excelsior, Portola, Bayview, Silver Terr, Hunters Pt, Candlestick Pt, Bayview Hts, Little Hollywood, Visitation Vly, Crocker Amazon) 3-2014 3-2015 + / – 3-2014 3-2015 + / – 3-2014 3-2015 + / – 3-2014 3-2015 + / – 3-2014 3-2015 + / – Single Family 1 SF District 1 28 16 -42.9% 13 18 +38.5% $1,226,000 $2,075,000 +69.2% 50 18 -64.0% 1.5 0.9 -40.0% 2 SF District 2 45 39 -13.3% 38 32 -15.8% $945,000 $1,124,013 +18.9% 34 18 -47.1% 1.1 1.1 0.0% 3 SF District 3 26 21 -19.2% 12 7 -41.7% $679,000 $905,000 +33.3% 43 50 +16.3% 1.6 1.5 -6.3% 4 SF District 4 30 26 -13.3% 26 17 -34.6% $1,355,000 $1,150,000 -15.1% 27 26 -3.7% 1.1 1.0 -9.1% 5 SF District 5 38 28 -26.3% 25 35 +40.0% $2,505,000 $2,205,000 -12.0% 16 16 0.0% 1.2 1.1 -8.3% 6 SF District 6 5 7 +40.0% 1 0 -100.0% $1,900,000 $0 -100.0% 22 0 -100.0% 1.2 2.4 +100.0% 7 SF District 7 21 15 -28.6% 7 12 +71.4% $4,500,000 $5,087,500 +13.1% 14 19 +35.7% 1.8 1.5 -16.7% 8 SF District 8 7 5 -28.6% 0 2 -- $0 $1,655,000 -- 0 33 -- 3.5 2.3 -34.3% 9 SF District 9 30 21 -30.0% 11 21 +90.9% $1,240,000 $1,425,000 +14.9% 24 21 -12.5% 1.3 1.0 -23.1% 10 SF District 10 94 82 -12.8% 43 41 -4.7% $645,000 $736,000 +14.1% 35 35 0.0% 2.2 1.9 -13.6% Condo/TIC/Coop 1 SF District 1 23 15 -34.8% 9 8 -11.1% $1,100,000 $1,225,000 +11.4% 32 14 -56.3% 1.9 1.1 -42.1% 2 SF District 2 8 2 -75.0% 3 2 -33.3% $1,011,000 $840,000 -16.9% 20 130 +550.0% 1.7 0.5 -70.6% 3 SF District 3 2 5 +150.0% 3 2 -33.3% $475,000 $545,000 +14.7% 48 14 -70.8% 0.7 1.3 +85.7% 4 SF District 4 13 10 -23.1% 4 1 -75.0% $620,000 $600,000 -3.2% 25 13 -48.0% 2.3 2.4 +4.3% 5 SF District 5 64 49 -23.4% 52 50 -3.8% $1,054,500 $1,065,000 +1.0% 28 24 -14.3% 1.5 1.3 -13.3% 6 SF District 6 37 21 -43.2% 29 29 0.0% $921,000 $1,000,000 +8.6% 29 26 -10.3% 1.2 0.8 -33.3% 7 SF District 7 39 23 -41.0% 22 24 +9.1% $1,172,500 $1,626,500 +38.7% 23 14 -39.1% 1.3 0.9 -30.8% 8 SF District 8 88 68 -22.7% 58 30 -48.3% $897,500 $1,354,167 +50.9% 41 35 -14.6% 1.8 1.7 -5.6% 9 SF District 9 175 143 -18.3% 82 103 +25.6% $962,500 $1,099,000 +14.2% 28 34 +21.4% 1.7 1.5 -11.8% 10 SF District 10 18 12 -33.3% 6 6 0.0% $484,500 $825,000 +70.3% 44 23 -47.7% 3.0 2.5 -16.7% Key metrics by report month for the districts of San Fransisco. Current as of April 11, 2015. All data from the San Francisco MLS. Powered by 10K Research and Marketing. | 16 Active Listings Sold Listings Median Sales Price Days on Market Months Supply