
Recommended
More Related Content
What's hot
What's hot (20)
Similar to water in the villages of Odisha
Similar to water in the villages of Odisha (20)
More from ravi mahato
Recently uploaded
Recently uploaded (20)
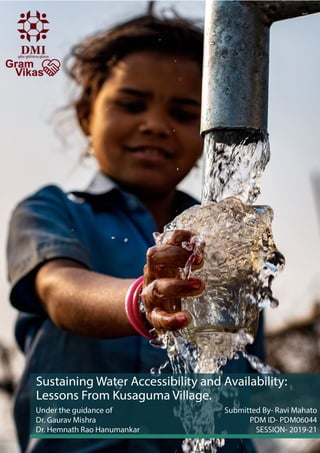
water in the villages of Odisha
- 2. Declaration This is to certify that I, Ravi Mahato participant of the PGDM program at Development Management Institute, Patna hereby declare that the theme paper on “Sustaining Water Accessibility and Availability: Lessons From Kusaguma Village.” is the result of my own work & observations. Place- Kusaguma, Odisha Ravi Mahato Date- 3rd February 2020.
- 3. ACKNOWLEDGEMENT It is a great pleasure to express my gratitude and indebtedness to my Faculty Guides Dr. Gaurav Mishra and Prof. (Dr.) Hemnath Rao Hanumankar for their guidance, encouragement, moral support and affection through the course of my work. I am also grateful to all the staff members of Gram Vikas, Odisha for extending their helping hands and supporting me in conducting all the Surveys and studies successfully within time. I am also thankful to all the villagers of Kusaguma, Odisha for the wonderful stay in the village and to all my well-wishers for their inspiration and help. My sincere thanks to all of my friends, who have patiently extended all sorts of help and loving supports during completion of this work. Ravi Mahato. PDM06044
- 4. Table of Contents INTRODUCTION 5 SOURCES OF DATA 5 LIMITATIONS OF THE STUDY 5 VILLAGE BACKGROUND. 9 SITUATION BEFORE 9 HOW IT ALL STARTED 10 AFTER THE INTERVENTION 11 WATER QUALITY MANAGEMENT 11 TABLE 1:AVERAGE WATER CONSUMPTION OF EVERY HOUSEHOLD 18 CALCULATING THE SIZE OF THE TANK 22 CONSERVING WATER 25 RECHARGING GROUND WATER 29 OTHER WAYS OF OVERCOMING THE PROBLEM OF WATER SCARCITY. 30 CONCLUSION 33
- 5. Introduction The paper tells about the management of water resources in the village Kusaguma of the state Odisha and the intervention of gram Vikas in improving their lives by finding solutions to their water crises. The paper tries to capture the details of water management in the village and the possible solutions. Sources of data Primary Data Secondary Data FGD Gram panchayat office Transact walk Household survey observations Limitations of the study • Language Barrier. • Villagers hesitate to express. • Limited availably of resource person.
- 6. Governance and Institutional capacities for sanitation. The department of Panchayati Raj and drinking water is the department which takes care of the enforcement and efficient working of water and sanitation programmes in the state of Odisha, aiming to keep the state clean, defecation free and access to water which is fit for drinking, to every household. The state has employed a multi-tier decentralized mechanism which involves the State level, district level, Gram panchayat level and village level in implementing different programmes. Since, such type of programme large community support, awareness, monitoring and social support, Panchayati raj institutions plays a very important role in achieving the goals. Implementation Framework To assure adequate implementation of the states sanitation policy i.e. ORSP, the government will keep making attempts in the direction of outlining relevant guidance for program implementation through issuance of definitive instructions and encourage investments in the improvement of solid and liquid waste management. The implementation framework, concerns about the technology selection, overall institutional plans, financial framework requirement to accomplish sanitation outcomes focusing the inclusion of gender, children, Economic status, differently-abled and other social aspects. Communication, monitoring and evaluation system are to be placed correctly for the effective delivery of drinking water and sanitation services to every household in the villages. The program, at present is being implemented successfully in 30 districts and 6826 GPs of the state and it is mandatory to classify and yardstick the current scenario of the water and sanitation service. At the present the development model is slowly finishing the urban- rural divide, and arrangement of sufficient service with care to water and sanitation is crucial. With the growing population, there is need to focus and improve the current situation of water and sanitation. Making district wide sanitation plans initiated from the gram panchayat level and strengthening through the blocks at district level is an important tool for the implementation and observing progress with respect to the above-mentioned goals. The district level plans will be developed in discussion with the collaborators who are in the venture of providing sanitation for one and all. The Panchayati raj & Drinking water department of the state government is responsible for the implementation of programs and planning on achieving the objectives. Besides achieving the 100% ODF, the policy aims the establishing plans for Solid and liquid waste management. Thus, it is compulsory for the government to endorse suitable measures to sustain the laid infrastructure not only at individual but also at common places and peripheral areas of the village. At State level
- 7. At state level all the work related to water and sanitation is taken care by the Odisha State water & sanitation Mission (OSWSM) The principal Secretary of Rural Development Department takes all the major decisions and takes care of the over-all implementation and functioning of the Swatch Bharat mission- Grameen in the state which includes, planning and review, monitoring of the program status and evaluation of the projects. A monitoring committee is formed under the chairmanship of Chief Secretary which addresses to the concerns related to the convergence, inter departmental coordination and evaluation quarterly in a year. Besides the monitoring committee another state level Steering Committee is formed whose work is to review the progress achieved in the program and to identify the constraints which are affecting the implementation of the program, the steering committee meeting takes place once in every two months. There is also a State Level Resource Group which comprises of 7-members and its takes care of capacitates stakeholders particularly in preparation of Gram Panchayat development plan for the state. At the District Level – District Water and Sanitation Mission (DWSM) At the district level it comes under the District Water and sanitation Mission (DWSM) The district collector takes care of this and is the chairperson. The Executive Engineer(RWSS) is the secretary of the DWSM which is headed by the District Collector and backed by a unit of Engineers, RWSS staff at district and gram panchayats. Executive Engineer is the person answerable for the application, monitoring and finance of the project. The district water and sanitation organization advisors and the District project coordinators are the people who are responsible for assisting the district water and sanitation mission officers in the project, coordinating with the various agencies and monitoring of the swatch bharat mission- Grameen program. A District Level Steering Committee cum Resource Group is created under the Chairmanship of District Collector which undertakes bimonthly review of the programmes for periodic reporting to PR&DW Director. At Block Level At block level it is headed by the block development officer who works in close association with the junior Engineers, the rural water supply and sanitation departments, Block coordinator and cluster coordinator. It is responsible for looking after the overall works at the gram Panchayat level regarding water and sanitation. At Gram Panchayat Level Gram Panchayat is the reporting organization at the village level. There are committees created in the village level named Village Health and Sanitation Committees (VHSC), Village water and sanitation Committees (VWSCs) and Swachhagrahis which are involved in the application and monitoring of the ongoing projects at the gram panchayat level. There is a standing committee which has been created to look after the sanitation programs at the village levels. Village water & sanitation Committee (VWSC)
- 8. The VWSC is a Committee which is created by the Gram Panchayat as is a committed institution for the designing , application and management of rural water supply and sanitation base in the gram panchayats. In every village where the projects are on implementation a VWSC committee is formed, and this committee works as the functional institution at the grass roots level. It acts as the extended hands of the gram panchayat for the rural water and sanitation management. VWSC is the institution responsible for community based monitoring mechanisms and raising funds for maintenance and smooth running of the system. Sl. no NAME GENDER AGE OCCUPATION 1. Arun Kumar swain Male 27 Pump Operator 2. Bahan Swain Male 45 Business 3. Gopinath swain Male 41 Business 4. Lakhi Narayan Swain Male 40 Farmer 5. Dobha Swain Male 51 Farmer 6. Sanjay swain Male 38 Business 7. Savita Swain Female 40 Home-maker 8. Rohini swain Female 47 Home-maker 9. Promodini swain Female 40 Home-maker 10. Rijili swain Female 30 Home-maker 11. Bhagya Lata swain Female 30 Home-maker 12. Shanti Lata swain Female 60 Home-maker 13. Padma swain Female 65 Home-maker 14. Nili swain Female 40 Home-maker 15. Kasturi swain Female 45 Home-maker 16. Maluni swain Female 55 Home-maker List of VWSC members in Kusaguma village Village Health and Sanitation Committee (VHSC) The village health and sanitation committee also known as Gaon Kalyan Samiti is formed for the monitoring of the plans and improving health and sanitation levels of the villages under the different state and central government programs such as the National Rural Health Mission. It plays a major role in identifying the local health issues and undertaking suitable measures in solving those issues. At the Village Level Swachhagrahis are appointed to work at the village level, they work as the motivators for bringing a behavioral change among the villagers with respect to sanitation practices and usage of clean water for consumption, and also for the monitoring the cleanliness of the facilities. According to the norms every village ideally should have at least one Swachhagrahis, who preferably should be a woman candidate. The Swachhagrahis can be an ASHA worker, ANM, Anganwadi worker, water line man, pump operator or anyone who is a resident of the impending village.
- 9. Village background. Kusaguma is a small Village in Dharakote Tehsil in the Ganjam District of Odisha State, India. It is located 67 KM towards west from District headquarters in Chhatrapur. Dharakote ( 4 KM ) , Jaga Mohan ( 5 KM ) , Jharapari ( 6 KM ) , Mundamarai ( 7 KM ) , Suramani ( 9 KM ) are the nearby Villages to Kusaguma. Kusaguma is surrounded by Aska Tehsil towards East , Surada Tehsil towards west , Sheragada Tehsil towards South , Bellaguntha Tehsil towards North and is 175 KM from State capital Bhubaneswar. There is a total of 101 households in the village with a total Population of 636; 289 male, and 347 females. There are no BPL houses in the village as of 2019. All the households in the village are of the same caste i.e. OBC. As a source of income the village primarily relies on agriculture, and villagers also practice manual labour works in the nearby towns. There are two shops in the village. The condition of water and sanitation in Rural Orissa is not very bright at the moment, A larger part of the rural population in Odisha still does not have access to water which is fit for human consumption and proper sanitation facilities which has resulted in major water-borne diseases to the people residing in the rural areas. The village Kusaguma was no exception and suffered from the same issues. Situation before Before the intervention by gram Vikas the villagers used to take bath in the ponds, the village has 5 ponds but water in the ponds are unfit for consumption and bathing purpose and also dried up in the summer. The only way of obtaining drinking water was from tube well, the water in which too dries up in the summer season. Open defecation was practised by all the people and the ponds were used for this purpose. Other than this the ponds were also used for washing daily clothes, utensils and even animals.
- 10. This germinated severe health issues in the village, People in the village Particularly the women experienced lack of privacy and was not able to wash themselves properly, which often resulted in gynaecological problems. Another serious issue affecting women was to having to wait for getting dark before they were able to revive themselves. Collecting safe Drinking water was another big task for the ladies they sometimes had to commute for 2 -3 km in search of safe drinking water. Even the village school didn’t had water and sanitation facilities due to which particularly girl children and female teachers faced problems. Other than these Water borne diseases such as Diarrhoea, Vomiting and scabies were very common. How it all started The intervention initially started with the discussion of gram Vikas field workers with the villagers about the disadvantages of deification in the open and its impact on health. The villagers were informed about the major issues concerning the health of the villagers. Awareness was spread in the village about proper Sanitation and hygiene. Meetings were arranged by Gram Vikas to every household with. The purpose of creating awareness of sanitation and excite the villagers which would eventually create a demand for sanitation facilities in themselves. Concurrently, discussions and activities were held in the village to create a feeling of hatred for deification in the open among the villagers. The work for the bathrooms and the water tank started in the year 1998 and was completed by the year 2001. A corpus fund of Rs. 1000 was collected from every household. The corpus fund generated a total of 80,000 back in 1999 as there were 80 houses in the village back then. The amount was kept in a fixed deposit so that the interest generated from this amount can later be used to facilitate the same facilities of water and sanitation to the new household built in the village. This makes the project sustainable. The corpus fund can also be used if there is a need of major repair in the water supply. The water tank built by Gram Vikas has a capacity of 32,683 litres and was supplying water round the clock. Every household is given a connection of 3 taps, one in the toilet, bathroom and in the kitchen. The project received a grant of Rs. 7,09,191. For implementing sanitation Gram Vikas gave an incentive of Rs. 3000/unit. The people too contributed in terms of providing labour and also local material such as sand, wood etc. Odisha Government Gram Vikas Villagers Total Sanitation Expenses 36,500 2,02,500 1,84,356 4,23,356 Water Supply Expenses Nil. 2,30,158 55,676 2,85,835 Total 36,500 4,32,658 2,40,032 7,09,191
- 11. The project was Inaugurated by the then MLA of Sorada SHRI KISHORE CH. SINGH DEO on the 14th of February 2005. After the intervention After the completion of the project by Gram Vikas there was a real sense of dignity among the villagers of Kusaguma. The village also saw a tremendous increase in sanitation and hygiene awareness and education which includes washing hands with soap after deification, and before and after consuming food and also serving meals. Student clubs were made in school where students were taught how they can take personal hygienic and also how to keep the surroundings clean. Water- Borne diseases have reduced drastically after the intervention permitting the people to get involved in other important works. Women are now more aware of hygiene, have privacy and can wash properly in the bathrooms. With taps in every household there is no need to commute for water now and with the extra time saved they can get involved in other productive work which may include extra-income generating activities. There is also seen an increase in girl student enrolling at school and also retention of girl student. Water quality Management Human actions had led to various pollutants in the world such as fertilizers, pesticides, animal wastes and other components occurring in the nature, which can cause pollution in the water and may lead to negative impact on the environment. It is very difficult to be managed by the conventional piped drainage and need active participation from the people to identify the problem and react accordingly. Pollutants, contaminants or sediments may get washed into the sewage systems and water courses in surface water runoff, making it difficult to comply with water quality legislation. Improving and monitoring the quality of water and the receiving waterbodies is very necessary. Water quality improvements can lead to a number of benefits including aesthetic, health or enhancing recreation and opportunities for wildlife and biodiversity.
- 12. Clean Drinking Water should be: • Free from Pathogens. • Clear. • No foul smell. • No chemicals. For achieving the above goals proper monitoring of water from time to time is very necessary. Picking up pace with the current needs the village Kusaguma has also started the water quality management in collaboration with Gram Vikas. Training for testing the water is given to a member of the Village Water and sanitation committee (VWSC) preferably the pump operator as he takes care of most of the issues related to water and sanitation the village. The Pump operator is given an Inspection kit which comprises of all the instruments and apparatus required for testing the quality of water. The person doing the testing is also given an access to a data Management System application on the mobile in which he needs to upload the status of the work. The most common threat for water contamination in Ganjam district is: • Nitrate • Fluoride • Bacteria Nitrate Fluoride Bacteria Where it comes from Fertilizer, animal dung and urine. Rocks deep in Ground. Animal or Human Feces. Impact on humans Causes oxygen problems in the blood and “blue baby Syndrome. Human teeth (dental fluorosis) Harms the skeleton (skeleton fluorosis) Causes diarrhea, cholera, dysentery, typhoid and other water borne disease. Steps of water quality Management in the village. • Village meetings and resolutions. • Testing and writing water quality results in a register. • Identifying sources of contamination by sanitary survey. • Fixing or advising to fix the source of contamination. The process The process of water quality management involves
- 13. 1.Creating a map A map is made showing all the households in the village and the pipelines through which the household is connected to the water supply. From this map households are selected from where water samples are to be collected. Samples are normally collected from household located at the extreme corners of village covering all the direction. Also on request if a person raises a complaint about water in his/her house, it is tested. Map showing household and pipelines 2.The testing The VWSC member responsible for water testing marks the houses on the map where he needs to collect the sample from and after doing the marking starts collecting the sample from the households marked. Nitrate test
- 14. Countermeasures • The presence of Nitrate in water is mostly because of Fertilizer, animal dung and urine in the vicinity of the water source. So, the potential reasons are identified and accordingly the household is advised. • Farmers are advised to keep their water source away from the agricultural fields if they are using chemical fertilizers. Fluoride Test Test Process Indicators Nitrate test • Collect the 5ml water sample from the household. • Add a spoon of NO3- A Reagent Powder to the sample. • Add a spoon of NO3- B Reagent Powder to the sample. • stir the solution in the test tube for the water to mix well. The solution on stirring starts to change its color to shades of pink. Standard color chart for nitrate in mg/l 10 45 100 Permissible limit portable water =45mg/l
- 15. Countermeasures • Keeping litters, Tobacco, tea, dying and printing products, aluminum industries effluents etc. away from the water source. • If the test results exceed the permissible range and fluoride is found in the water defluorination techniques can be used. Activated alumina is a good adsorbent of fluorine removal in water. Bacteria test Test Process Indicators Fluoride Test • Collect 50ml sample in a test tube. • Add zirconyl solution till 52.5 ml on the test tube. • Allow the solution for an hour to develop the colour. After an hour. Standard color chart for Fluorine in mg/l 0.6 1.5 3.0 Permissible limit portable water =1.5 mg/l
- 16. Countermeasures • By advising the fellow villagers not to defecate in the open. • Checking for leakages in the water supply pipes. 3. mWater The test result is then uploaded on mWater. mWater is a data management software and is used in more than 150 countries for conducting water and sanitation surveys. It makes the data more accessible and eliminates the wipe out of paper and pen. Data on paper often dies when it stagnates, lying on desks and file cabinets without being read or analyzed. mWater brings the data upfront to the world. 4. Fixing the source of contamination • Collect Funds • Labor. • Collection of materials. • Maintaining records. What is the crisis now? For the last 20 years, the villagers were getting round the clock water supply to their houses with the 3 taps installed in their houses, one in the kitchen, toilet and bathroom. Test Process Indicators Bacteria test • Water sample of the target Household is collected in a bacteriological vials which is readily available with the field worker. • The sample is kept for 24-36 hours at room temperature. After 24-36 hours Standard color chart for bacteria in water. No Bacteria Presence of bacteria
- 17. But now, since summers,2018 the village is again facing scarcity of water due to the falling water table, The water tank draws water from a 450ft deep borewell which at the moment is not able to cater to the population of the village. It is not able to fill the water tank completely in the time it should and there are a few houses which are located on a higher land so, there is not enough pressure so as to reach those houses. Recently few months back another borewell was drilled at a nearby location in search of water and this time they went 300 Feet deep. It was dug by Truck mounted pneumatic drilling m/c size 61/2’’. But it was not successful. So, for the time being the villagers have limited the availability of water for a few hours in the morning and few hours in the evening time. Which is causing trouble to the village. Issues with limiting the water supply for few hours in the morning and evening. limiting the flow of water in the village can cause serious health issues. When the water is not supplied through the pipes into the houses, it allows a biofilm and bacteria to grow in the stagnant water in the low points of the system. When the water is pumped back into the pipes and the system is switched back on, this biofilm and bacteria is flushed out of the system. The user may often collect this water, which is full of contaminants and consume which may lead to illnesses such as diarrhoea. Another issue is the low level of pressures that happen while all the users come to collect at once. Studies have shown that at low levels of pressure pipes have high concentrations of bacteria, which could again lead to illness. Village Kusaguma water usage. Demographics So, the total population of the village if 540 and the total number of households in the village is 101. Taking an average of 5 members in each household. We can calculate the average daily water consumption of an household. No. of Household Total Population male female 101 540 290 250 source: door to door survey 1 Usage of water Total usage in a day. % usage Bathing and toilet 170 359 47.35 Cooking 12 359 3.34 Drinking 21 359 5.84 Washing clothes and utensils 100 359 27.85 Cleaning house 15 359 4.17 Others 41 359 11.42
- 18. Table 1:average water consumption of every household From the above table we know the average consumption of water in each house for a family of five members. In village Kusaguma there are 101 household so the total consumption of water in the village will be, 101×359= 36,259 litres of water1 From the above chart we can see that a person mostly uses water in Bathing and toilet followed by Washing clothes and Utensils. the below methods can be used to use the waste water efficiently. I. Awareness: • Stop the flow of water when not needed. • Use water judiciously while bathing and not waste water unnecessarily. II. Grey water recycling: Grey water refers to domestic waste water that is drained from sinks, bathrooms, the water after washing clothes. It is free from human or animal faeces, Grey water can be reused in. • Kitchen Garden. Water Demand It is seen that the demand of water doesn’t remain the same throughout the day, it varies from hour to hour according to the requirement of the villagers. Variation in rate of demand may be defined by the followings: • Hourly variation: The rate of demand of water is not the same throughout the day. It may vary hourly. On a holiday or festival the peak hours may be 8:00 a.m. whereas on regular working days it may be 6:00 a.m. 47% 3%6% 28% 4% 12% Percentage usage of water Bathing and toilet Cooking Drinking Washing clothes and utensils Cleaning house Others
- 19. • Seasonal Variation: During the summer season people will use more water in bathing, cooling, consuming etc. so the demand of water is maximum during the summer season. And in winter less water will be used for bathing and other purposes. So the demand during winter is less compared to in summers. • Daily Variation: The rate of Demand of water may vary from Day to day as well. It may happen so because of the habits of people, holidays and even because of the climatic condition. Table 2: Demand of water hourly Time Water consumption Water consumption (Summers) Water consumption (Festivals) reason 12:00 A.M – 4:00A.M 540 litres 648 litres 540 litres Everybody sleeping. 4:00 A.M – 7:00 A.M 3,500 litres 4,200 litres 540 litres Farmers go to their farm. 7:00 A.M – 10:00 A.M 20,652 litres 28,875 litres 33,075 litres Everybody gets ready for work i.e. bathing and toilet. Women prepares breakfast. Most water used during this time. 10:00 A.M – 1:00 P.M 12,827 litres 17,957.8 litres 25,720 litres Washing utensils/ washing house/ Preparing lunch. 1:00 P.M – 4:00 P.M 1,200 litres 1,680 litres 2,040 litres Women and elderly person are at home. No much usage of water. 4:00 P.M – 7:00 P.M 16,825 litres 20,190 litres 28,602.5 litres Males come back from work. Using bathroom to freshen up. 7:00 P.M – 10:00 P.M 3,232 litres 4,201.6 litres 5,494.4 litres Preparing Dinner and washing utensils. 10:00 P.M – 12:00 A.M 540 litres 648 litres 540 litres Everybody goes sleeping.
- 20. 0 5000 10000 15000 20000 25000 12:00 A.M. - 4:00 A.M. 4:00 A.M. - 7:00 A.M. 7:00 A.M. - 10:00 A.M. 10:00 A.M. - 1:00 P.M. 1:00 P.M. - 4:00 P.M. 4:00 P.M. - 7:00 P.M. 7:00 P.M. - 10:00 P.M. 10:00 P.M. - 12:00 A.M. water consumption (winters) Person Bathing and toilet cooking Drinking Washing clothes and utensils Cleaning house Others Total Men 35 - 5 - - 8 48 Women 40 12 5 100 15 8 175 Child 25 - 3 - - 5 33 Grandparent 1 35 - 4 - - 10 49 Grandparent 2 35 - 4 - - 10 49 Total 170 12 21 100 15 41 359
- 21. The graph above shows the demand of water during winter. • The above graph clearly shows that during summers there is a rise in the demand of water as people require more water for bathing, toilet and consumption. • The above graph shows the difference between the demand of water on regular days and on the day of some festivals. It can be clearly observed from the graph that. o People wake up late during festivals. 0 5000 10000 15000 20000 25000 30000 35000 12:00 A.M. - 4:00 A.M. 4:00 A.M. - 7:00 A.M. 7:00 A.M. - 10:00 A.M. 10:00 A.M. - 1:00 P.M. 1:00 P.M. - 4:00 P.M. 4:00 P.M. - 7:00 P.M. 7:00 P.M. - 10:00 P.M. 10:00 P.M. - 12:00 A.M. Water Demand ( summer Vs Winter) water consumption (winters) water consumption (summers) 540 3500 20652 12,827 1200 16,825 3232 540648 4200 28,875.00 17957.8 1680 20190 4201.6 648540 540 33075 25,720 2040 28602.5 5494.4 5400 5000 10000 15000 20000 25000 30000 35000 12:00 A.M. - 4:00 A.M. 4:00 A.M. - 7:00 A.M. 7:00 A.M. - 10:00 A.M. 10:00 A.M. - 1:00 P.M. 1:00 P.M. - 4:00 P.M. 4:00 P.M. - 7:00 P.M. 7:00 P.M. - 10:00 P.M. 10:00 P.M. - 12:00 A.M. Water Demand ( summer Vs Winter vs festival) water consumption (winters) water consumption (summers) water consumption (festival)
- 22. o Water consumption is high than regular as they may have guests. o More water is needed between 10:00 A.M to 1:00 P.M as this is the time to cook and being a festival. There are more dishes to be cooked and served to more people than regular. o The same happens during the evening as people celebrate. Calculating the size of the tank Population in the next 20 years. Population (2019) Population (2018) 540 490 Growth % = "#$$%&' )%*$ + ,$%-./#0 )%*$ ,$%-./#0 1%*$ i.e. 234+354 354 therefore, the Population Growth Rate is 10.20% The following equation is used to determine the population in the upcoming 20 years: P = 𝑃𝑜 :1 + 𝑟 ∗ 𝑁 100 A 0 5000 10000 15000 20000 25000 30000 35000 12:00 A.M. - 4:00 A.M. 4:00 A.M. - 7:00 A.M. 7:00 A.M. - 10:00 A.M. 10:00 A.M. - 1:00 P.M. 1:00 P.M. - 4:00 P.M. 4:00 P.M. - 7:00 P.M. 7:00 P.M. - 10:00 P.M. 10:00 P.M. - 12:00 A.M. comparison water consumption (festival) water consumption (summers) water consumption (winters)
- 23. P = 490 :1 + 10.20 ∗ 20 100 A On solving the above equation, The population of the village after 20 years comes to be = 1490 people. Where P0 = Original Population (people) R = Percentage population rate Growth (percent) N = Number of years. Average daily Usage (Qave) Once the projected population is found out, the average daily water demand can be calculated, by assuming a demand per person. Assuming the average demand to be = 71.8 litres. Qave = [PN × 𝜔R] Qave = [1490 ´ 71.8] = 1,06,982 litres/day. Where Qave = average daily usage. PN = Projected Population 𝜔R = volume of water demanded. Maximum daily Usage (Qmax) Now, we can easily calculate the maximum daily water demand by just multiplying Qave to the safety factor (1.25 – 1.50) In this case, we are taking the safety factor = 1.4 (assumption) Qmax = Qave ´ Safety Factor Qmax = 1,06,982 ´ 1.4 Qmax = 1,49,774.8 litres/day Where Qave = average daily usage. Qmax = Maximum daily usage (litres/day) Peak Demand (Qpeak)
- 24. The maximum volume of water delivered to the system in a single hour expressed in Litres per day. Distribution systems should be designed to adequately handle the peak hourly demand or maximum day demand plus fire flows, whichever is greater. During peak hourly flows, storage reservoirs supply the demand in excess of the maximum day demand. We need this because water in Kusaguma is not needed throughout the day. And 8 hours of water supply is enough. Peak factor (Cp) A peaking factor tells us how many times greater than our maximum demand daily our peak demand will be. Standard peak Factor can be determined with the help of an standard table. The population in Kusaguma is 540 so the peak factor would be: Population Cp <500 2.9 500 - 5000 2.9 – 2.5 5000 - 50000 2.5 – 2.1 50000 - 500000 2.1 -1.9 So, we take 2.9 as the peaking factor since 540 is the closest population. Now, Qpeak = Qmax´ Cp Qpeak = 1,49,774.8 ´ 3 Qpeak = 4,49,324.4 litres. Where Qpeak = peak demand of the system (litres/day). Qmax = Maximum daily usage (litres/day). Cp= Peak Factor. We, now can calculate the amount of time that the peak flow would be demanded in any one day with the following equation: 𝜏peak = Hmax Qpeak 𝜏peak = P,35,RR3.S 3,35,TU3.3 𝜏peak= 0.33 Which on converting comes to (0.33 ´ 24) = 8 hours Assuming the source flow rate i.e. Qmin = 1 litre/ sec which is 86400 litres/day We take the peak flow minus our source’s flow and multiply it by the amount of time that flow will be demanded to get the size of our tank. This will give us a tank that can supply continuous flow even if the users demand peak flow for our entire estimated time.
- 25. VTank= (Qpeak – Qmin – source) ´ 𝜏peak VTank = (4,49,324.4 – 86400) ´ 0.33 VTank = 1,19,765.052 Litres VTank = 4277.706 cubic feet. To cater the future needs of the people the tank should be of 4277.706 cubic feet capacity at a flow rate of 1 litre/sec. Findings Conserving Water Fresh, clean water is a limited resource. While most of the planet is covered in water, it is salt water that can only be consumed by humans and other species after undergoing desalination, which is an expensive process. Occurrences such as droughts further limit access to clean and fresh water, meaning people need to take steps to reduce water use and save as much water as possible. In some areas of the world, access to water is limited due to contamination. People who have access to fresh water can take steps to limit their use of water to avoid waste. Ways of conserving water common in India. • Johads • Zabo • Kul • Rain water harvesting. The village Kusaguma lies in the Ganjam District and receives a good amount of annual rainfall. rain water harvesting can be used for the conservation of water. Since, the village in recent times is facing a shortage of water as the water table is fallen below, rain water harvesting can be a good alternative and play an active role in fulfilling the daily need of water for the people of Kusaguma. Rain water Harvesting Rain water Harvesting is a technique or strategy for the collection of rainwater and storing it in the right way for future use. The water can be collected from various surfaces and platforms and stored for later use. In most cases, the water is usually collected from rooftops and other hard surfaces. Rainwater harvesting is considered as a very reliable way to conserve water. This technique has been around for a very long time, practiced in the ancient times. Over the past years, this ancient method of water storage has grown quite popular. It plays a vital role in reducing the use of potable water and increase reliability on rainwater. Benefits of Rain water Harvesting.
- 26. • The basic system can be very simple and easy to construct which can be further engineered according to the needs. • It is a one-time investment and can be built at costs as low as Rs.2500 – Rs. 5000. • The maintenance is easy and simple. • Avoids Tragedy of commons as it is personal to every household. The Monthly recorded rainfall in Dharakote is as follows. The readings taken in this report has been taken of Dharakote as The readings of Kusaguma was not available and Dharakote was the nearest location (5 km )whose record was available. 0%0%1%2% 5% 5% 17% 22% 32% 15% 1%0% Rainfall January February March April May June July August September October November December Month Days Mm January 0.0 0.0 February 0.0 0.0 March 1 20 April 3 32.20 May 6 92.00 June 7 82.30 July 15 289.30 August 15 382.80 September 15 538.00 October 09 255.00 November 1 11.05 December 0 00.00 Total 72 1702.65
- 27. From the above analysis it can be seen that, Most of the rainfall is received in the month of September which if stored can be used for irrigation later in the winters, as the village at current highly relies on submersible pumps for irrigation which is more expensive and not easily accessible for the marginal farmers. There are 101 houses in the village and the village had around 72 rainy days in the year 2019, it can be said, if the houses of the village has a roof of estimated 100 sq. meter can gather about 1,70,265 litres of water. Conserving water even at an efficiency of 80% = S4 P44 × 1,70,265 =1,36,212 litres Daily household need for water = 359 litres Days water from roof can last each household = 379 days (approx.) Water generally used by a person. Purpose Usage of water % usage Drinking 5 3.96 Cooking 12 9.52 toilet 34 26.98 Washing clothes and utensils 50 39.68 Cleaning house 15 11.90 Others 10 7.93 Total 126 litres 100% 0 0 20 32.2 92 82.3 289.3 382.8 538 255 11.05 00 0 1 3 6 7 15 15 15 9 1 00 100 200 300 400 500 600 JANUARY FEBRUARY M ARCH APRIL M AY JUNE JULY AUGUSTSEPTEM BER OCTOBERNOVEM BERDECEM BER Rainfall Days
- 28. It can be seen that we use a Huge proportion (78.57 %) of drinking water in toilets, Washing clothes and utensils and cleaning house and for these purpose harvested rain water can easily be used. The system The system is very simple and primarily consists of : • Collection Area • Transmission system • Storage tank Collection area : The collection area is mostly the roof of the house. The roof of the house or the area in which it is to be done should be clean and preferably made up with chemically Inert materials so as to avoid the degradation of the quality of water. Transmission System: the transmission system usually consists of pipes which transfers the collected water from the roofs to the storage tank. The pipes used for the transmission system should be made from chemically inert materials such as plastic, aluminium or fibreglass so as to avoid tempering the quality of water. Water tank: The water tank should also be constructed of inert materials and are required to be clean to avoid contamination. They can be constructed as the part the building or may also be constructed as separate units at some distance from the building/house.
- 29. Recharging Ground water Recharging the ground water of Kusaguma is very necessary as the village already is facing water shortage due to the fall in the Ground water level. Groundwater recharge is a process where the surface water moves downward from surface water to groundwater. Recharge is the primary method through which water enters an aquifer. Recharge occurs both naturally (through the water cycle) and through artificial groundwater recharge where rainwater is routed to the subsurface. Rainwater may be charged into the groundwater aquifers through any suitable structures like dug wells, Borewells, recharge trenches and recharge pits. Reasons for not yet being implemented. • Lack of awareness. • Lack of funds as initial cost is a bit high considering the farmers. • There was no such scarcity of water in the recent past.
- 30. Other ways of overcoming the problem of water scarcity. Applying change Management. Plans for the turnaround The village water and sanitation (VWSC) committee is discussing about the following changes to make. • The VWSC is planning to drill a deep borewell at some other location. • Meetings are being conducted in the village about tackling the current situation. • The committee plans to start mobilizing the funds for the borewell. • The committee is also trying to approach the Odisha government, through the Rural water supply & sanitation (RWSS) The village committee in the consultation with Odisha government has already started surveying for a new location for the drilling of new borewell and aims to accomplish the goal by summers 2020. The other changes must be implemented also by that time, but there is no detailed schedule yet. So far, only the drilling of new borewell has been officially announced to the fellow villagers of Kusaguma. The details are not complete for the other targets listed above, which are yet to be officially announced. Current Situation and challenges According to the Village water and sanitation committee, there are major roadblocks standing in the way of successful evolution. • The village committee has consensus about the direction, but other is often hindered because of the other ongoing development works of the village. • The youth of the village is not taking the issue seriously as most of the youth migrates to Surat in order to earn a livelihood as soon as they appear their matriculation exam. • The VWSC President and other members are all task focused people and has low “people” awareness and communication skills which limits their thoughts in understanding communication strategy and aspects of change management. • With the failure of one borewell the morale of the villagers is getting low day by day. Applying Change Management to the village Based on the already low morale and the upcoming change, a very high resistance can be expected from the villagers. This calls for very strong leadership and a well prepared change management process.
- 31. I will be offering my suggestions for a change management plan by applying the Kotter’s 8-step change model. Step 1: Create a sense of Urgency: There is a good sense of urgency in the committee and women of the village, they understand the urgency of the new borewell or need for other water source which would fulfil their future water needs. But there is no urgency in the youth of the village. When I spoke to the village youth I can empathize with their anger of unavailability of source of income in the local vicinity which is the reason for them to migrate to bigger cities like Surat where they have better income. They often move and plan to settle in cities rather than coming back to the village. In recent past there are a few families which moved to cities giving their land on lease to other people. My suggestion is to prepare a good communication plan and spread the awareness to the youth. The village president and the VWSC committee should honestly tell the people about the ground reality of the situation and approach them in a way which generates trust and hope. The communication should be effective and besides telling the facts to the people it should also touch people’s heart, awakening the energies that is slumbering in each person of the village. Step 2: Creating the coalition: The village committee is already formed as a guiding coalition. However, in my view this is not ample to convey to the entire population of the village to push forward the change project. The projects demands more active participation of the villagers and specially the youth. As an initial step the committee should work with the youth. Involving them in the village development programs would not only help the change process but also serve as a recognition and development benefit. Step 3: Creating a vision for change: I think, the present change objectives are problem solving in nature. Their approach is right, but at the moment it isn’t much appealing to the villagers. I suggest using creative ways which can integrate villagers self needs and desires to represent the vision and the “feel” of the village after the change, and to design long-term sustainability for the people. Step 4: Communicating the vision: As mentioned in the communication plan at “step 1: Creating a sense of urgency” just adding a point: the committee should model the expected behaviours. By “walk the talk”, the village committee can send out a strong message that the things now are not the same as it used to be in the past. Step 5: Removing obstacles: The current obstacles can be removed by organizing more meeting and educating the villagers through those meetings. Money often plays the role of big obstacle in development works and
- 32. can be overcome by giving financial aid to the poor families from the village funds. Monetary punishment to the villagers delaying the process. Step 6: Creating short time wins: Short time wins would be to start mobilizing people and target the youth of the village, Start approaching the government for fixing the existing problems of the current water supply system, also increase the social capital of the people and develop a good understanding with the people around. Step 7: building on the change: Once you start getting the initial results, start taking more projects, and drive the changes deeper. One of the way of achieving that could be by building platforms for continuous improvement. Setting up a suggestion box and asking for feedback can also work in order to improve the efficiency of the organization and to make it run more smooth and effectively. Step 8:incorporating the change in the culture: Make the people feel proud of the end results, and create a legacy. Another suggestion would be to spread the achievement. Tell it to people around, create a positive learning environment and share the experiences. Organize training sessions regularly and share the new learnings if any. Key tasks to support the change The supporting team such as the HR manager should be patience as this kind of work takes a lot of time to be implemented. The managers need to follow POSDCORB i.e. there should follow the management function in order the end results. There should be proper planning and vision in the HR manager and the administrative staff.
- 33. Conclusion Staying in the village and looking at the water management was a very good experience and I would like to conclude that. • The village should take immediate efforts to resolve the water issues. • The village should look for alternative sources of water. • The village Should implement Rain water harvesting at community level since the annual rainfall of the area is high. • The village should lay infrastructure to recharge ground water.