Amsler's grid test
•Download as PPTX, PDF•
12 likes•3,156 views

Amslers grid test is one of the macular function test, it assess central 10 of visual field

Recommended
More Related Content
What's hot
What's hot (20)
Similar to Amsler's grid test
Similar to Amsler's grid test (20)
More from RASHAD MUHAMMED
Recently uploaded
Recently uploaded (20)
Amsler's grid test
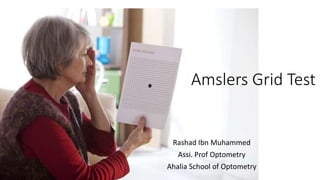
- 1. Amslers Grid Test Rashad Ibn Muhammed Assi. Prof Optometry Ahalia School of Optometry
- 2. Amslers • The Amsler Grid is a rapid, qualitative technique designed to test the central 10° of the visual field, using a standard chart with a grid of white lines on a black background • Each square of the grid is 5 mm, subtending approximately 1° at 30 cm. The patient is requested to describe lines that are missing or distorted. • The chart consists of a grid of lines with a central fixation dot, the whole chart at 30 cm. distance subtending an angle of 20° • It is one of the macular function test • And is a test to observe or treat the macular diseases
- 3. Some points to know • The macula is a round area at the posterior pole, lying inside the temporal vascular arcades. It measures between 5 and 6 mm in diameter, and sub serves the central 15–20° of the visual field • Relative scotoma –Blurred Image • Absolute scotoma- Complete absence of image • Metamorphopsia- Distortion of images • Micropsia-image is smaller than normal • Macropsia-image is larger than normal
- 5. Home Chart
- 6. Procedure 1. Seat the patient comfortably in the examining chair with the appropriate near correction. 2. As the working distance for the test is 30 cm, ideally a 3.25 D near add should be used for absolute presbyopes. However, the patient’s own spectacles are usually satisfactory given sufficient depth of focus 3. Use single vision glasses or trial lenses, but avoid multifocal lenses. 4. Position yourself so as to be able to occlude the non-viewing eye and measure the working distance. Get the patient to hold the chart at 30 cm. 5. Keep the room lights on. The method is qualitative and critical light levels are not essential; however, it is useful to be able to reproduce approximate ambient luminance levels.
- 8. 6. Patient is asked to look at the central dot of the chart at all the time. 7. Patient is instructed to draw on the chart if he notices any missing and distorted areas/ lines 8. In some cases central vision become blurred due to fluid accumulation in the Macula. So in Amsler Grid testing we get central scotoma (non seeing area) along with distorted line or wavy line. 9. Repeat the procedure for left eye
- 9. Amsler grid superimposed on the macula of central 20°
- 10. Type of charts available Chart no -1 There are seven charts, each consisting of a 10 cm square 1. Chart 1: the standard chart used in every case. Consists of a 5mm square, white grid with each square subtending approximately 1° from 30cm, on a black background with a central, white fixation target.
- 11. 2. Chart 2: similar to Chart 1 but with two diagonal white lines to assist steady fixation in patients with a central scotoma. 3. Chart 3: similar to Chart 1 but with a red grid. It has been reported to be useful in the toxic amblyopia's and optic neuritis, but is also capable of testing the malingerer when used in conjunction with red and green filters. 4. Chart 4: consists of scattered white dots with a central, white fixation target. It appears no more sensitive than the standard chart for relative scotoma’s and cannot detect metamorphopsia. 5. Chart 5: consists of white parallel lines only and a central, white fixation point. The chart can be rotated to change the orientation of the lines and is used to investigate metamorphopsia along specific meridians. 6. Chart 6: similar to chart 5 but has black lines on a white card with additional lines at 0.5° above and below fixation. 7. Chart 7: similar to Chart 1 but with additional 0.5° squares in the central 8°. This chart is used for detection of subtle macular disease.
- 13. Recording • Record defects or disturbances on an Amsler recording sheet. Always record the eye tested, the date of examination and the patient’s name. • Ensure that if no defects are detected, this is recorded clearly in the patient’s file, • e.g. Amsler charts: central fields full R and L (OD & OS)
- 14. Interpretation • Metamorphopsia and relative scotoma may indicate macular oedema • Absolute scotoma indicates scars, atrophy and lesions in macular region • Advanced glaucoma can show a peripheral absolute scotoma • ARMD, retinal edema, exudates and epiretinal membrane can show distortion
- 22. Binocular Amsler test 1. Use of an Amsler chart can be very helpful in understanding the difference between anisometropic amblyopia and the amblyopia of microtropia. 2. Amblyopia with anisometropia a central scotoma is almost always indicated by the patient, whereas in microtropic amblyopia with central fixation the scotoma is as a rule paracentral and on the temporal side. 3. The Amsler chart with red lines has proved to be more sensitive than that with white ones. 4. The patient must always be asked to compare the amblyopic eye with the good eye.
- 23. Infront of good eye Infront of Amblyopic eye
- 25. Common Errors 1. Not ensuring that the patient views the central fixation target throughout the test. 2. Using an incorrect working distance. 3. Using an inappropriate near correction. 4. Using the patient’s bifocals with a small reading area. 5. Using monocular test binocularly
- 26. • The Amsler chart is a simple, inexpensive, noninvasive, harmless, portable, and suitable tool and of a mass screening ability that easily detects different macular lesions
- 27. The end